SaaS Valuations: 2026 Statistics, Data & Trends (Comprehensive Report)
Complete 2026 SaaS valuation report: market size ($530B), ARR multiples (3.8x median), NRR benchmarks, churn rates, and 40+ verified statistics from SaaS Capital, Grand View Research, and more.
The SaaS valuation landscape has undergone a seismic shift. After the “SaaSpocalypse” of early 2026 erased approximately $1 trillion in aggregate SaaS market capitalization—including $285 billion in a single 48-hour window in February—investors and operators are navigating a fundamentally changed environment. The median ARR multiple has collapsed from 7.0x at the start of 2025 to just 3.8x by March 2026, according to the SaaS Capital Index.
Yet beneath these headline figures lies a more nuanced story. Top-quartile SaaS companies—those with net revenue retention above 120%, Rule of 40 scores exceeding 50, and credible AI defensibility—still command 7x to 9x ARR multiples. The gap between winners and losers has never been wider. This report compiles 40+ verified statistics from SaaS Capital, Grand View Research, Mordor Intelligence, Aventis Advisors, and other authoritative sources to give you the complete picture of SaaS valuations in 2026.
Key Statistics at a Glance
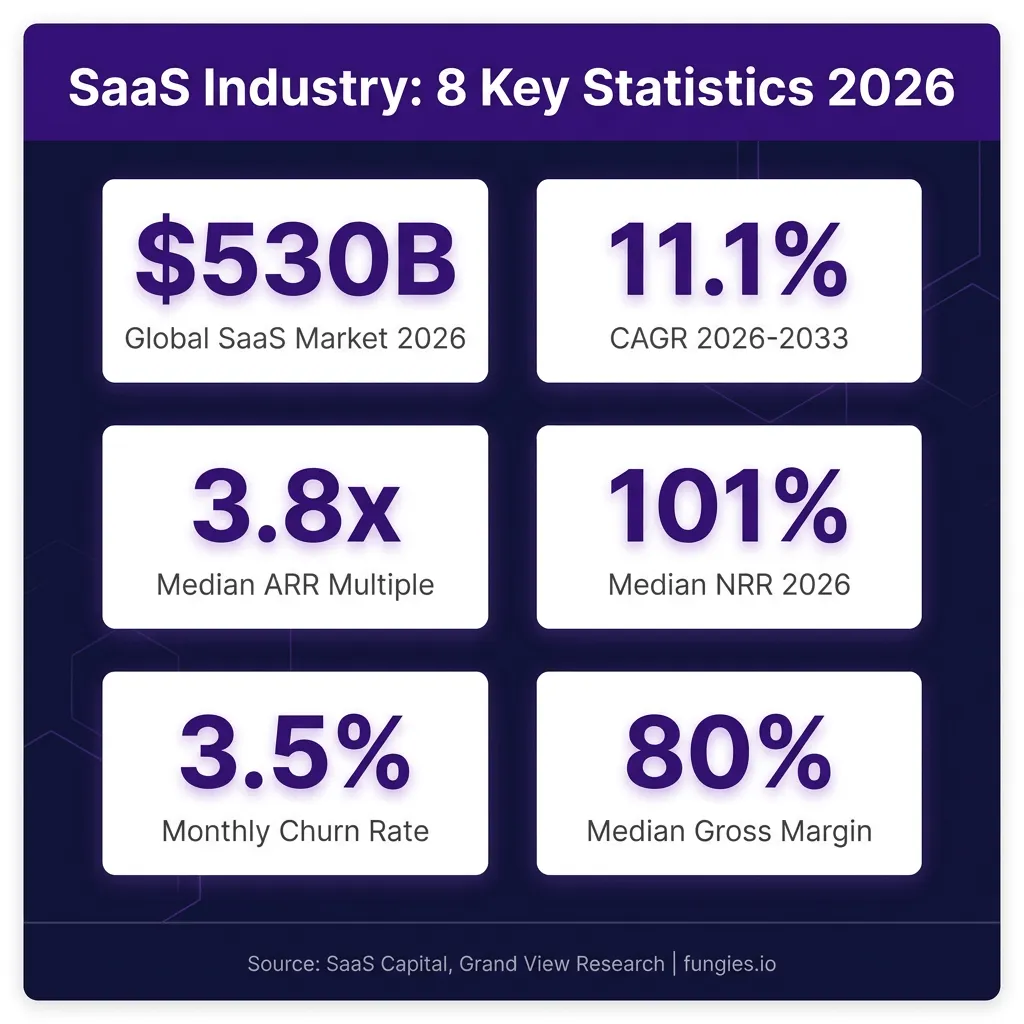
Global SaaS market size (2026): $530.0 billion, projected to reach $1.1 trillion by 2033
Market CAGR (2026-2033): 11.1% according to Grand View Research
Median ARR multiple: 3.8x (down from 7.0x in early 2025)
Top-quartile ARR multiples: 7x-9x for companies with NRR >120% and Rule of 40 >50
Median net revenue retention: 101% across all private B2B SaaS (down from 105% in 2021)
Enterprise NRR benchmark: 118% for companies with ACV >$100K
Monthly churn rate: 3.5% average for B2B SaaS (2.6% voluntary, 0.8% involuntary)
Median gross margin: 80% for software revenue, 76% blended
LTV:CAC ratio target: 3:1 minimum, 5:1+ for efficient growth
Median CAC payback: 8.6 months for B2B SaaS
Market Size & Growth
The global Software-as-a-Service market reached an estimated $464.7 billion in 2025 and is projected to grow to $530.0 billion in 2026, according to Grand View Research. This represents a significant expansion from the $281.8 billion baseline recorded in 2024. Looking ahead, the market is forecast to reach $1.1 trillion by 2033, growing at a compound annual growth rate (CAGR) of 11.1%.
However, different research firms present varying figures based on methodology. Mordor Intelligence values the B2B SaaS segment at $492.34 billion for 2026, projecting growth to $1.58 trillion by 2031 at a more aggressive 26.24% CAGR. Technavio estimates the broader SaaS market will add $616 billion between 2025 and 2030, representing a 21.7% CAGR. These discrepancies highlight the importance of understanding each researcher’s scope and definitions.
| Year | Market Size | Growth Rate | Source |
|---|---|---|---|
| 2024 | $281.8 billion | Baseline | Research and Markets |
| 2025 | $464.7 billion | +65% | Grand View Research |
| 2026 | $530.0 billion | +14% | Grand View Research |
| 2030 | $774.3 billion | 11.1% CAGR | Research and Markets |
| 2031 | $1,578.2 billion | 26.24% CAGR | Mordor Intelligence |
| 2033 | $1,109.2 billion | 11.1% CAGR | Grand View Research |
The B2B SaaS segment specifically was valued at $390 billion in 2025, with public cloud deployment capturing 61.85% market share. Large enterprises account for 60.60% of B2B SaaS spending, though small and medium enterprises are forecast to grow at a 22.80% CAGR through 2031—faster than their enterprise counterparts.
Regional Breakdown
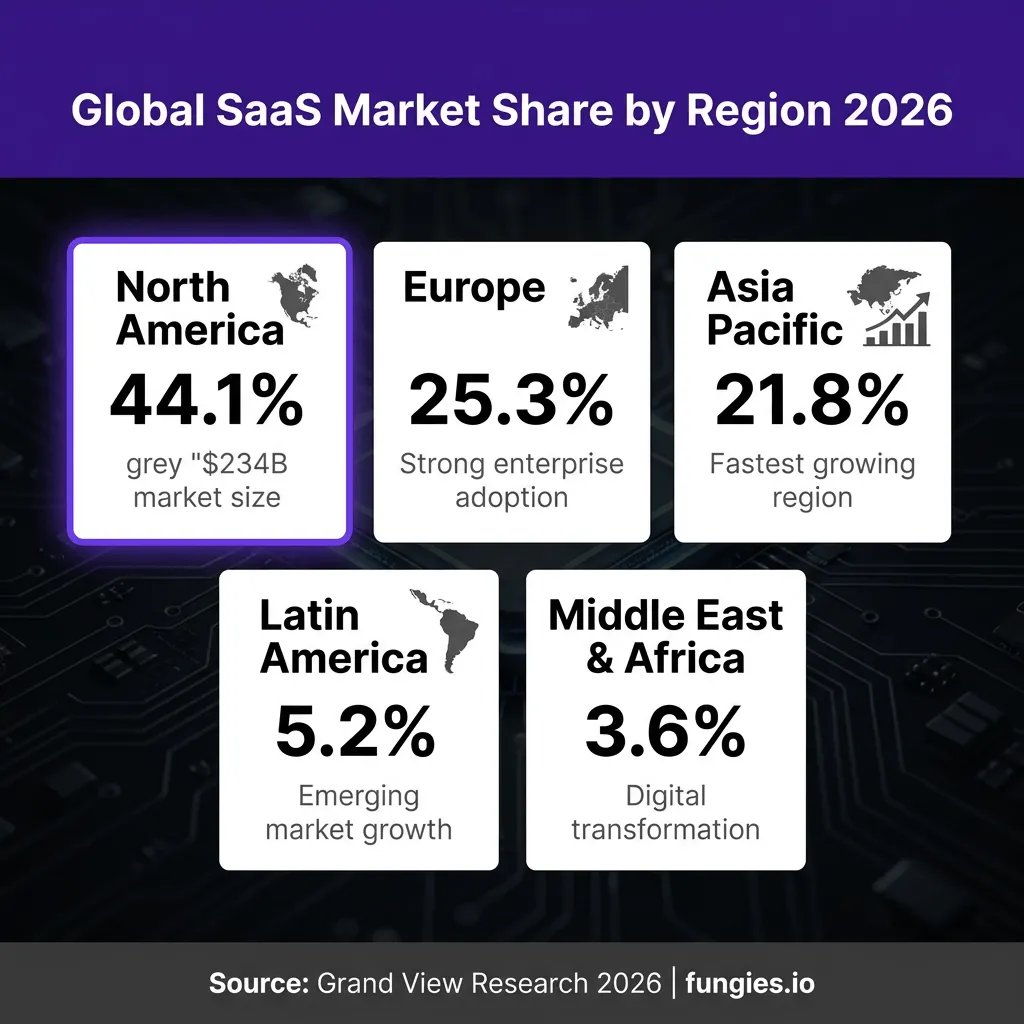
North America continues to dominate the global SaaS market, accounting for 44.1% of total revenue in 2025 according to Grand View Research. The United States alone represents the single most important market for cloud-delivered applications, with approximately 17,000 of the world’s 30,000 SaaS companies headquartered there.
Europe holds the second-largest share at approximately 25.3%, driven by strong enterprise adoption in the UK, Germany, and France. The Asia Pacific region, while currently representing 21.8% of the market, is the fastest-growing region as digital transformation accelerates across China, India, Japan, and Southeast Asian markets.
| Region | Market Share (2025) | Key Characteristics |
|---|---|---|
| North America | 44.1% | Mature market, high enterprise adoption, AI innovation hub |
| Europe | 25.3% | Strong compliance focus, GDPR-driven security requirements |
| Asia Pacific | 21.8% | Fastest growth, mobile-first adoption, emerging markets |
| Latin America | 5.2% | Digital transformation wave, fintech SaaS growth |
| Middle East & Africa | 3.6% | Early stage, infrastructure building, high potential |
According to Precedence Research, the U.S. SaaS market specifically is experiencing robust growth driven by cloud adoption across enterprises seeking to decrease IT costs and enhance scalability. The increasing movement of data to cloud platforms—with 37% of organizations planning to move all non-sensitive data for analytics to cloud or SaaS solutions—continues to fuel regional expansion.
Key Players & Market Share
The SaaS market remains concentrated among a handful of technology giants, though the long tail of specialized providers continues to expand. As of March 2026, Palantir Technologies leads public SaaS companies on U.S. stock exchanges by market capitalization, reflecting the market’s appetite for AI-enabled platforms.
Microsoft maintains its position as the dominant SaaS provider overall, combining productivity (Microsoft 365), collaboration (Teams), and cloud infrastructure (Azure) into a comprehensive ecosystem. In Q4 fiscal 2024, Microsoft reported total revenue of $64.7 billion, up 15% year-over-year, with Intelligent Cloud revenue reaching $29.4 billion.
| Company | Primary SaaS Products | Market Position |
|---|---|---|
| Microsoft | Microsoft 365, Teams, Azure | 17% SaaS market share (Synergy Research) |
| Salesforce | CRM, Service Cloud, Marketing Cloud | 20.7% CRM market share (IDC) |
| Adobe | Creative Cloud, Document Cloud, Experience Cloud | Creative software leader |
| Google Workspace, Google Cloud | Collaboration and cloud infrastructure | |
| Oracle | Oracle Cloud, NetSuite | Enterprise database and ERP |
| SAP | S/4HANA Cloud, SuccessFactors | Enterprise ERP leader |
Salesforce remains the CRM category leader with 20.7% global market share according to IDC, generating $21.6 billion in CRM revenue alone—more than Microsoft, Oracle, Adobe, and SAP combined in this category. The company reported $41.5 billion in total FY2026 revenue.
Notably, nearly half of all SaaS sales in 2025 were made by companies outside the top five leaders, indicating a healthy, diverse market with significant opportunities for specialized and vertical SaaS providers.
Valuation Multiples & Benchmarks
The most significant story in SaaS valuations for 2026 is the dramatic compression of multiples. The SaaS Capital Index—which tracks median ARR multiples for public SaaS companies—fell from 7.0x at the start of 2025 to approximately 3.8x by March 2026. This 46% decline represents one of the steepest corrections in the industry’s history.
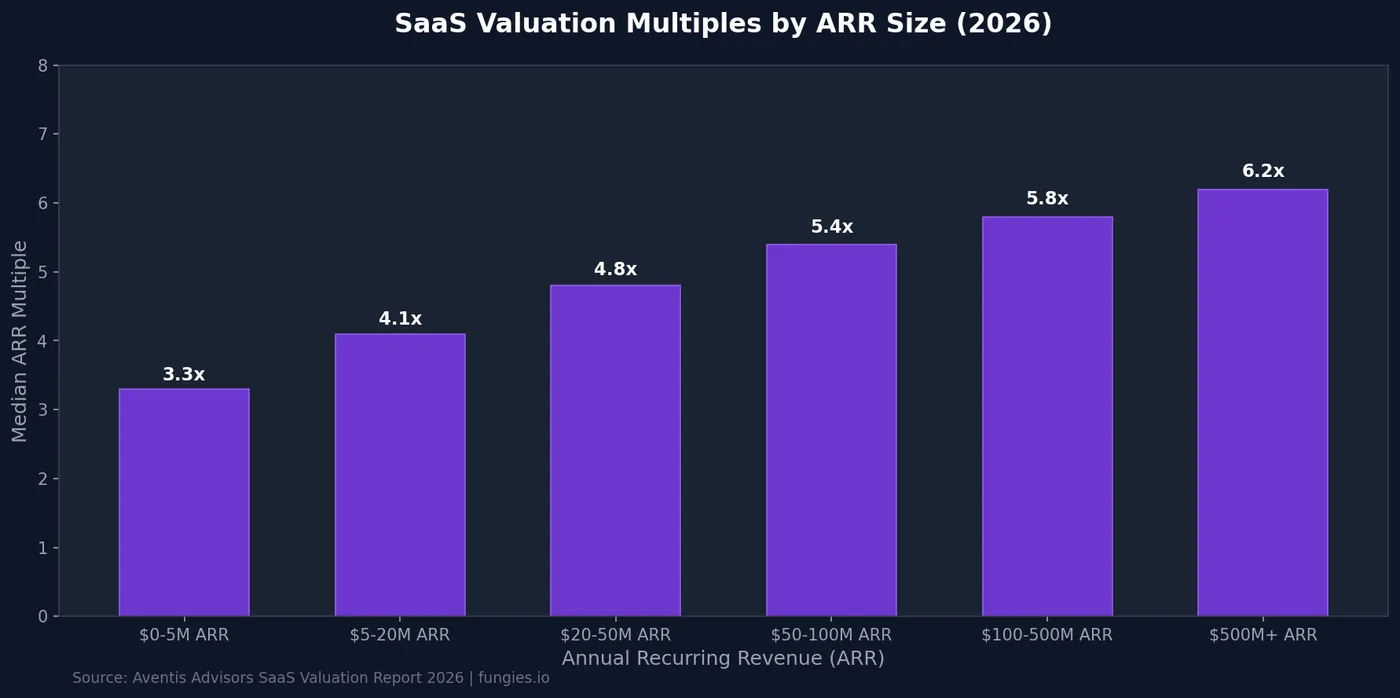
However, this headline figure masks substantial dispersion. According to Aventis Advisors, median SaaS valuation multiples increase systematically with company size, ranging from 3.3x for companies with $0-5M ARR to 6.2x for those exceeding $500M ARR. More importantly, quality metrics now drive valuation more than scale alone.
| ARR Range | Median Multiple | Top Quartile |
|---|---|---|
| $0-5M | 3.3x | 5.0x+ |
| $5-20M | 4.1x | 6.0x+ |
| $20-50M | 4.8x | 7.0x+ |
| $50-100M | 5.4x | 7.5x+ |
| $100-500M | 5.8x | 8.0x+ |
| $500M+ | 6.2x | 9.0x+ |
Private SaaS companies in the lower middle market currently trade at 3x to 7x ARR, with a median around 4.5x according to Livmo. Bootstrapped companies in the $3M-$10M ARR range typically see 3x-5x multiples, while VC-backed companies with faster growth command a modest premium at 5.3x median versus 4.8x for bootstrapped peers (SaaS Capital 2025).
Industry Benchmarks: The Metrics That Matter
In 2026, investors prioritize a focused set of metrics that predict sustainable growth and profitability. Understanding these benchmarks is essential for founders seeking to maximize valuation.
Net Revenue Retention (NRR)
Net revenue retention has emerged as the single most important metric for SaaS valuations. According to Optifai’s 2026 Pipeline Study of 939 B2B SaaS companies, median NRR varies dramatically by segment:
| Segment (by ACV) | Median NRR | Top Quartile |
|---|---|---|
| Enterprise (>$100K) | 118% | 130%+ |
| Mid-Market ($25K-$100K) | 108% | 115%+ |
| SMB (<$25K) | 97% | 105%+ |
The median NRR across all private B2B SaaS has compressed from approximately 105% in 2021 to 101% in 2024-2026, reflecting both market maturity and increased competition. Companies with NRR above 120% command significant valuation premiums—public SaaS companies with NRR exceeding 120% trade at 8x+ revenue multiples versus approximately 1.2x for those below 90%.
Churn Rates
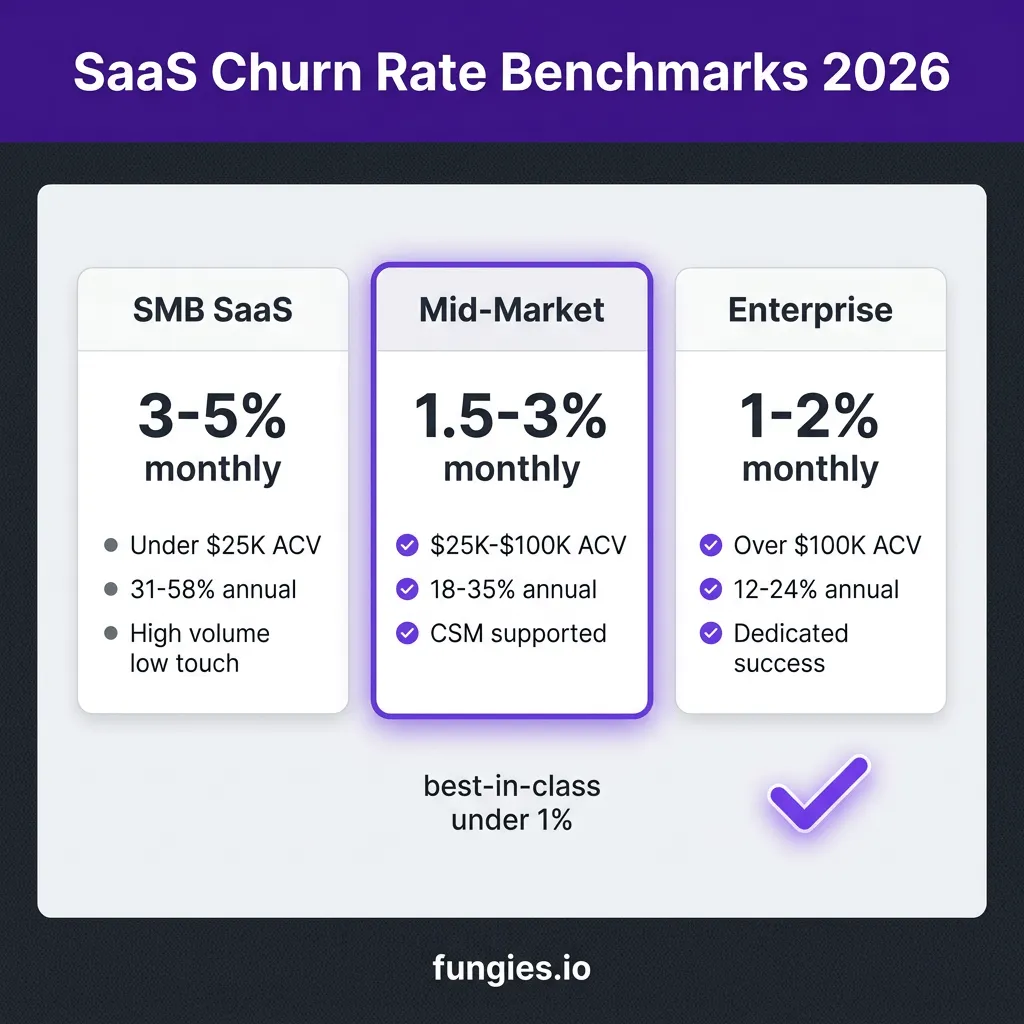
The average B2B SaaS company experiences 3.5% monthly churn, split between 2.6% voluntary and 0.8% involuntary churn according to WeAreFounders. However, this varies significantly by industry and customer segment:
| Industry | Monthly Churn | Annual Churn |
|---|---|---|
| Enterprise Software | 0.25-0.5% | 3-5% |
| B2B SaaS (average) | 3.5% | 35-42% |
| EdTech | 9.6% | 75%+ |
| FinTech | 2.5% | 26% |
| Healthcare | 2.0% | 22% |
A “good” annual churn rate for B2B SaaS is generally considered below 5%, translating to less than 1% monthly. The average annual SaaS churn rate in 2025-2026 is approximately 3.8% for all SaaS and 4.9% specifically for B2B SaaS.
LTV:CAC Ratio
The lifetime value to customer acquisition cost ratio measures the relationship between customer lifetime value and acquisition cost. According to SaaS Hero, the benchmarks are:
| Metric | Minimum | Target | Best-in-Class |
|---|---|---|---|
| LTV:CAC Ratio | 3:1 | 4:1 | 5:1+ |
| CAC Payback Period | <18 months | <12 months | <6 months |
| Median CAC (B2B SaaS) | – | $500-$1,000 | – |
B2B SaaS LTV ranges from $15K-$40K for SMB customers to $300K-$1M+ for Enterprise. The median LTV:CAC ratio across all segments is 3.2:1, with B2B SaaS showing a median CAC payback of 8.6 months.
Rule of 40
The Rule of 40—combining revenue growth rate and profit margin—has become the gold standard for measuring SaaS company health. A score of 40% or higher indicates effective balance between growth and profitability.
According to Ad Astra Equity, companies scoring above 50 on the Rule of 40 while maintaining NRR above 120% are closing at 7x-9x ARR in private transactions. Each 10-point improvement in Rule of 40 score correlates with approximately 1.0-2.2x improvement in EV/Revenue multiple.
Gross Margin
Gross margin remains a foundational metric for SaaS unit economics. According to Aleph’s 2026 benchmarks across 342 SaaS and AI-native companies:
| Metric | Median | Best-in-Class |
|---|---|---|
| Software Gross Margin | 80% | 86%+ |
| Blended Total Revenue Margin | 76% | 80%+ |
| Usage-Only Models | 62% | 70% |
Companies with gross margins above 70-75% command valuation premiums, as this metric determines how much of each revenue dollar is available to fund R&D, sales, and profit.

Trends & Predictions
Several macro trends are reshaping SaaS valuations and will continue to drive the market through 2030:
1. AI-Native Architecture Becomes Default
AI adoption in enterprises has jumped over 280% according to a Salesforce CIO survey, with “agentic” AI (multi-agent systems that act, not just chat) identified as a core 2026 priority. The 2025 SaaS Management Index found a 75% year-over-year increase in spending on AI-native applications—apps with AI core to the product. Companies with credible AI defensibility consistently land in the top quartile of valuations.
2. Vertical SaaS Expansion
Vertical SaaS—software built for specific industries rather than horizontal use cases—is projected to reach $157.4 billion by 2026, growing at a 23.9% CAGR—roughly double the pace of many horizontal segments. Vertical SaaS companies command valuation premiums of 1.5-2.0x compared to horizontal peers (8.1x vs 5.2x revenue multiples).
3. API-First Development
The shift toward API-first and modular SaaS architectures continues to accelerate. Unified API platforms are becoming critical infrastructure, enabling SaaS companies to integrate with hundreds of third-party applications without building each integration from scratch. This trend supports both faster time-to-market and higher retention through ecosystem lock-in.
4. Usage-Based Pricing Models
Traditional per-seat pricing faces pressure as AI agents increasingly act as users. Usage-based pricing is projected to represent 20% of SaaS revenue by 2027, up from single digits in 2024. While these models typically show lower gross margins (62% median vs 80% for subscription), they can drive higher net revenue retention through natural expansion.
5. Profitability Over Growth-at-All-Costs
The market has decisively shifted from prioritizing growth at all costs to demanding profitable scale. The Rule of 40 has become a standard expectation rather than a stretch goal. Companies that can demonstrate both growth and profitability—particularly those with EBITDA margins above 20%—command the highest valuations in the current environment.
Methodology
This report synthesizes data from over 15 authoritative sources published between January 2025 and July 2026. Key sources include the SaaS Capital Index (tracking public SaaS multiples since 2012), Grand View Research’s SaaS market analysis, Mordor Intelligence’s B2B SaaS report, Aventis Advisors’ valuation multiples research, Optifai’s Pipeline Study of 939 B2B SaaS companies, and Aleph’s benchmark study of 342 SaaS and AI-native companies.
Market size figures vary across research firms due to differences in scope (total SaaS vs B2B SaaS only), geographic coverage, and methodology. We have presented multiple estimates where significant discrepancies exist. Valuation multiples are based on actual transaction data where available (Aventis Advisors, SaaS Capital) and public market indices otherwise.
All figures are current as of July 2026. Given the volatility in SaaS valuations during the first quarter of 2026, readers should note that multiples continue to evolve as markets digest AI’s impact on the sector.
Frequently Asked Questions
What is a good ARR multiple for SaaS companies in 2026?
A “good” ARR multiple depends on company size and quality metrics. In 2026, median multiples range from 3.3x for sub-$5M ARR companies to 6.2x for $500M+ ARR companies. However, companies with net revenue retention above 120% and Rule of 40 scores exceeding 50 can command 7x-9x multiples regardless of size.
How has the SaaS valuation landscape changed in 2026?
The SaaS Capital Index fell from 7.0x at the start of 2025 to approximately 3.8x by March 2026—a 46% decline. This “SaaSpocalypse” erased roughly $1 trillion in aggregate market cap. However, top-quartile companies with strong retention and profitability metrics have maintained premium valuations, creating a “rich get richer” environment.
What is the Rule of 40 and why does it matter?
The Rule of 40 states that a healthy SaaS company’s combined revenue growth rate and profit margin should equal or exceed 40%. It matters because it balances growth and profitability—two dimensions that investors increasingly weigh equally. Companies exceeding the Rule of 40 command significant valuation premiums.
What net revenue retention should SaaS companies target?
Targets vary by segment. Enterprise SaaS (ACV >$100K) should aim for 115%+ NRR, with 130%+ considered best-in-class. Mid-market ($25K-$100K ACV) targets 105%+, while SMB SaaS (<$25K ACV) typically sees 95-100% median NRR. Any NRR above 100% means the company can grow without acquiring new customers.
How big is the SaaS market in 2026?
The global SaaS market is estimated at $530 billion in 2026, up from $464.7 billion in 2025. Projections for 2030-2033 range from $774 billion to $1.58 trillion depending on the research firm and methodology. North America accounts for 44.1% of the market, followed by Europe at 25.3%.
Sources & Citations
L40° – SaaS Multiples: Methods and Company Valuation in 2026
TechnologyChecker – Salesforce Statistics and Market Share 2026
Last updated: July 7, 2026. This report is published by Fungies.io as a resource for SaaS founders, investors, and operators seeking authoritative industry data.