Stay ahead with the latest trends and stats in mobile apps and digital advertising. Discover what’s driving the digital market this quarter!

Want to know what’s hot in the world of mobile apps and digital advertising this quarter? Are you looking for the latest trends and stats to stay ahead of the game? Go no further.
In the competitive digital world, staying informed is key to staying competitive. That’s why we’re bringing you the latest insights from the Digital Market Index.
In this article, we’ll uncover the trends and stats you need to know to succeed with your digital app startup. Let’s get started.
Data Collection Methodology
The data comes from a renowned Insights platform. This platform tracks app downloads and consumer spending across different app stores. Here are some key points about the data collection process:
- Timeframe: The data covers the second quarter of 2024, from April 1 to June 30.
Definitions:
- Per-user download basis: This measures how many times an app is downloaded by individual users.
- Exclusions: Some data points may exclude certain types of apps or downloads to avoid skewing the results.
- Android vs. third-party stores: The data distinguishes between downloads from Google Play Store and other third-party app stores.
Why This Data Matters?
Collecting accurate app data helps businesses understand user behavior. It also highlights market trends, showing which apps are popular and where consumers are spending their money. This information is essential for developers and marketers to make informed decisions.
Consumer Spend Trends
Record-Breaking Consumer Spend
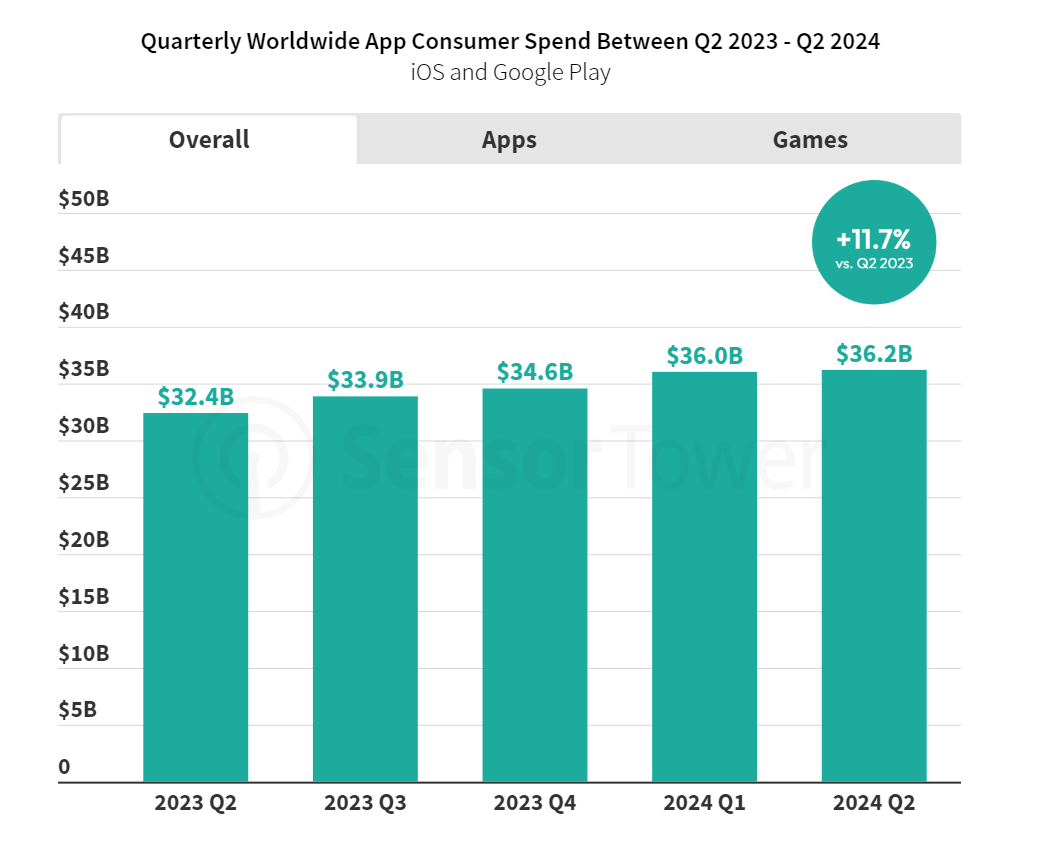
In Q2 2024, mobile app consumer spending surged to $36.2 billion. This marks an 11.7% increase from the same period in 2023. Compared to Q1 2024, the growth is equally impressive. This upward trend shows that users are more engaged with mobile apps than ever. They are not just using apps more; they are willing to spend more. The record-breaking spending underscores the growing importance of mobile apps in daily life. As the market expands, the value and influence of mobile apps continue to rise. This trend suggests a strong future for mobile app developers and investors.
Mobile App Spend Analysis
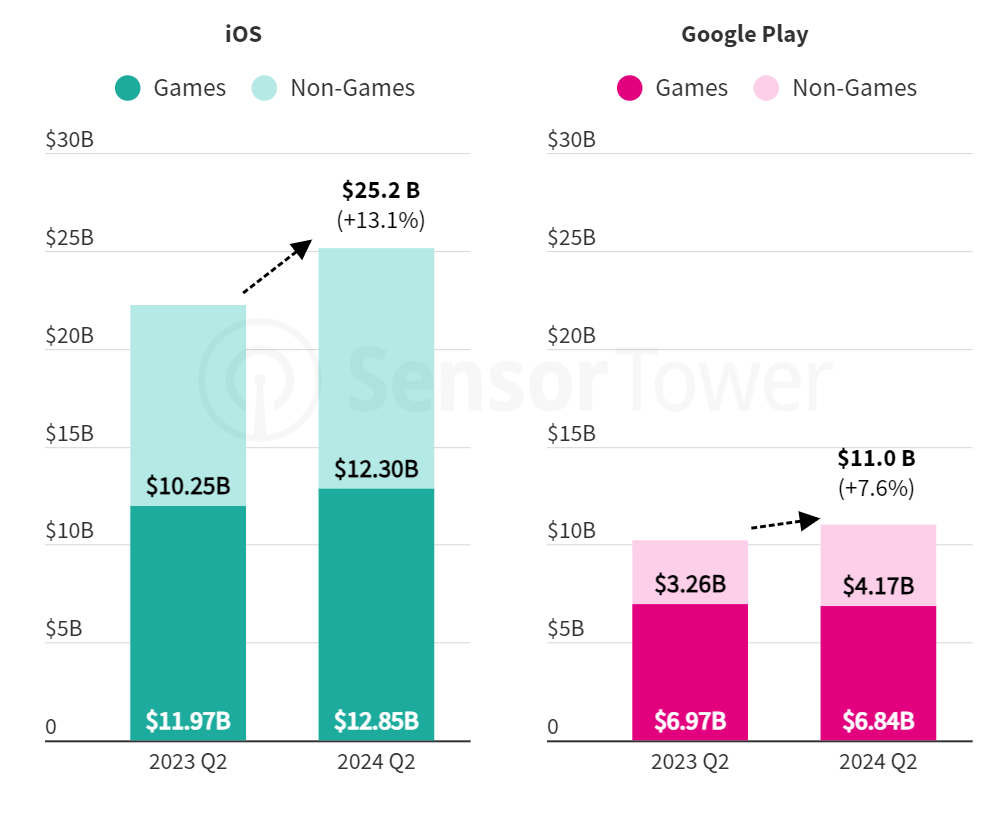
In Q2 2024, non-gaming apps made up 46% of total mobile spend. This surge reflects the growing popularity of utility, productivity, and entertainment apps. Users are clearly valuing these tools in their daily routines.
Mobile games, on the other hand, continued their growth streak. This marks the fourth consecutive quarter of increased spending in this category. The steady rise highlights the ongoing demand for gaming content. It also shows users’ willingness to invest in immersive experiences.
Both categories are thriving. This growth underscores the diverse interests of mobile users. Non-gaming apps are becoming essential tools. Meanwhile, mobile games are keeping users entertained. The rise in consumer spending emphasizes the importance of digital experiences in daily life. Users are not just consuming content—they’re investing in it.
Platform-Specific Spend
iOS vs. Google Play Spend
In Q2 2024, iOS users spent $25 billion, marking a 13% increase from the previous year. Google Play also experienced growth, but at a different rate. Non-gaming apps played a significant role in Google Play’s revenue increase. This shift highlights the platform’s growing app diversity.
Additionally, subscription-based services and productivity apps were major contributors. Both platforms are seeing a rise in spending on non-gaming apps, reflecting users’ expanding interests. This trend underscores the increasing importance of app categories beyond gaming. As a result, developers are focusing more on non-gaming apps to tap into this growing market.
Regional Spend Insights
In Q2 2024, the U.S. continued to dominate the global mobile app market. Spending on mobile apps reached nearly $13 billion. This underscores the strong demand and high engagement among U.S. users.
In Asia, the market showed varied trends. Japan and South Korea experienced declines in mobile app spending. Japan saw a dip due to increased competition and market saturation. South Korea faced similar challenges, leading to a drop in user spending.
However, China Mainland showed a different trend. Mobile app spending in China grew during the same period. This growth suggests a rising interest in mobile services and apps. It also highlights China’s potential as a key player in the global mobile app market.
These trends indicate shifting dynamics in Asia. Markets like Japan and South Korea may need new strategies to revive growth. Meanwhile, China’s growth could shape the future of the Asian mobile app market.
Download Trends
Overall Download Patterns
In Q2 2024, global app downloads saw a slight increase of 1% YoY. This indicates a steady interest in mobile apps. However, mobile game downloads experienced a 6% decline YoY. This drop highlights a change in user preferences. Users seem to be shifting their focus from gaming apps to other types of apps. This trend could signal changing consumer behaviors in the mobile market. As mobile app categories grow, it’s essential to monitor these shifts closely.
Platform-Specific Download Trends
iOS saw a 3.1% YoY growth in downloads. This growth varied between core markets and the rest of the world. On the other hand, Google Play experienced a 3.6% YoY decline in downloads. This indicates differing trends across platforms.
Top Markets and Growth Opportunities
Key Markets
The U.S. leads the global mobile app market, accounting for 36% of total spend. This dominance underscores its critical role in the industry. In contrast, some Asian markets are facing challenges. Japan and South Korea, for example, have seen spending declines. On the other hand, Mainland China is showing positive growth.
This reflects the diverse trends within the region. The shifts highlight the dynamic nature of the global mobile app market. Different regions are experiencing varied outcomes. The U.S. remains a key player, while Asia shows both growth and decline.
Emerging Markets
Download growth in smaller markets is surging. Countries like India, Brazil, and regions in Africa are leading the charge. In particular, Nigeria’s finance apps are showing remarkable potential. This surge highlights a growing interest in digital financial services. More users in these regions are turning to mobile apps for banking, payments, and investments.
The convenience and accessibility of these apps are driving adoption. This trend presents a huge opportunity for fintech companies. Expanding in these markets could lead to significant gains. It’s clear that the demand for digital financial solutions is on the rise.
Category-Specific Insights
Top App Categories
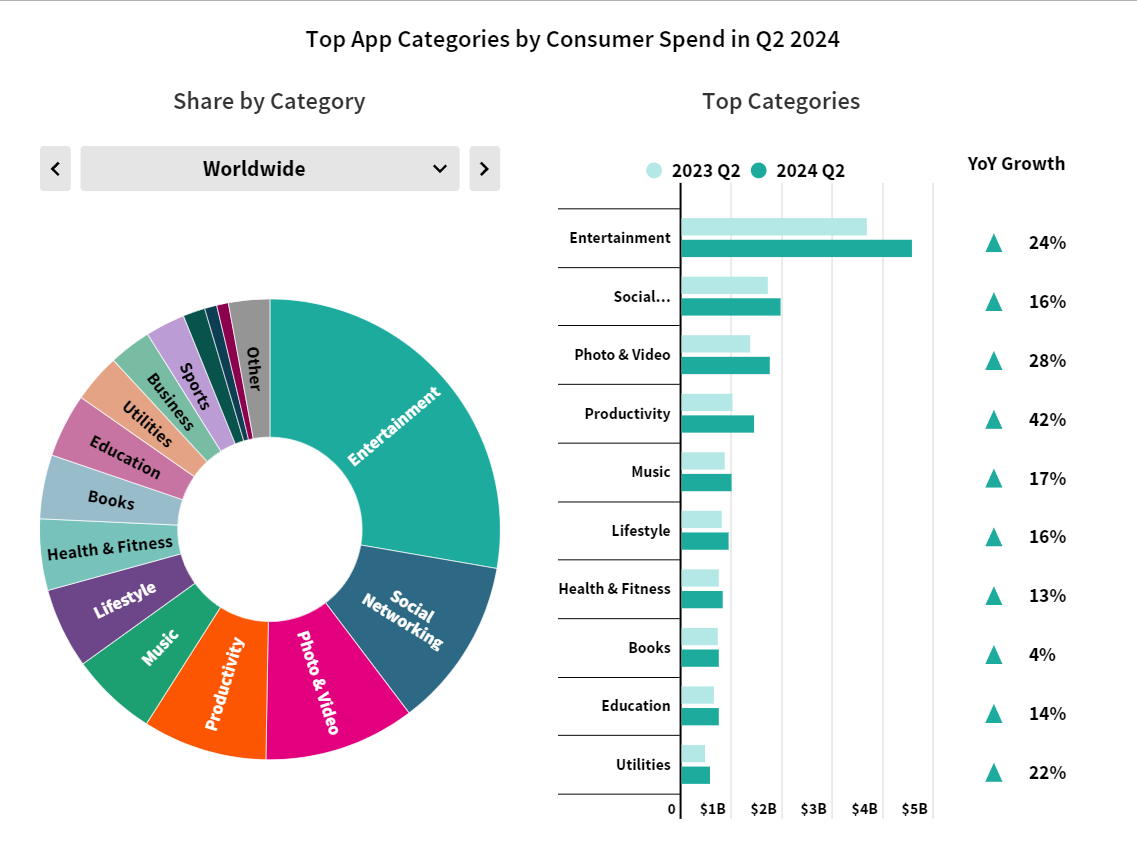
In Q2 2024, consumer spend grew in several app categories. Productivity, Photo & Video, Entertainment, and Utilities saw notable increases. For example, Google One had significant growth in the Productivity category. ChatGPT was popular in the Utilities category. DramaBox saw a rise in the Entertainment category.
Mobile Games
Strategy games have indeed taken the lead in the mobile gaming market. Downloads and in-game spending have significantly increased. This surge highlights the growing appeal of strategic gameplay on mobile platforms.
Meanwhile, Role-Playing Games (RPGs) continue to perform well. Although they didn’t outpace strategy games, RPGs still show strong engagement and player retention. The competitive landscape in RPGs is fierce, with new titles regularly entering the market. Established games are also evolving to keep players engaged. This makes the RPG genre an exciting space to watch.
Digital Advertising Overview
US Digital Ad Spend
Spending Trends
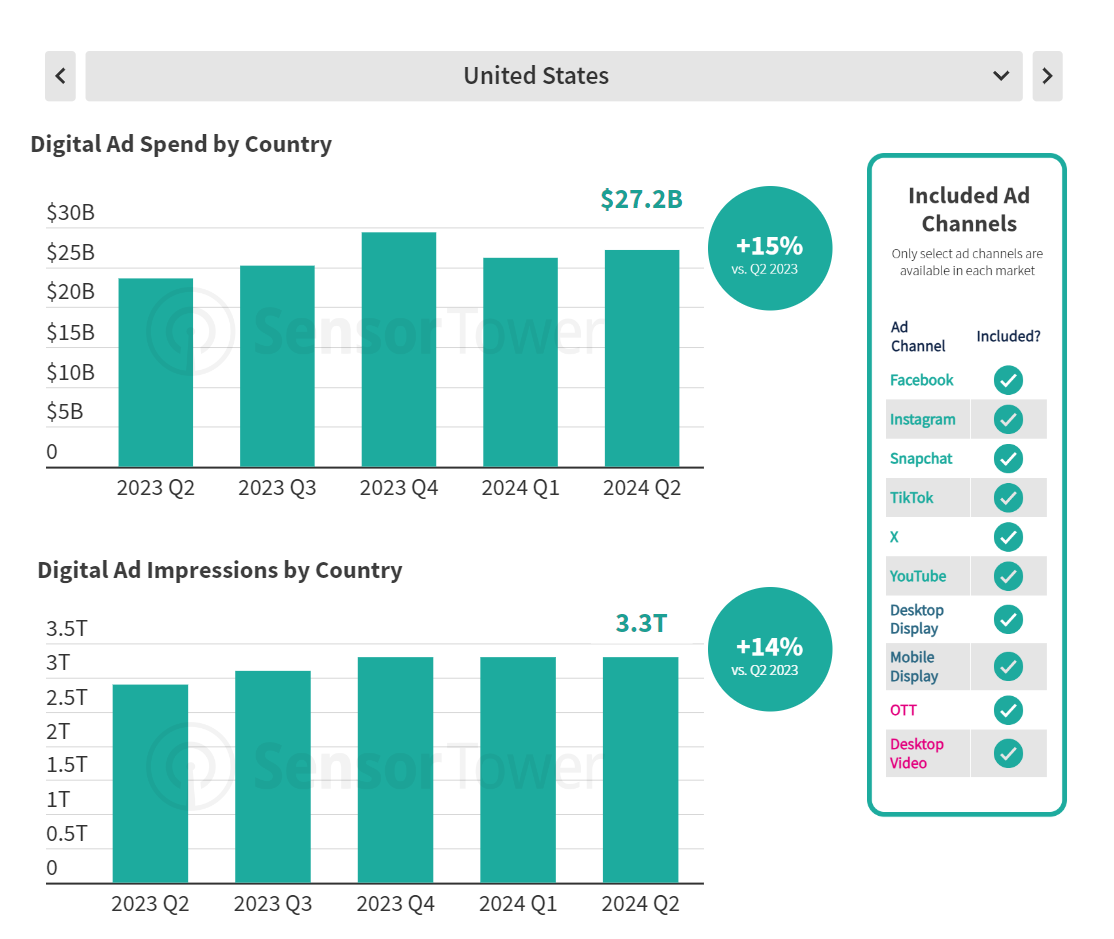
Total digital ad spending in the US reached $27 billion in Q2 2024. This represents a 15% year-over-year (YoY) growth. There were 3.3 trillion ad impressions during this period. These figures highlight the expanding digital ad market.
Ad Channel Analysis
Social media ads made up 76% of the total ad spend. The top channels were Facebook, Instagram, and TikTok. Social and video ads showed significant year-over-year growth rates. This trend indicates the increasing importance of these platforms for advertisers.
Category-Specific Ad Spend
Top Categories
In Q2 2024, spending on shopping ads reached $5 billion. This represents a slight decrease from the previous year. Despite this drop, certain categories are experiencing rapid growth. Financial services and software are among the top performers. Companies are investing heavily in these areas due to increased demand.
Financial services grew as consumers turned to online banking and investment options. The software category also surged, driven by growing interest in SaaS products and digital tools. Both sectors are expected to continue expanding as businesses focus on these lucrative markets.
Top Advertisers
The top 10 advertisers have seen some changes. Procter & Gamble, Amazon.com, and Expedia remain in the top positions. However, new companies are now among the top advertisers. Kenvue and Tencent’s Supercell have entered the list. This shows a shift in advertising focus and new players making their mark.
Retail Media Advertising Overview
Top Retail Media Leaders
Retail media advertising is rapidly expanding. Major players in this space include Walmart, Target, and Home Depot. These retailers use both onsite and offsite ad impressions to reach customers.
Onsite ads are displayed on the retailer’s own website or app. They target shoppers actively browsing products. This increases the chances of conversion since customers are already in a buying mindset.
Offsite ads appear on third-party sites and apps. These ads help retailers reach a broader audience. They often use data from the retailer to personalise the ads. This strategy drives traffic back to the retailer’s site, increasing sales opportunities.
Retail media advertising benefits both retailers and brands. Retailers monetize their platforms by selling ad space. Brands gain a direct way to reach customers at the point of purchase.
The growth of e-commerce has fueled this trend. Retailers are becoming powerful media networks. They offer brands a unique way to connect with consumers. As a result, retail media is becoming a key part of advertising strategies.
Category Trends
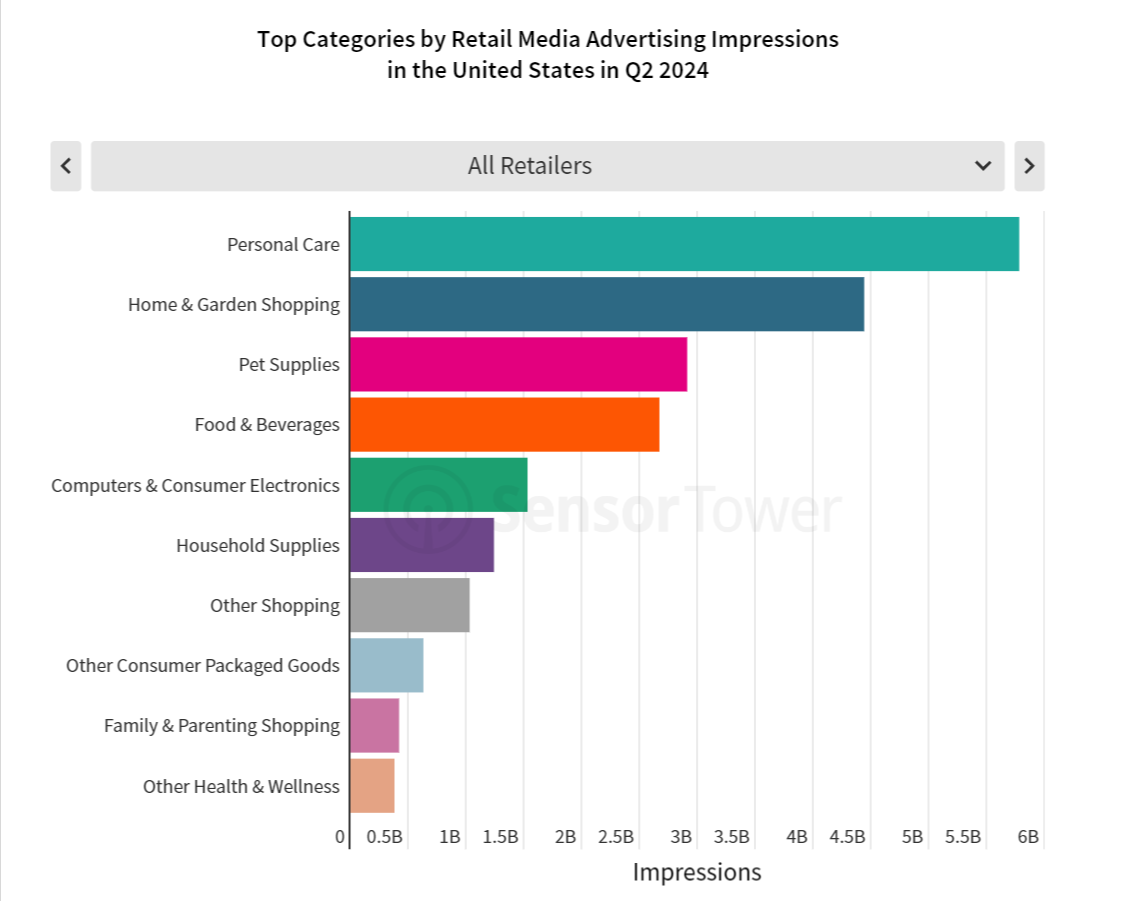
In retail media, Personal Care dominates with the highest number of ad impressions. It is the leading category in terms of ad visibility. Personal Care products, like skincare and haircare items, get the most ad exposure.
Home & Garden is gaining momentum. This category is seeing increased attention and higher ad spend. Brands are investing more in ads for home improvement, gardening tools, and decor. The rising interest is driving more ad placements and engagement in this sector.
Retailer-Specific Insights
Walmart and Target are major names in retail media. Walmart covers a wide range of categories. It offers products from groceries to electronics. Its retail media network is vast and diverse.
Target focuses on specific areas. It excels in home goods and fashion. Target’s retail media efforts are strong in these niches. Both Walmart and Target are prominent in Computers & Consumer Electronics and Home & Garden. Walmart’s extensive reach contrasts with Target’s specialized approach. Each retailer leverages its strengths to capture different market segments.
Co-Branded Advertising
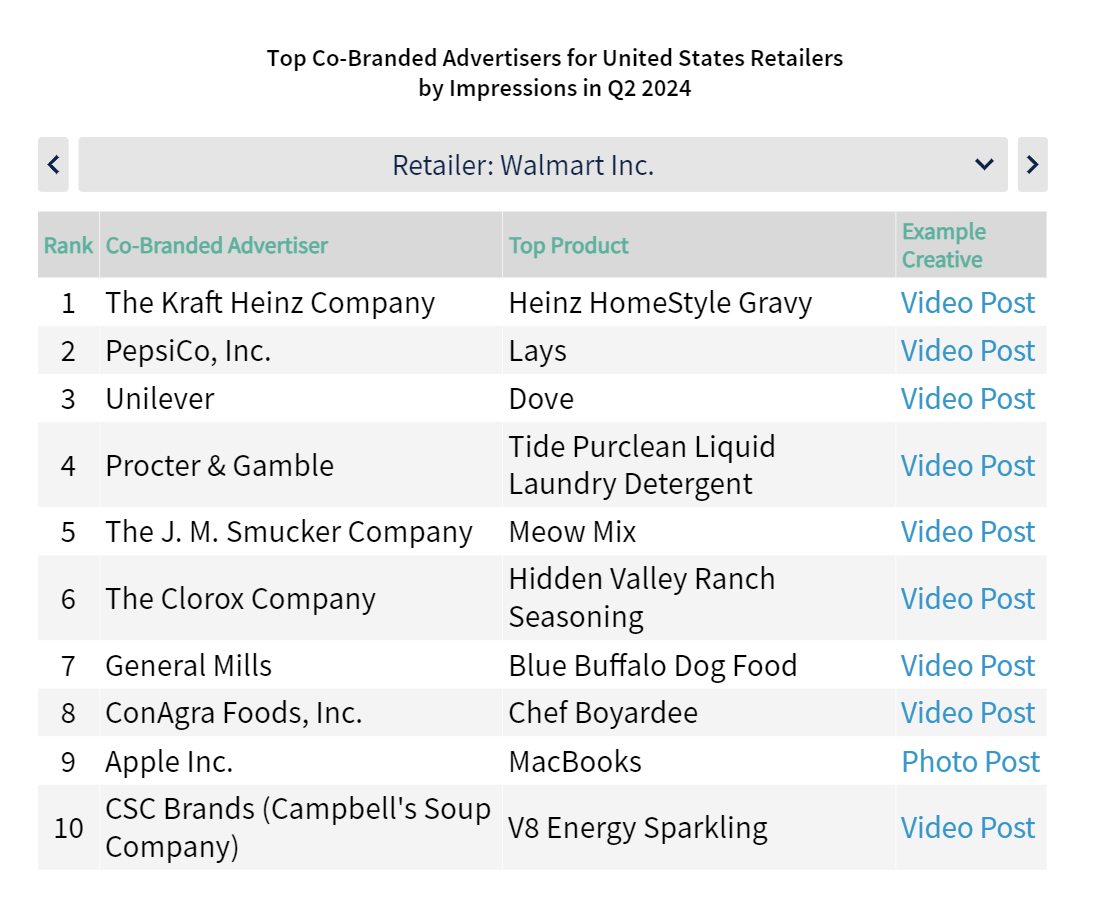
Co-branded advertising is gaining popularity. Companies are teaming up to boost their reach. Notable examples include Chewy and Purina PetCare. They are collaborating to attract pet owners. Apple is also expanding its retail media strategies. The tech giant is partnering with various brands to enhance its ad offerings.
New partnerships are also forming. Kraft Heinz Company and PepsiCo are joining forces. Their collaboration aims to combine their market strengths. These partnerships help brands tap into new audiences. They provide a platform to promote products to more consumers. Overall, co-branded advertising is becoming a powerful tool for increasing brand visibility.
Conclusion
In summary, mobile app trends show a rise in spending and downloads. Users are spending more on apps and in-app purchases. Digital ad spending is shifting towards mobile platforms, with Google and Facebook leading the way. Retail media advertising is growing, with companies using targeted ads in apps to reach consumers. These trends reveal important opportunities for businesses. By focusing on mobile spending, ad patterns, and retail media. Companies can improve their digital advertising strategies.