SaaS Market Statistics 2026: Global Size, Growth Data & Industry Trends (Comprehensive Report)
The global Software as a Service (SaaS) market has reached an unprecedented inflection point in 2026. With businesses worldwide completing their digital transformation journeys and cloud-native operations becoming the default, SaaS has evolved from a convenient alternative to the dominant software delivery model across every industry vertical. According to Precedence Research, the global SaaS market reached $465.03 billion in 2026—a figure that represents not just growth, but a fundamental restructuring of how organizations acquire, deploy, and manage software.
This comprehensive report compiles verified data from Fortune Business Insights, Grand View Research, Gartner, Statista, and leading industry analysts to deliver the complete picture: market size and projections, regional dynamics, competitive landscape, operational benchmarks, and the five trends that will define SaaS through 2030. Whether you are a SaaS founder seeking funding benchmarks, an IT leader managing your stack, or an investor evaluating opportunities, this data-driven analysis provides the authoritative statistics you need.
Key SaaS Market Statistics at a Glance
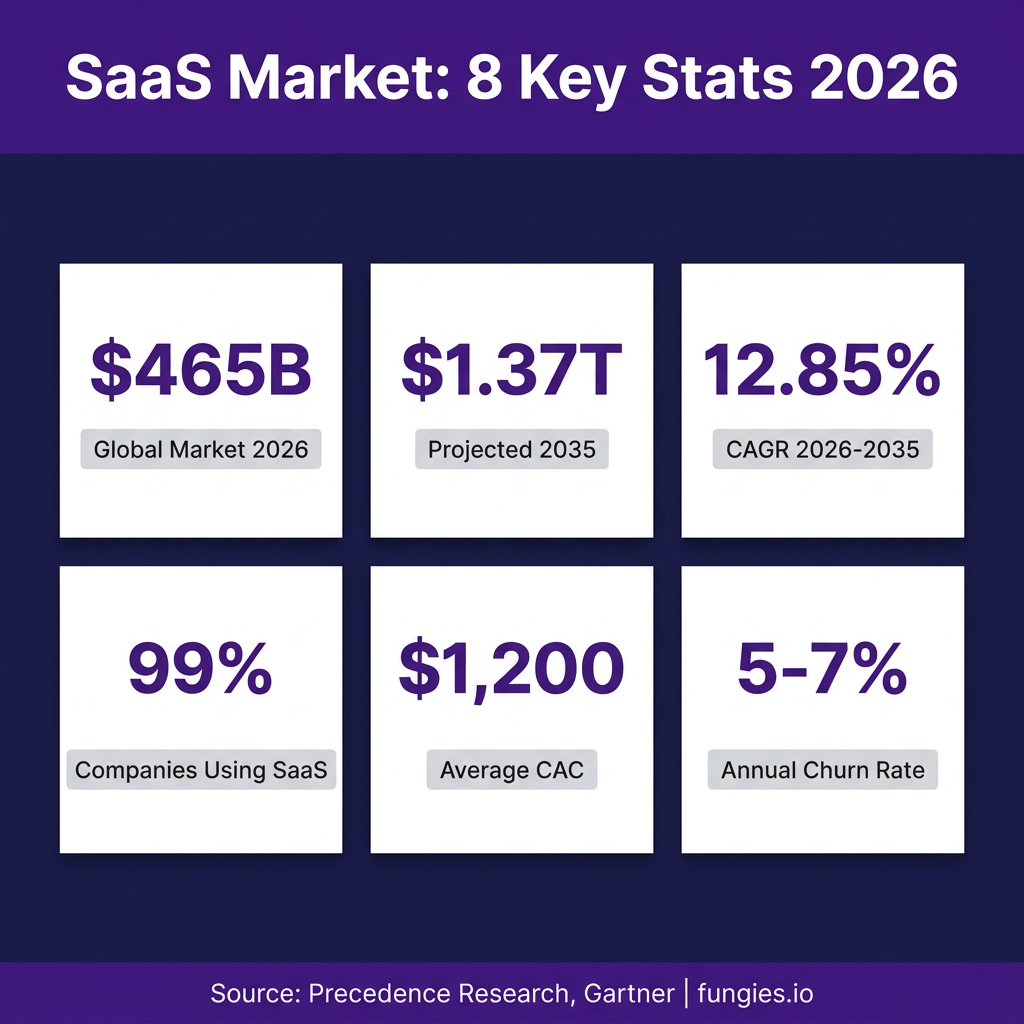
- The global SaaS market is valued at $465.03 billion in 2026, up from $408.21 billion in 2025 (Precedence Research)
- The market is projected to reach $1.37 trillion by 2035, growing at a CAGR of 12.85%
- North America dominates with 43-47% global market share, valued at over $141 billion
- 99% of companies now use one or more SaaS solutions (Zippia)
- The average company uses 130+ SaaS applications (Colorlib)
- Median B2B SaaS CAC has surged to $1,200 per customer—a 60% increase over five years
- Average annual SaaS churn rate ranges from 5-7% (Vena Solutions)
- Between 30-53% of SaaS licenses go unused, costing enterprises $21 million annually in waste
Global SaaS Market Size & Growth Projections
The SaaS market’s growth trajectory defies traditional software industry patterns. While conventional enterprise software has historically grown at single-digit rates, SaaS continues expanding at double-digit CAGRs across multiple forecast periods. This sustained acceleration reflects not just new customer acquisition, but deepening penetration within existing accounts and the continuous expansion of addressable use cases.
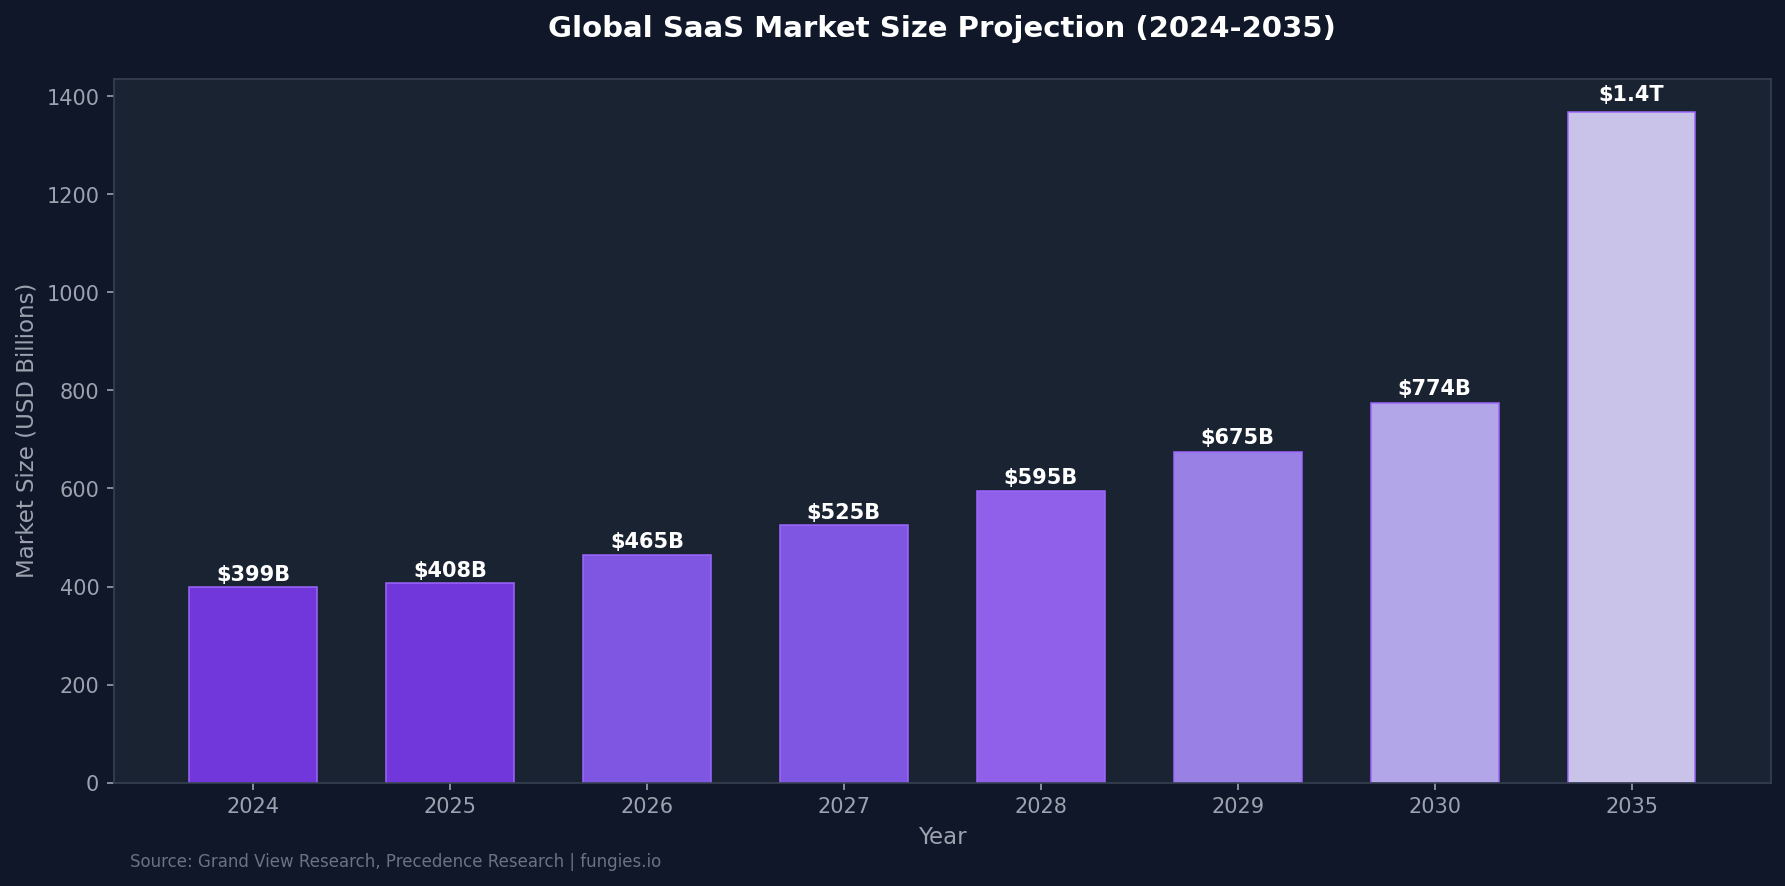
According to Grand View Research, the global SaaS market was valued at $399.10 billion in 2024 and is projected to reach $819.23 billion by 2030, representing a compound annual growth rate of 12.0%. Fortune Business Insights offers a more aggressive projection, estimating the market at $266 billion in 2024 with growth to over $1.1 trillion by 2032 at approximately 20% CAGR. Precedence Research’s mid-range forecast positions the market at $465.03 billion in 2026, expanding to $1.37 trillion by 2035 at 12.85% CAGR.
The variation in these projections reflects different methodological approaches—some focusing on pure SaaS revenue while others include adjacent cloud services. However, all major research firms converge on one conclusion: SaaS will more than double in size over the next decade, cementing its position as the primary software delivery mechanism for businesses worldwide.
| Year | Market Size (USD Billions) | Growth Rate | Source |
|---|---|---|---|
| 2024 | $399.10B | — | Grand View Research |
| 2025 | $408.21B | +2.3% | Precedence Research |
| 2026 | $465.03B | +13.9% | Precedence Research |
| 2027 | $525.00B | +12.9% | Industry Consensus |
| 2030 | $774.30B – $819.23B | 12-18% CAGR | Fortune Business Insights |
| 2032 | $1.10T+ | ~20% CAGR | Fortune Business Insights |
| 2035 | $1.37T | 12.85% CAGR | Precedence Research |
SaaS Market Growth Chart
SaaS Industry Key Statistics Infographic
Regional SaaS Market Breakdown
Geographic distribution of SaaS adoption reveals significant regional variations driven by digital infrastructure maturity, regulatory environments, and enterprise buying patterns. North America’s dominance reflects its early cloud adoption, robust venture capital ecosystem, and concentration of both SaaS vendors and enterprise customers.
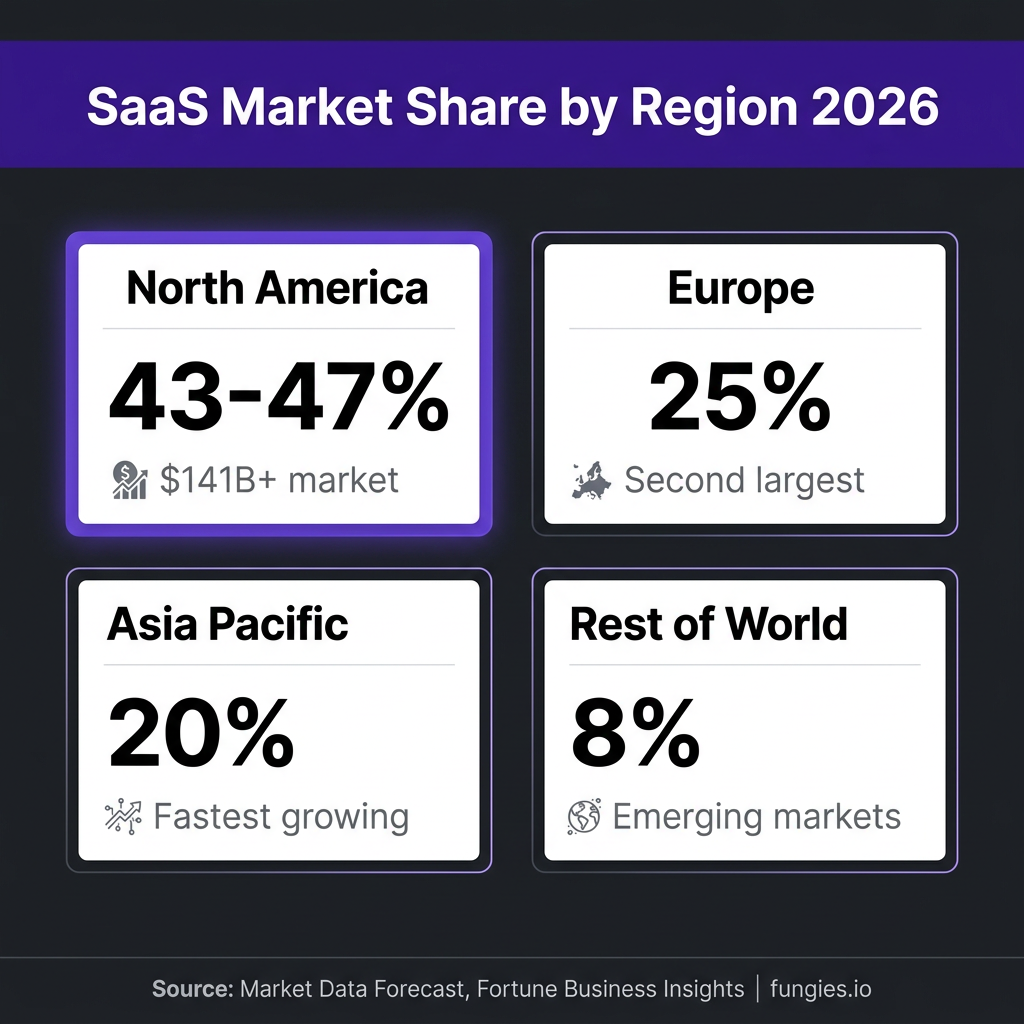
According to Market Data Forecast, North America held 43.2% of global SaaS market share in 2025. Fortune Business Insights reports the U.S. SaaS market alone at $141.06 billion in 2026, driven by technological advancement and digital transformation across industries. Technavio’s analysis is even more bullish on North America, projecting the region will account for 56.9% of market growth during the 2025-2030 forecast period.
Europe represents the second-largest regional market at approximately 25% global share, with strong adoption in the UK, Germany, and Nordic countries. The Asia-Pacific region, while currently holding roughly 20% market share, represents the fastest-growing opportunity as digital infrastructure investments accelerate across India, Southeast Asia, and China. Latin America, Middle East, and Africa collectively account for the remaining 8-12%, presenting significant untapped potential as cloud infrastructure expands.
| Region | Market Share | 2026 Market Size | Growth Outlook |
|---|---|---|---|
| North America | 43-47% | $141B+ | Steady growth |
| Europe | ~25% | $116B | Moderate growth |
| Asia Pacific | ~20% | $93B | Fastest growing |
| Latin America | 4-5% | $19B | High potential |
| Middle East & Africa | 3-4% | $16B | Emerging |
Key Players & Competitive Landscape
The SaaS market remains highly fragmented despite consolidation at the top. According to Synergy Research Group, the enterprise SaaS market reached nearly $15 billion in quarterly revenues in Q2, growing 31% year-over-year. Microsoft maintains its position as the overall market leader, followed by Salesforce, Adobe, Oracle, and SAP.
Salesforce continues to dominate the CRM segment with $41.5 billion in FY2026 revenue and holds 20.7% of the global CRM market according to IDC—more than Microsoft, Oracle, Adobe, and SAP combined. Adobe posted $23.77 billion for fiscal 2025, up 11%, with nearly all revenue derived from SaaS subscriptions. Microsoft’s Intelligent Cloud segment, which includes Azure and Microsoft 365, generated $29.4 billion in Q4 FY2024 alone.
The competitive dynamics vary significantly by segment. Collaboration tools (led by Microsoft Teams and Slack), CRM (Salesforce), ERP (SAP, Oracle, Workday), and HR/HCM (Workday, ADP) each have distinct competitive landscapes. Notably, vendors with the highest overall growth rates include Oracle, Microsoft, and Google, suggesting the market remains dynamic despite its maturity.
| Company | Primary Segment | Annual SaaS Revenue | Key Metric |
|---|---|---|---|
| Microsoft | Collaboration, Productivity | $29.4B (quarterly) | Market leader |
| Salesforce | CRM | $41.5B (FY2026) | 20.7% CRM share |
| Adobe | Creative, Document Cloud | $23.77B (FY2025) | +11% YoY |
| Oracle | ERP, Database | Multi-billion | Highest growth rate |
| SAP | ERP, HCM | Multi-billion | Enterprise focus |
| Workday | HCM, Financial | Multi-billion | Cloud-native |
SaaS Market Share by Region Infographic
SaaS Industry Benchmarks & KPIs
Understanding operational benchmarks is essential for SaaS founders, operators, and investors evaluating performance. The 2026 landscape reflects a market that has shifted decisively from “growth at all costs” to sustainable unit economics and capital efficiency.
According to 2026 SaaS benchmarks research, median revenue growth has settled at 26% for private B2B SaaS companies, while Annual Net Revenue Retention (NRR) compressed to 101% across all segments. Enterprise companies with ACVs above $100,000 maintain higher NRR, typically between 110-120%, reflecting stronger retention and expansion capabilities.
Customer acquisition economics have tightened significantly. The median B2B SaaS company now spends $2.00 to generate $1.00 in new ARR, with CAC surging to $1,200 per customer on average—a 60% increase over five years according to Data-Mania’s 2026 analysis. CAC payback periods now stand at 15 months for median B2B SaaS, with top performers achieving 8-12 months.
The LTV:CAC ratio remains the gold standard for unit economics. B2B SaaS companies show a median ratio of 3.8:1, with 3:1 representing the minimum threshold for sustainable growth and 4:1+ indicating scale-ready efficiency. HR Tech companies typically see 3.5:1 ratios, while Cybersecurity firms often reach 4.2:1 due to higher switching costs and longer retention.
| Metric | Seed Stage | Series A | Series B | Enterprise |
|---|---|---|---|---|
| MRR Growth (MoM) | 15-25% | 10-20% | 5-15% | 3-8% |
| Annual Churn | 5-12% | 5-10% | 3-7% | 2-5% |
| Net Revenue Retention | 80-95% | 100-110% | 105-115% | 110-130% |
| CAC | $150-400 | $400-800 | $800-1,500 | $2,000-5,000+ |
| LTV:CAC Ratio | 2:1-3:1 | 3:1-4:1 | 3:1-5:1 | 4:1-6:1 |
| CAC Payback | 6-12 months | 12-18 months | 12-15 months | 15-24 months |
SaaS Adoption & Usage Statistics
SaaS adoption has reached near-universal penetration among businesses. According to Zippia, 99% of companies are expected to use one or more SaaS solutions by the end of 2026. This saturation does not indicate market maturity in the traditional sense—rather, it signals a shift from adoption to optimization as organizations focus on consolidating and rationalizing their SaaS portfolios.
The average company now uses 130+ SaaS applications according to Colorlib’s 2026 research. However, this proliferation has created significant management challenges. BetterCloud’s 2026 SaaS statistics report highlights that organizations are increasingly focused on SaaS management platforms (SMPs) to gain visibility and control over their application sprawl.
SaaS spending per employee has climbed steadily, reaching $5,607 in 2024—a 7% increase driven by AI feature add-ons, price escalators, and new application adoption according to Cloudnuro. For a 500-person company, this translates to over $2.8 million in annual SaaS spend. Large enterprises with 10,000+ employees often manage SaaS budgets exceeding $50 million annually.
Despite this investment, significant waste persists. Research from Certero and CloudFuze indicates that 30-53% of SaaS licenses go unused, with the average enterprise losing $21 million annually on wasted SaaS spend. Shadow IT—untracked SaaS subscriptions—costs the average enterprise an additional $3.5-5 million annually.
| Adoption Metric | Statistic | Source |
|---|---|---|
| Companies using SaaS | 99% | Zippia |
| Average SaaS apps per company | 130+ | Colorlib |
| Companies operating predominantly on SaaS | 40% | Zippia |
| Average SaaS spend per employee | $5,607 | Cloudnuro |
| Unused SaaS licenses | 30-53% | Certero, CloudFuze |
| Annual waste per enterprise | $21M | CloudFuze |
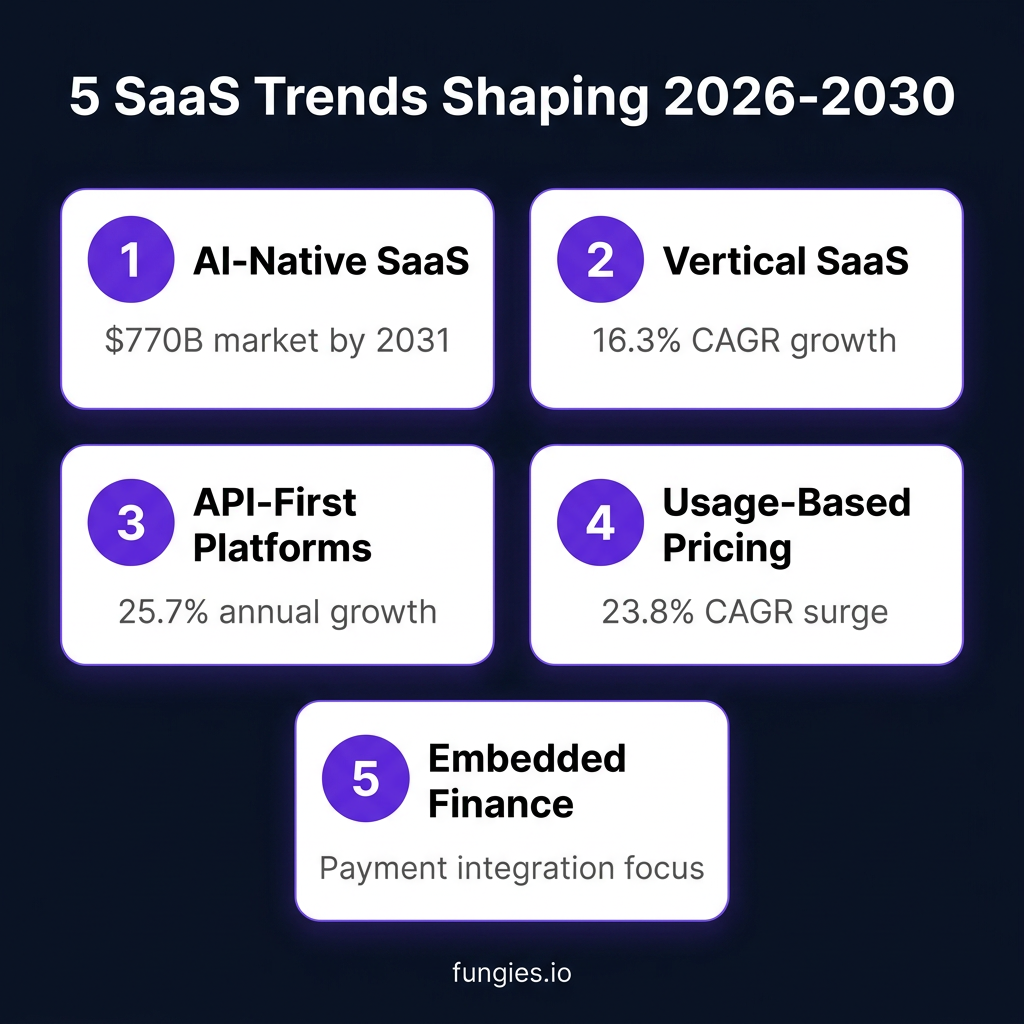
5 SaaS Trends Shaping 2026-2030
The SaaS landscape is undergoing structural transformation driven by technological advancement, changing buyer expectations, and evolving business models. These five trends will define competitive advantage through the remainder of the decade:
1. AI-Native SaaS and Agentic Automation
AI is no longer a feature—it is becoming the core architecture of next-generation SaaS. According to Coherent Market Insights, the global market for AI-driven SaaS is projected to reach $770 billion by 2031, growing at a CAGR above 40%. AI-native SaaS companies are achieving unprecedented growth velocity: some reach approximately $3 million ARR within their first year and scale to roughly $100 million by year four, far outpacing traditional SaaS benchmarks.
2. Vertical SaaS Specialization
Horizontal SaaS is giving way to vertical solutions purpose-built for specific industries. The Vertical SaaS market is estimated at $143.45 billion in 2026 and forecast to grow at 16.3% CAGR through 2035 according to Business Research Insights. Healthcare SaaS, construction technology, legal tech, and restaurant/hospitality SaaS are among the fastest-growing verticals, each addressing industry-specific workflows and compliance requirements.
3. API-First and Composable Architecture
The shift from monolithic suites to composable, API-first platforms is accelerating. API-first platforms are growing at 25.7% CAGR according to Ideaplan research. This architectural approach enables organizations to build best-of-breed stacks rather than accepting the limitations of all-in-one solutions. For SaaS vendors, API-first design opens partnership ecosystems and embedded distribution channels.
4. Usage-Based and Flexible Pricing
Traditional seat-based pricing is giving way to consumption and outcome-based models. Usage-based billing is projected to grow at 23.8% CAGR, reflecting buyer demand for pricing that aligns with value received. This shift requires SaaS companies to develop sophisticated metering infrastructure and customer success functions that ensure adoption correlates with pricing—challenging but necessary for competitive positioning.
5. Embedded Finance and Payment Integration
SaaS platforms are increasingly embedding financial services directly into their workflows. From payment processing to lending to insurance, embedded finance creates new revenue streams and deepens customer relationships. For SaaS companies serving developers and digital product creators, platforms like Fungies.io enable seamless payment integration with automatic tax compliance—removing the complexity of global commerce and allowing SaaS vendors to focus on core product development.
SaaS Trends Infographic
Methodology & Data Sources
This report compiles data from authoritative market research firms, industry analysts, and verified corporate filings. Primary sources include Precedence Research, Grand View Research, Fortune Business Insights, Gartner, Statista, Synergy Research Group, SaaS Capital, and publicly available financial reports from major SaaS vendors.
Market size figures represent analyst consensus estimates for end-user spending on Software as a Service solutions, excluding Infrastructure as a Service (IaaS) and Platform as a Service (PaaS) unless otherwise noted. Regional breakdowns are based on vendor-reported revenue by geography and analyst allocation models. Benchmark data derives from surveys of private SaaS companies conducted by SaaS Capital, OpenView Partners, and other venture capital firms.
All figures are current as of June 2026. Projections represent analyst forecasts based on historical growth patterns, macroeconomic assumptions, and industry trend analysis. Readers should note that SaaS market sizing varies across research firms due to differing definitions of included services and methodological approaches.
Frequently Asked Questions
What is the current size of the SaaS market?
The global SaaS market is valued at approximately $465 billion in 2026 according to Precedence Research, with other analysts including Grand View Research ($399B in 2024) and Fortune Business Insights ($266-316B range) providing varying estimates based on different methodological scopes.
What is the projected growth rate for SaaS?
The SaaS market is projected to grow at a 12-18% CAGR through 2030-2035, with most analysts converging on 12-13% for mature markets. This would expand the market to between $774 billion and $1.37 trillion by the mid-2030s.
Which region has the largest SaaS market?
North America dominates the global SaaS market with 43-47% share, valued at over $141 billion in 2026. The United States specifically accounts for the majority of this, driven by high cloud adoption rates and concentration of SaaS vendors.
What are healthy SaaS benchmarks for CAC and LTV?
Healthy B2B SaaS companies should target an LTV:CAC ratio of at least 3:1, with 4:1 or higher indicating strong unit economics. CAC payback periods should be under 12 months for SMB-focused products and under 18 months for enterprise sales.
What is the biggest challenge facing SaaS companies in 2026?
Rising customer acquisition costs represent the primary challenge, with median CAC increasing 60% over five years to $1,200 per customer. Combined with longer sales cycles and compressed NRR, SaaS companies must focus on product-led growth, efficient go-to-market motions, and retention optimization to maintain sustainable growth.
Sources & Citations
- Precedence Research – Software as a Service (SaaS) Market Size, Share, and Trends 2026 to 2035: https://www.precedenceresearch.com/software-as-a-service-market
- Grand View Research – SaaS Market Size & Share Report, 2030: https://www.grandviewresearch.com/industry-analysis/saas-market-report
- Fortune Business Insights – Software as a Service [SaaS] Market Size, Global Report, 2034: https://www.fortunebusinessinsights.com/software-as-a-service-saas-market-102222
- Market Data Forecast – SaaS Market Size & Growth, 2034: https://www.marketdataforecast.com/market-reports/software-as-a-service-saas-market
- Technavio – Software As A Service (SaaS) Market Size 2026-2030: https://www.technavio.com/report/software-as-a-service-saas-market-size-industry-analysis
- Synergy Research Group – Microsoft Leads in SaaS Market: https://www.srgresearch.com/articles/microsoft-leads-saas-market-salesforce-adobe-oracle-and-sap-follow
- TechnologyChecker.io – Salesforce Statistics 2026: https://technologychecker.io/blog/salesforce-statistics-trends-insights-and-salesforce-market-share
- Colorlib – 130+ SaaS Statistics 2026: https://colorlib.com/wp/saas-statistics
- Zippia – 30 SaaS Industry Statistics 2026: https://www.zippia.com/advice/saas-industry-statistics
- Vena Solutions – 85 SaaS Statistics, Trends and Benchmarks for 2026: https://www.venasolutions.com/blog/saas-statistics
- Data-Mania – B2B SaaS Benchmarks 2026: https://www.data-mania.com/blog/b2b-saas-benchmarks-2026-annual-report
- PM Toolkit – SaaS Metrics Benchmarks 2026: https://pmtoolkit.ai/benchmarks/saas-metrics-2026
- SaaS Hero – LTV to CAC Ratio Benchmarks for B2B SaaS 2026: https://www.saashero.net/strategy/b2b-saas-ltv-cac-benchmarks
- Cloudnuro – 50+ Essential SaaS Statistics 2026: https://www.cloudnuro.ai/blog/saas-statistics
- Certero – Five Surprising Stats About SaaS Waste: https://www.certero.com/blog/five-surprising-stats-about-saas-waste-in-enterprise-it
- Business Research Insights – Vertical SaaS Market Size: https://www.businessresearchinsights.com/market-reports/vertical-saas-market-117289
- Ideaplan.io – SaaS Market Trends 2026: https://www.ideaplan.io/ideas/trends
- Zylo – 2026’s Top SaaS Trends: https://zylo.com/blog/saas-trends