Here’s a number that should terrify every SaaS founder: 73% of product teams struggle with feature prioritization, making it the single biggest operational challenge in product development. And it’s not because they lack ideas — most backlogs have 200+ feature requests. The problem is deciding what to build next when everything feels important.
I’ve watched teams waste months building features nobody uses while ignoring the ones that could actually move the needle. The difference between winning and losing SaaS companies often comes down to one thing: having a systematic approach to prioritization.
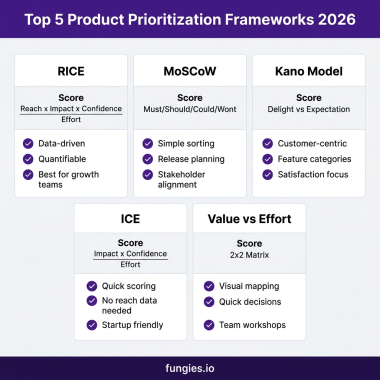
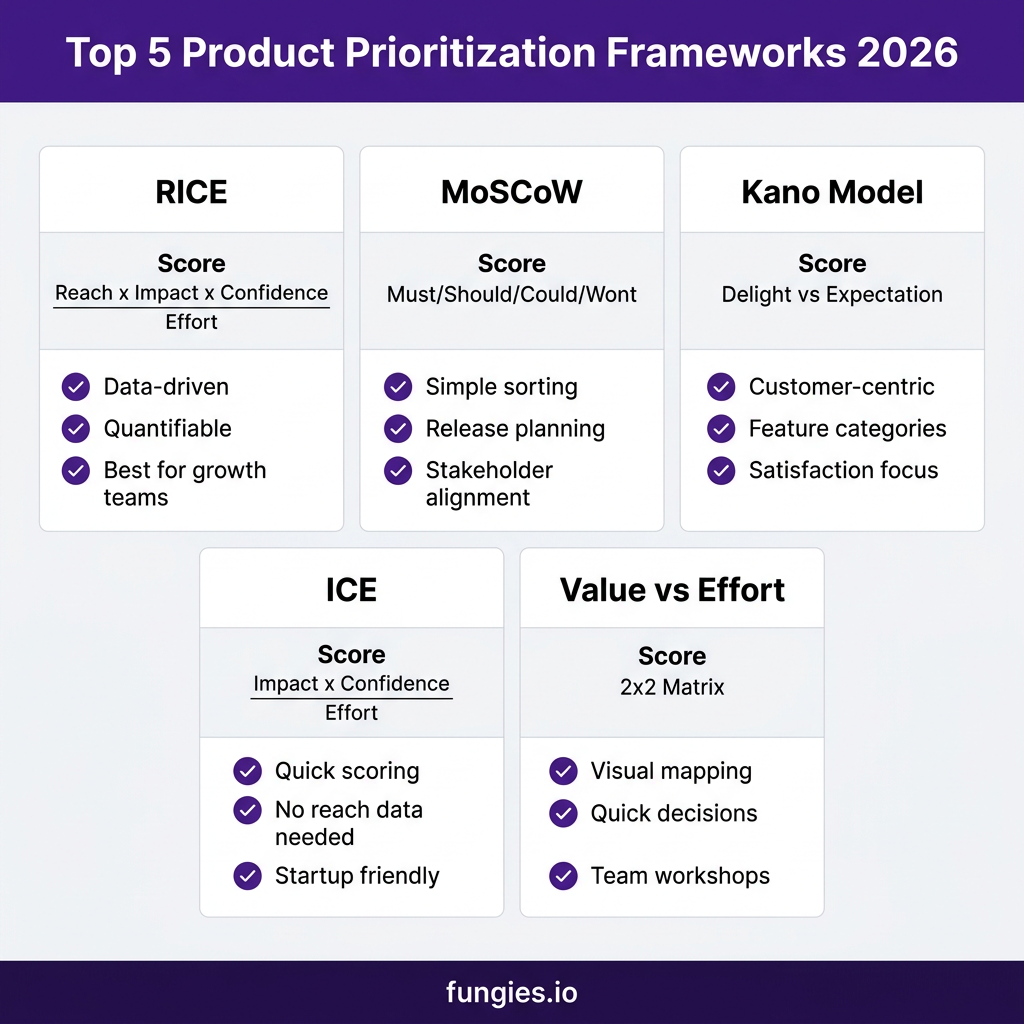
In this guide, I’ll break down the five most effective product roadmap prioritization frameworks for 2026 — RICE, MoSCoW, Kano, ICE, and Value vs. Effort. You’ll learn exactly how to implement each one, when to use which, and how to avoid the common mistakes that derail even experienced product teams.
What Is Product Roadmap Prioritization?
Product roadmap prioritization is the process of deciding which features, improvements, and initiatives to build — and in what order. It’s about making strategic trade-offs between competing demands when you have limited engineering resources, tight deadlines, and endless stakeholder opinions.
Without a prioritization framework, teams default to one of three broken patterns:
- The loudest voice wins: Whoever argues longest or has the most political capital gets their feature built
- Recency bias: The most recent customer complaint or executive request jumps to the front of the line
- HiPPO decisions: The Highest Paid Person’s Opinion overrides all data and customer research
A good prioritization framework eliminates these biases by introducing objective criteria. It gives your team a shared language for evaluating ideas and makes trade-offs visible to everyone.
Why Prioritization Matters More Than Ever in 2026
The 2026 State of Product Report reveals some sobering statistics. 84% of product teams worry their current products won’t succeed in the market. Meanwhile, the average feature adoption rate sits at just 6.4% — meaning teams are building 15 features for every one that users actually care about.
Here’s what’s changed:
- AI has accelerated development: Engineering teams can ship faster than ever, but this just amplifies the cost of building the wrong things
- Customer expectations have shifted: Users now expect constant improvement, but only improvements that solve their actual problems
- Competition is fiercer: The barrier to entry in SaaS has never been lower, meaning first-mover advantage comes from prioritization speed, not just development speed
The teams that win aren’t necessarily the ones with the best engineers. They’re the ones who consistently bet on the right features.
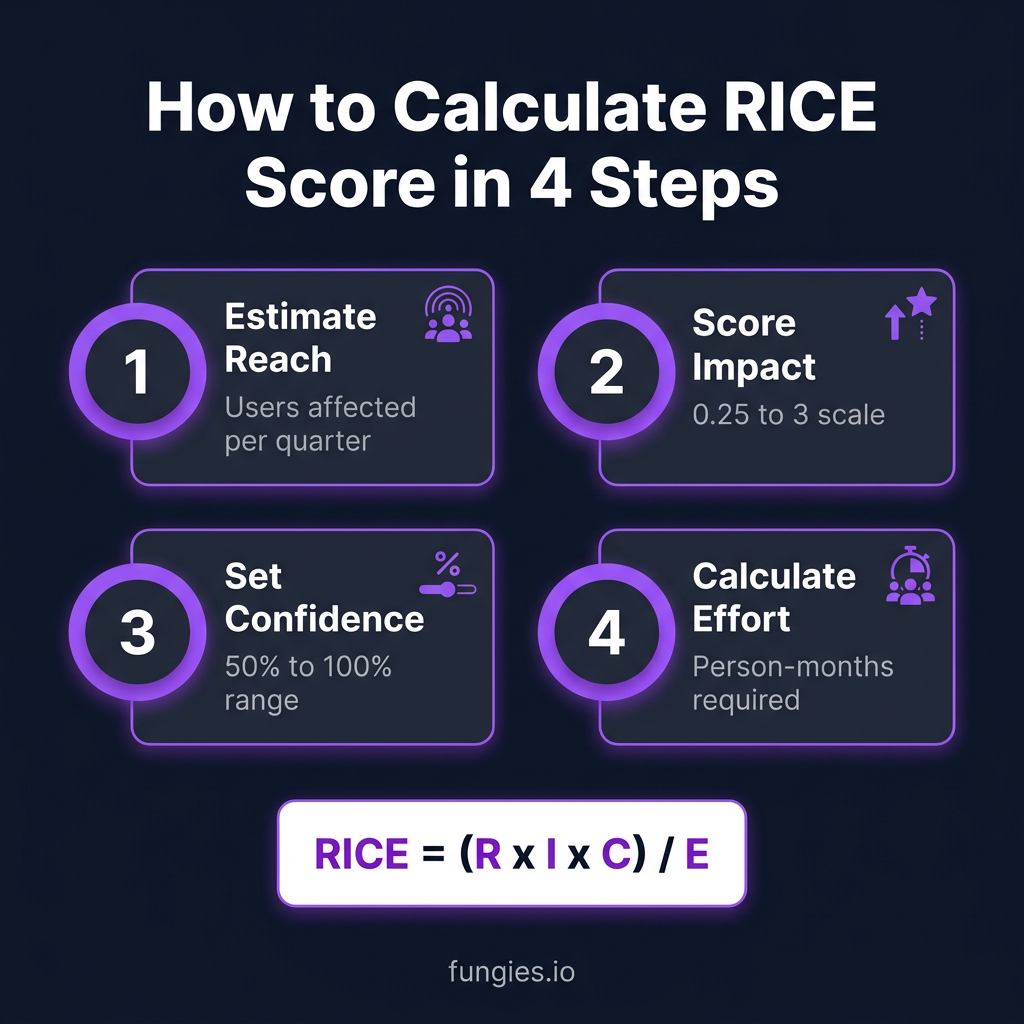
Framework 1: RICE Scoring (Reach × Impact × Confidence ÷ Effort)
RICE is the gold standard for data-driven product teams. Developed by Intercom’s product team, it’s designed to answer one question: What’s the total impact per unit of effort?
How RICE Works
Each feature gets scored on four dimensions:
- Reach: How many users will this affect in a given time period (usually per quarter)? Use actual numbers from your analytics.
- Impact: How much will this impact individual users? Score 3 = massive impact, 2 = high, 1 = medium, 0.5 = low, 0.25 = minimal.
- Confidence: How confident are you in your Reach and Impact estimates? 100% = high confidence, 80% = medium, 50% = low.
- Effort: How many person-months will this require? Include design, engineering, and testing time.
RICE Score Example
Let’s say you’re evaluating a new onboarding flow:
- Reach: 5,000 new signups per quarter
- Impact: 2 (high — improves activation significantly)
- Confidence: 80% (you have user research backing this)
- Effort: 2 person-months
RICE Score = (5,000 × 2 × 0.8) ÷ 2 = 4,000
Compare that to a feature with Reach: 500, Impact: 3, Confidence: 50%, Effort: 1:
RICE Score = (500 × 3 × 0.5) ÷ 1 = 750
The onboarding flow wins by a massive margin — even though the second feature has higher per-user impact, it affects far fewer people.
When to Use RICE
RICE works best when:
- You have reliable analytics data for Reach calculations
- Your team is comfortable with numerical scoring
- You’re comparing 10+ features and need to rank them objectively
- You want to deprioritize “pet projects” that lack data support
Framework 2: MoSCoW Method (Must/Should/Could/Won’t)
MoSCoW is the simplest framework on this list — and that’s exactly why it works. Developed by Dai Clegg at Oracle in 1994, it’s designed for release planning, not strategic prioritization.
The Four Categories
- Must Have: Critical requirements. Without these, the release fails. Ask: “What happens if we don’t ship this?” If the answer is “we cancel the release,” it’s a Must Have. Typically 60% of effort.
- Should Have: Important but not vital. Painful to omit, but the release can succeed without them. Typically 20% of effort.
- Could Have: Nice-to-have features. Desirable if time permits. These are your buffer — if you hit delays, you cut here first. Typically 20% of effort.
- Won’t Have (this time): Explicitly excluded from this release. This category is crucial — it manages stakeholder expectations and prevents scope creep.
The 60-20-20 Rule
The Dynamic Systems Development Method (DSDM) recommends allocating effort as 60% Must, 20% Should, 20% Could. This ensures you have buffer for unexpected complexity while guaranteeing the core release delivers value.
When to Use MoSCoW
MoSCoW shines when:
- You need stakeholder alignment quickly
- You’re planning a specific release with a fixed deadline
- Your team gets overwhelmed by complex scoring systems
- You need to explicitly say “no” to features to prevent scope creep
Framework 3: Kano Model (Delight vs. Expectation)
The Kano Model, developed by Professor Noriaki Kano in the 1980s, takes a completely different approach. Instead of scoring features by effort and impact, it categorizes them by how they affect customer satisfaction.
The Five Feature Categories
- Basic (Must-be): Expected features. Their presence doesn’t increase satisfaction, but their absence causes extreme dissatisfaction. Example: Password reset in a SaaS app. Users expect it to work — they don’t celebrate when it does, but they rage when it doesn’t.
- Performance: Linear satisfaction. The more you invest, the happier customers get. Example: Page load speed. Faster is always better, and users notice the difference.
- Excitement (Delighters): Unexpected features that create disproportionate delight. Users don’t know they want these until they see them. Example: Notion’s block-based editing when it first launched.
- Indifferent: Features users don’t care about. Investment here is wasted.
- Reverse: Features that actually annoy some users while pleasing others. Example: aggressive email notifications.
How to Use Kano for Prioritization
Run a Kano survey asking users two questions for each potential feature:
- How would you feel if this feature were included?
- How would you feel if this feature were not included?
Response options: I like it, I expect it, I’m neutral, I can tolerate it, I dislike it.
Based on the combination of answers, you categorize each feature. Your roadmap priority becomes:
- First: Fix any broken Basic features
- Second: Invest in Performance features where you lag competitors
- Third: Add one or two Excitement features to differentiate
- Never: Build Indifferent or Reverse features
When to Use Kano
The Kano Model is ideal when:
- You have direct access to customers for surveys
- You’re entering a competitive market and need differentiation
- Your team keeps building “cool” features that users ignore
- You want to understand emotional response, not just functional utility
Framework 4: ICE Scoring (Impact × Confidence ÷ Effort)
ICE is RICE’s simpler cousin. It removes the Reach component, making it faster to calculate when you don’t have reliable user analytics.
ICE Formula
ICE Score = (Impact × Confidence) ÷ Effort
Scoring works the same as RICE, but without Reach:
- Impact: 1-10 scale (or 0.25-3 like RICE)
- Confidence: Percentage (50%-100%)
- Effort: Person-months
When to Use ICE
ICE is perfect for:
- Early-stage startups without mature analytics
- Internal tools where “Reach” is hard to quantify
- Quick prioritization sessions where you need fast answers
- Teams new to scoring frameworks who find RICE overwhelming
The trade-off: ICE doesn’t account for how many users a feature affects. A feature that delights 10 power users might score higher than one that helps 1,000 casual users.
Framework 5: Value vs. Effort Matrix
The simplest framework of all — and often the best starting point. Plot every feature on a 2×2 grid:
- X-axis: Effort (Low to High)
- Y-axis: Value (Low to High)
The Four Quadrants
- High Value, Low Effort (Quick Wins): Do these first. They’re the easiest path to impact.
- High Value, High Effort (Major Projects): Plan these carefully. They need resources and time, but the payoff justifies it.
- Low Value, Low Effort (Fill-ins): Do these when you have spare cycles or need quick morale wins.
- Low Value, High Effort (Avoid): Kill these. They’re resource drains with minimal return.
When to Use Value vs. Effort
This matrix works best when:
- You need to align a group quickly in a workshop setting
- You’re doing initial triage on a massive backlog
- Stakeholders need visual clarity, not numerical precision
- You want to identify “quick wins” for momentum
Comparison: Which Framework Should You Use?
| Framework | Best For | Data Needed | Time to Apply | Team Size |
|---|---|---|---|---|
| RICE | Growth teams, mature products | Analytics for Reach | Medium | 5+ PMs |
| MoSCoW | Release planning, stakeholder alignment | Minimal | Fast | Any |
| Kano | Customer-centric differentiation | Survey responses | Slow | Any |
| ICE | Startups, quick decisions | Minimal | Fast | 1-3 PMs |
| Value vs Effort | Workshops, initial triage | Minimal | Fast | Any |
Common Prioritization Mistakes (And How to Avoid Them)
Mistake 1: Ignoring Confidence
Teams consistently overestimate Impact and underestimate Effort. The Confidence score in RICE/ICE exists specifically to counter this. If you don’t have data, be honest about it. A feature with 50% confidence should rarely beat one with 100% confidence.
Mistake 2: Treating All “Must Haves” Equally
In MoSCoW, everything becomes a “Must Have” because stakeholders lobby for their priorities. Combat this with the DSDM test: “What happens if we don’t deliver this?” If the answer isn’t “we cancel the release,” it’s not a Must Have.
Mistake 3: Prioritizing in a Vacuum
The best prioritization happens with input from engineering, design, customer success, and sales. A feature that looks high-impact to product might be a nightmare to implement — or customers might not actually want it.
Mistake 4: Set It and Forget It
Priorities change. New information emerges. The framework you used last quarter might not fit this quarter’s challenges. Re-evaluate your prioritization approach every 3-6 months.
How to Implement Your First Prioritization Framework
If you’re starting from scratch, here’s a 4-week rollout plan:
- Week 1: Audit your current backlog. List every feature request with a one-sentence description.
- Week 2: Pick one framework (I recommend starting with Value vs. Effort or ICE). Score your top 20 features.
- Week 3: Run a team workshop to review scores and align on the top 5 priorities for next quarter.
- Week 4: Present the prioritized roadmap to stakeholders, explaining the framework and why it produces better decisions.
Don’t aim for perfection. Aim for better than gut feel. Even a simple framework beats HiPPO decisions.
Frequently Asked Questions
Can I combine multiple frameworks?
Yes. Many teams use MoSCoW for release planning and RICE for quarterly roadmap prioritization. The key is using the right tool for the right decision.
What if stakeholders reject numerical scoring?
Start with Value vs. Effort or MoSCoW. These frameworks produce visual outputs that feel less “mechanical” than RICE scores. Once stakeholders see better decisions, they’ll trust more rigorous methods.
How do I estimate Effort accurately?
Involve engineering leads in scoring. Use t-shirt sizing (S/M/L/XL) first, then convert to person-months. Track actual effort vs. estimates to calibrate over time.
Should I prioritize bugs the same way as features?
Generally, no. Critical bugs (security, data loss, major functionality broken) should have a fast-track process outside your feature prioritization framework. Use the framework for everything else.
How often should I re-prioritize?
Review your full backlog quarterly. Re-score individual features when you get new data (user research, competitive moves, technical discoveries).
Conclusion: Start Prioritizing Systematically
The 73% of product teams that struggle with prioritization share one thing in common: they don’t use a consistent framework. They rely on intuition, politics, and recency bias — and they wonder why they build features nobody uses.
The frameworks in this guide aren’t magic. They won’t guarantee success. But they will guarantee better decisions than gut feel alone.
Pick one. Start using it this week. Your future self — and your engineering team — will thank you.
And if you’re building a SaaS business, remember that prioritization extends beyond product features. Choosing the right tools for payments, billing, and tax compliance matters just as much. Get started with Fungies to handle your Merchant of Record needs so you can focus on building what actually matters.
Sources
- Product Roadmap Planning: Master Prioritization Frameworks — 2024 State of Product Management Report
- The State of Product in 2026 — Atlassian Research
- Feature Prioritization Matrix for Product Teams — Userpilot Analysis
- RICE Scoring Model — ProductPlan Glossary
- MoSCoW Prioritization — Product School
- Kano Model — ProductPlan Glossary