Here’s a sobering statistic: 87% of customers trust a brand more when they receive excellent customer service, yet most SaaS companies are tracking the wrong metrics entirely. They’re obsessing over vanity numbers while their best customers quietly churn.
I’ve seen it happen dozens of times. A startup hits product-market fit, scales to $1M ARR, then watches their growth flatline because they never built a proper customer success function. They were too busy acquiring new users to notice their existing ones were leaving.
The truth? In 2026, customer success isn’t a nice-to-have department — it’s your primary growth engine. With approximately 40% of SaaS revenue now coming from renewals and expansion (according to Pavilion’s 2025 benchmarks), your CS metrics directly determine whether you scale or stall.
What Are SaaS Customer Success Metrics?
Customer success metrics are the quantitative signals that tell you whether your customers are achieving their desired outcomes with your product. Unlike support metrics (which measure reactive problem-solving), CS metrics track proactive value delivery.
Think of it this way: support asks “Did we fix their issue?” while customer success asks “Are they getting what they paid for?” The difference is massive. One keeps customers from leaving angry. The other keeps them from leaving at all.
In my experience, the best SaaS companies track metrics across three dimensions:
- Retention metrics — Will they stay?
- Engagement metrics — Are they using the product?
- Expansion metrics — Will they grow with us?
Why Customer Success Metrics Matter More Than Ever
The SaaS landscape has shifted dramatically. The growth-at-all-costs era is over. Investors now want efficient growth, and that means making every existing customer count.
Here’s what the data tells us:
- SaaS companies with high NRR (above 106%) grow 2.5x faster than low-NRR counterparts
- Top-quartile companies generate an incremental $4M in ARR through customer expansion alone
- Automated health scores can predict churn 63 days before cancellation
- Companies with 70%+ feature adoption have double the retention likelihood
If you’re not measuring customer success systematically, you’re flying blind. And in 2026, that’s not just risky — it’s unsustainable.
The 7 Essential SaaS Customer Success Metrics
Not all metrics are created equal. After analyzing hundreds of SaaS companies, I’ve identified the seven metrics that actually correlate with growth. Track these religiously, and you’ll have a clear picture of your customer health.
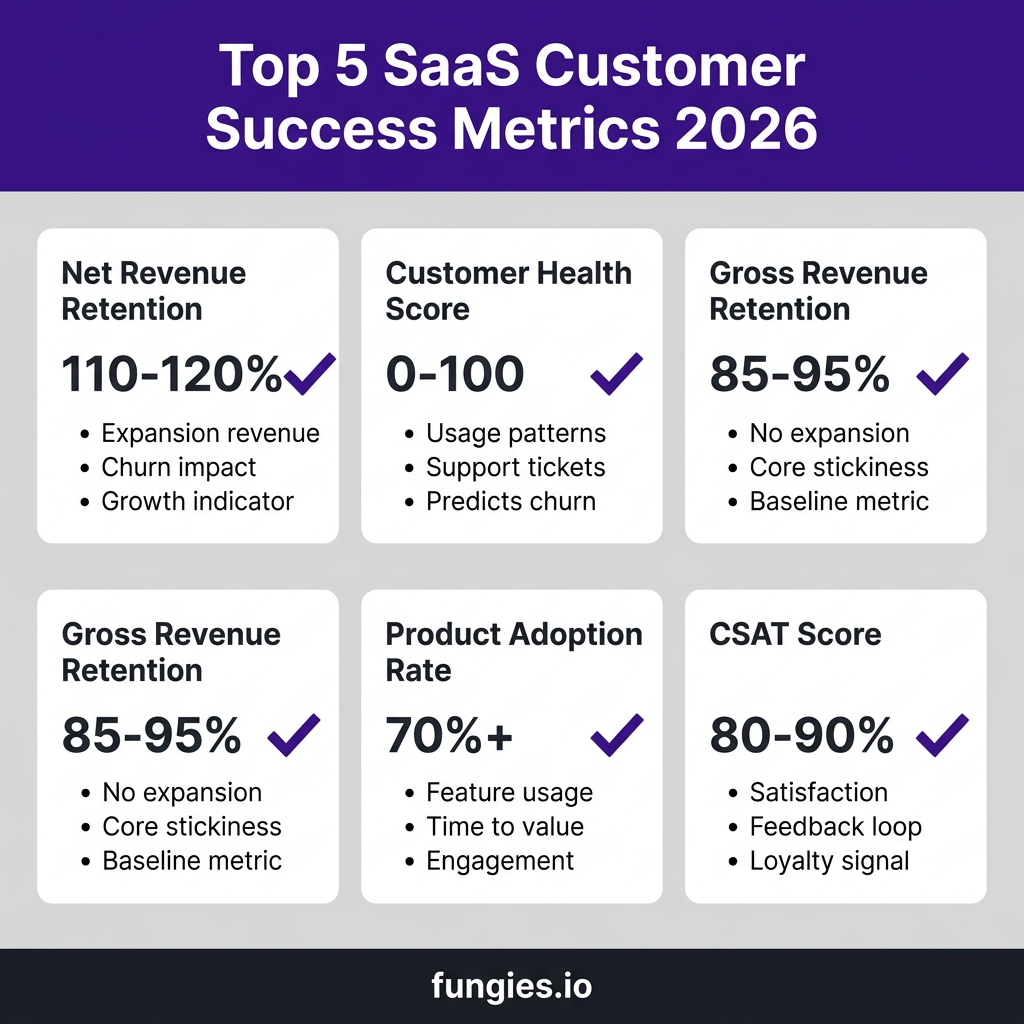
1. Net Revenue Retention (NRR)
NRR is the king of customer success metrics. It measures the percentage change in revenue from existing customers over a period, including expansions, contractions, and churn.
Formula: (Starting MRR + Expansion – Contraction – Churn) / Starting MRR × 100
Benchmarks for 2026:
- Top quartile: 120%+ NRR
- Good: 110-120% NRR
- Median: 100-110% NRR
- Concerning: Below 100% NRR
Honestly, if your NRR is below 100%, you have a leaky bucket. You’re losing existing revenue faster than you can replace it with new sales. Fix this before spending another dollar on acquisition.
2. Customer Health Score
A customer health score is a composite metric that predicts the likelihood of a customer churning, expanding, or staying neutral. It’s calculated from multiple data points weighted by their predictive power.
Typical components include:
- Product usage frequency (30-40% weight)
- Feature adoption breadth (20-25% weight)
- Support ticket sentiment (15-20% weight)
- NPS or CSAT scores (10-15% weight)
- Engagement with communications (5-10% weight)
One $35M ARR project management SaaS reduced quarterly gross churn from 5.2% to 3.6% by automating health scores across these signals. The key is calibrating your model — expect 4-6 weeks of tuning before predictions become accurate.
3. Gross Revenue Retention (GRR)
While NRR includes expansion revenue, GRR measures retention without it. It shows how sticky your core product is before upsells and cross-sells.
Formula: (Starting MRR – Churn – Contractions) / Starting MRR × 100
2026 Benchmarks:
- Enterprise SaaS: 90%+ GRR
- Mid-market: 85-90% GRR
- SMB: 80-85% GRR
If your GRR is strong but NRR is weak, you have a product-market fit problem with your base offering but haven’t figured out expansion. If both are weak, you have a fundamental value delivery issue.
4. Product Adoption Rate
This metric tracks what percentage of your product’s features each customer actually uses. It’s one of the strongest predictors of retention.
Why it matters: Customers using 70%+ of your features have roughly double the retention likelihood of those using fewer features. They’re more invested, see more value, and have higher switching costs.
Track adoption at both the user level (which features do individual users engage with) and the account level (are different teams using different features). This helps identify expansion opportunities and training needs.
5. Customer Satisfaction Score (CSAT)
CSAT measures immediate satisfaction with specific interactions or experiences. It’s typically collected via post-interaction surveys asking “How satisfied were you with X?” on a 1-5 or 1-10 scale.
Target: 80-90% of respondents selecting satisfied or very satisfied (4-5 on a 5-point scale).
CSAT is most valuable when paired with behavioral metrics. A customer might report high satisfaction but show declining usage — that’s a churn risk. Or they might complain but use the product heavily — that’s an opportunity to turn them into an advocate.
6. Net Promoter Score (NPS)
NPS measures customer loyalty by asking: “How likely are you to recommend us to a friend or colleague?” Responses of 0-6 are detractors, 7-8 are passives, and 9-10 are promoters.
Formula: % Promoters – % Detractors = NPS (range -100 to +100)
Benchmarks:
- Excellent: 50+ NPS
- Good: 30-50 NPS
- Average: 0-30 NPS
- Needs work: Below 0 NPS
NPS is particularly valuable for identifying expansion candidates (promoters) and at-risk accounts (detractors). Many SaaS companies now trigger automated playbooks based on NPS responses.
7. Time-to-Value (TTV)
TTV measures how long it takes a new customer to experience their first meaningful outcome with your product. It’s the single best predictor of long-term retention during onboarding.
Example TTV milestones:
- First login within 24 hours
- Core feature used within 3 days
- First value moment within 7 days
- Full onboarding completion within 14 days
Companies that reduce TTV through better onboarding see 25% higher first-year retention. Every day you shave off time-to-value pays dividends in customer lifetime.
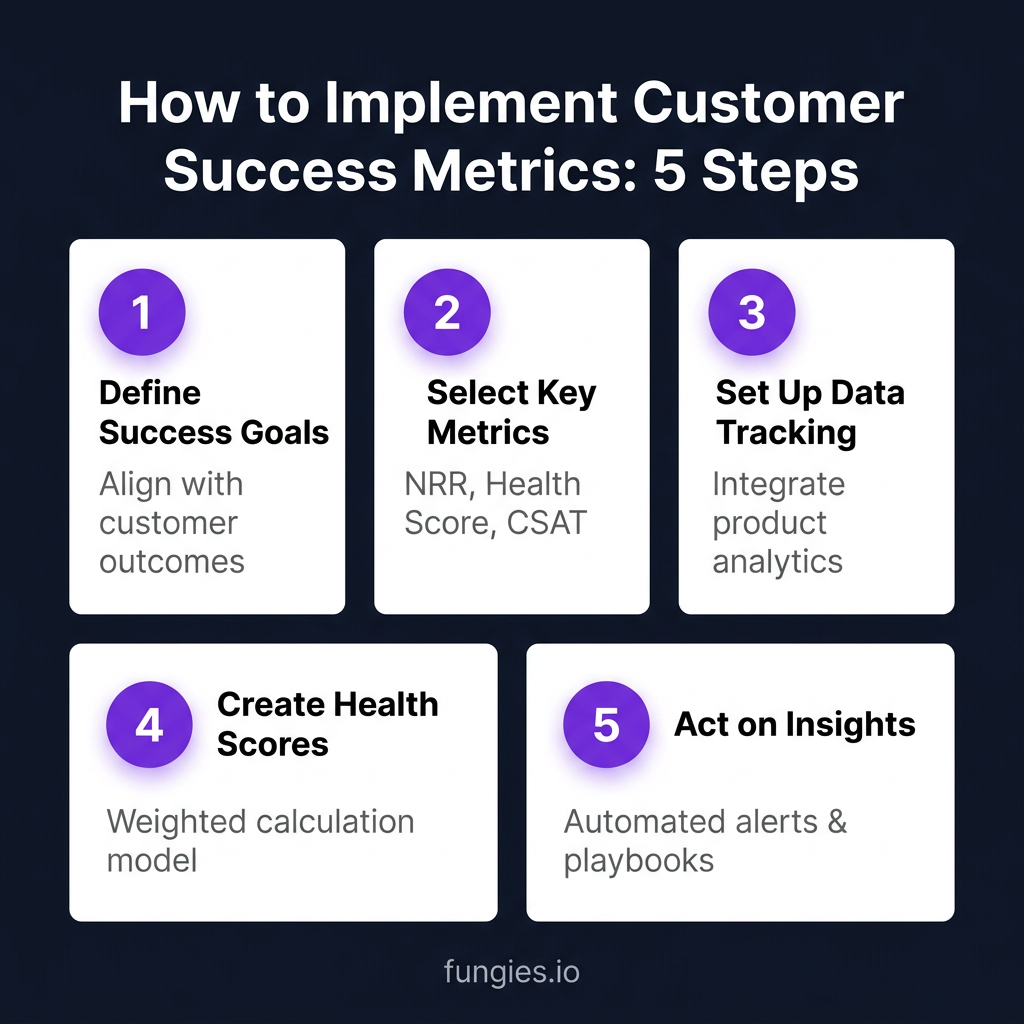
How to Implement a Customer Success Metrics Framework
Knowing what to track is only half the battle. Here’s how to actually build a metrics framework that drives action.
Step 1: Define What Success Looks Like for Your Customers
Before you can measure success, you need to define it. What outcomes do your customers want? For a project management tool, it might be “projects completed on time.” For an email platform, it’s “higher open rates.”
Interview your best customers. Ask them why they bought, what success looks like, and how they measure it. Their answers become your success milestones.
Step 2: Select Your North Star Metrics
You can’t optimize for everything. Pick 3-5 metrics that most closely correlate with your customers’ success definition. For most SaaS companies, this includes:
- One retention metric (NRR or GRR)
- One engagement metric (adoption rate or feature usage)
- One sentiment metric (NPS or CSAT)
- One efficiency metric (TTV or support ticket volume)
Step 3: Build Your Data Infrastructure
You need clean, accessible data to calculate these metrics. This typically requires integrating:
- Product analytics (Mixpanel, Amplitude, or Heap)
- CRM data (HubSpot or Salesforce)
- Support platform (Zendesk or Intercom)
- Billing system (Stripe or your payment processor)
Tools like Gainsight, ChurnZero, or Totango can help centralize this data, but you can start with a well-structured spreadsheet if budget is tight.
Step 4: Create Health Score Models
Combine your metrics into health scores that give CSMs a quick read on account status. Start simple:
- Green: Healthy — using core features regularly, high NPS, no support issues
- Yellow: At-risk — declining usage, low engagement, recent complaint
- Red: Critical — missed onboarding milestones, no logins in 14+ days, escalation
Refine your model over time as you learn which signals actually predict churn and expansion.
Step 5: Build Playbooks for Each Scenario
Metrics without action are just numbers. Create playbooks that trigger when health scores change:
- Green to Yellow: Automated check-in email + CSM notification
- Yellow to Red: Immediate CSM call + executive escalation
- Consistently Green: Expansion outreach + case study request
The goal is proactive intervention before customers even think about leaving.
Customer Success Metrics by Company Stage
Your metrics priorities should evolve as you grow. Here’s what to focus on at each stage:
| Stage | Primary Focus | Key Metrics |
|---|---|---|
| Pre-Product/Market Fit | Learning | Qualitative feedback, TTV, activation rate |
| Early Growth ($0-1M ARR) | Retention | GRR, churn rate, support ticket trends |
| Scale ($1-10M ARR) | Efficiency | NRR, health scores, CSM coverage ratios |
| Expansion ($10M+ ARR) | Growth | Expansion ARR, NRR by segment, logo retention |
Don’t try to track everything from day one. Start with the metrics that answer your most pressing questions, then add complexity as you scale.
Common Mistakes to Avoid
I’ve seen SaaS companies make the same errors repeatedly. Here are the biggest ones to watch out for:
Mistake 1: Tracking Vanity Metrics
Logins, page views, and “engagement scores” that don’t correlate with outcomes. Focus on value moments, not activity.
Mistake 2: Ignoring Qualitative Data
Numbers tell you what happened. Interviews tell you why. Balance quantitative metrics with regular customer conversations.
Mistake 3: Setting It and Forgetting It
Your metrics framework should evolve. Review quarterly whether your health scores are still predictive. Adjust weights as you learn.
Mistake 4: Not Connecting Metrics to Revenue
Every metric should ultimately tie to revenue impact. If you can’t explain how a metric affects MRR, reconsider tracking it.
FAQ: SaaS Customer Success Metrics
What’s the difference between NRR and GRR?
NRR includes expansion revenue (upsells, cross-sells) while GRR only measures retention of existing contracts. NRR above 100% means you’re growing from existing customers. GRR shows your baseline stickiness without expansion.
How often should I calculate customer health scores?
Daily for automated scores, weekly for manual reviews. Health scores should update in real-time as customer behavior changes. A customer who was healthy yesterday might be at risk today if their usage suddenly drops.
What’s a good customer health score distribution?
Aim for 70% green, 25% yellow, and 5% red. If you have more than 10% red accounts, you have a systemic problem. If you have more than 40% yellow, your health score criteria might be too strict.
Should CS metrics be tied to compensation?
Yes, but carefully. Tie CSMs to metrics they can directly influence: health score improvements, onboarding completion rates, and expansion pipeline. Avoid tying them solely to NRR, which includes factors outside their control.
How do I get started with limited resources?
Start with a simple spreadsheet tracking 3-4 key metrics manually. Interview your 10 best and 10 worst customers to understand what drives success. Build from there. You don’t need expensive software to begin measuring what matters.
Conclusion: Measure What Matters
Customer success metrics aren’t just numbers on a dashboard — they’re the vital signs of your business. In 2026, the SaaS companies that win will be those that obsess over delivering value and measuring it accurately.
Start with NRR, health scores, and time-to-value. Build your framework iteratively. And remember: the goal isn’t perfect metrics. It’s actionable insights that help your customers succeed.
Because when your customers win, you win. That’s what customer success is all about.
Ready to streamline your SaaS billing and focus on what matters? Get started with Fungies.io — the Merchant of Record platform that handles payments, tax compliance, and checkout so you can focus on delivering value to your customers.