Digital Goods Tax Statistics 2026: VAT, Compliance Costs & Global Trends (Comprehensive Report)
The taxation of digital goods and services has become one of the most complex challenges facing global businesses in 2026. With the digital economy now representing trillions in annual transactions, governments worldwide have implemented aggressive tax frameworks to capture revenue from cross-border digital commerce. This comprehensive report analyzes 30+ verified statistics on digital goods taxation, including VAT compliance costs, Digital Services Tax (DST) revenues, market forecasts, and regional breakdowns—all sourced from official government data and leading industry research.
Key Statistics at a Glance
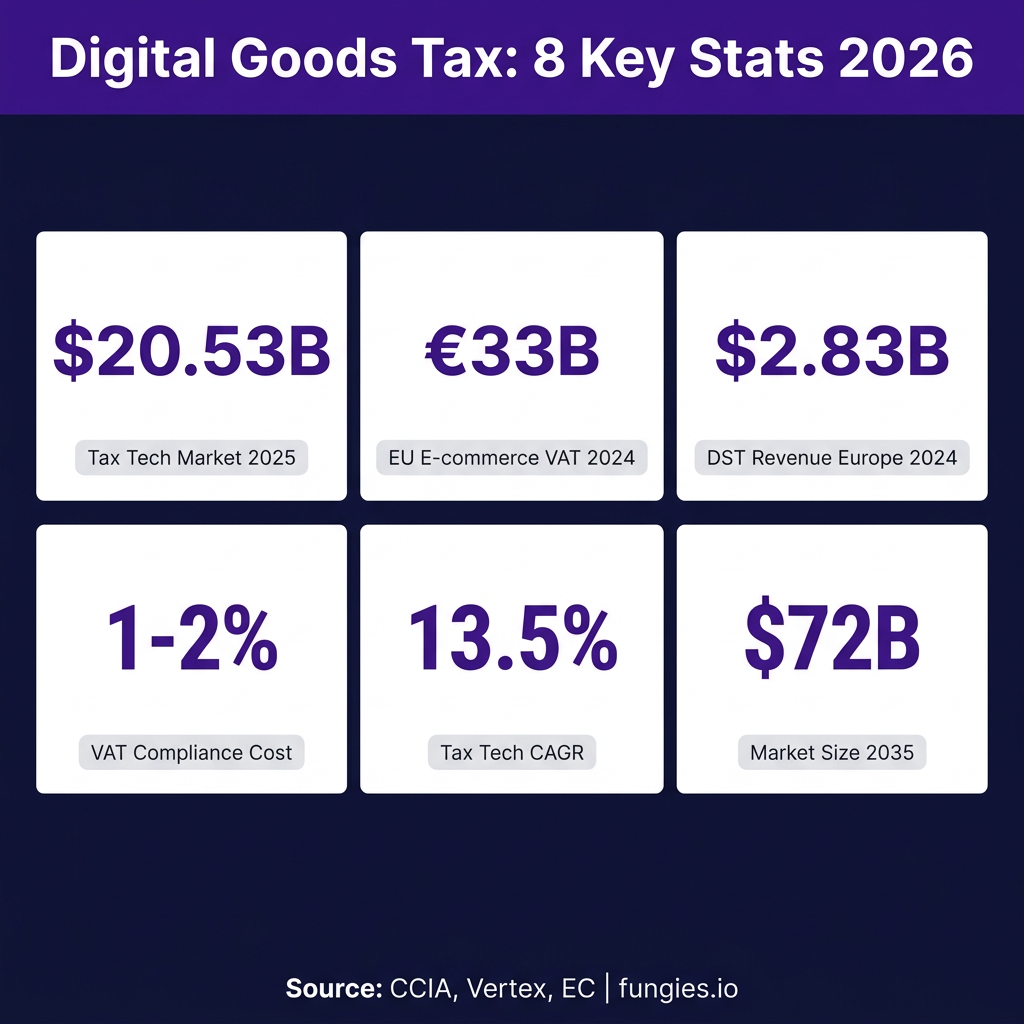
- The global tax technology market reached $20.53 billion in 2025 and is projected to hit $72.05 billion by 2035 (13.50% CAGR)
- European Union e-commerce VAT systems collected €33 billion in revenue during 2024
- Digital Services Taxes in Europe generated $2.83 billion in 2024, with cumulative collections reaching $9.13 billion since implementation
- VAT compliance costs for EU and UK businesses range from 1% to 2% of annual turnover
- The United Kingdom leads DST collections with $1.034 billion in 2024 revenue
- Cross-border tax services market is valued at $6.93 billion in 2026, growing to $12 billion by 2035
- UK VAT receipts reached £170 billion in 2024/25, up from £168 billion the previous year
- Canada’s proposed DST would generate an estimated $2.7 billion in retroactive payments for 2025
- The tax management software segment is growing at 11.80% CAGR, reaching $56.02 billion by 2034
- Over 100 jurisdictions worldwide now apply VAT or GST to digital services sold by non-resident providers
Market Size & Growth
The tax technology sector has emerged as a critical infrastructure component for businesses navigating increasingly complex global tax regulations. According to InsightAce Analytic, the tax tech market was valued at $20.53 billion in 2025 and is forecast to reach $72.05 billion by 2035, representing a compound annual growth rate (CAGR) of 13.50%.
This growth trajectory is driven by several converging factors: the expansion of multinational business operations, rising digitization of finance functions, increased adoption of enterprise resource planning systems, and the growing demand for audit-ready tax data. The software segment dominates the market, accounting for approximately 59% of total market share in 2026.
Fortune Business Insights reports that the tax management software market specifically was valued at $20.26 billion in 2025 and is projected to grow from $22.97 billion in 2026 to $56.02 billion by 2034, exhibiting an 11.80% CAGR. North America leads regional adoption with a 34.70% market share in 2025, followed by Europe and Asia-Pacific.
The cross-border tax service market, which specifically addresses international tax compliance needs, is valued at $6.93 billion in 2026 and is projected to reach $12 billion by 2035 at a 5.6% CAGR, according to WiseGuy Reports. This segment is particularly relevant for SaaS companies and digital goods merchants operating across multiple jurisdictions.
| Market Segment | 2025/2026 Value | 2030/2034/2035 Value | CAGR |
|---|---|---|---|
| Tax Technology (Overall) | $20.53B | $72.05B (2035) | 13.50% |
| Tax Management Software | $20.26B | $56.02B (2034) | 11.80% |
| Cross-Border Tax Services | $6.93B | $12B (2035) | 5.60% |
| Tax Software (TechSci) | $27.29B | $50.30B (2030) | 10.73% |
Digital Services Tax Revenue by Country
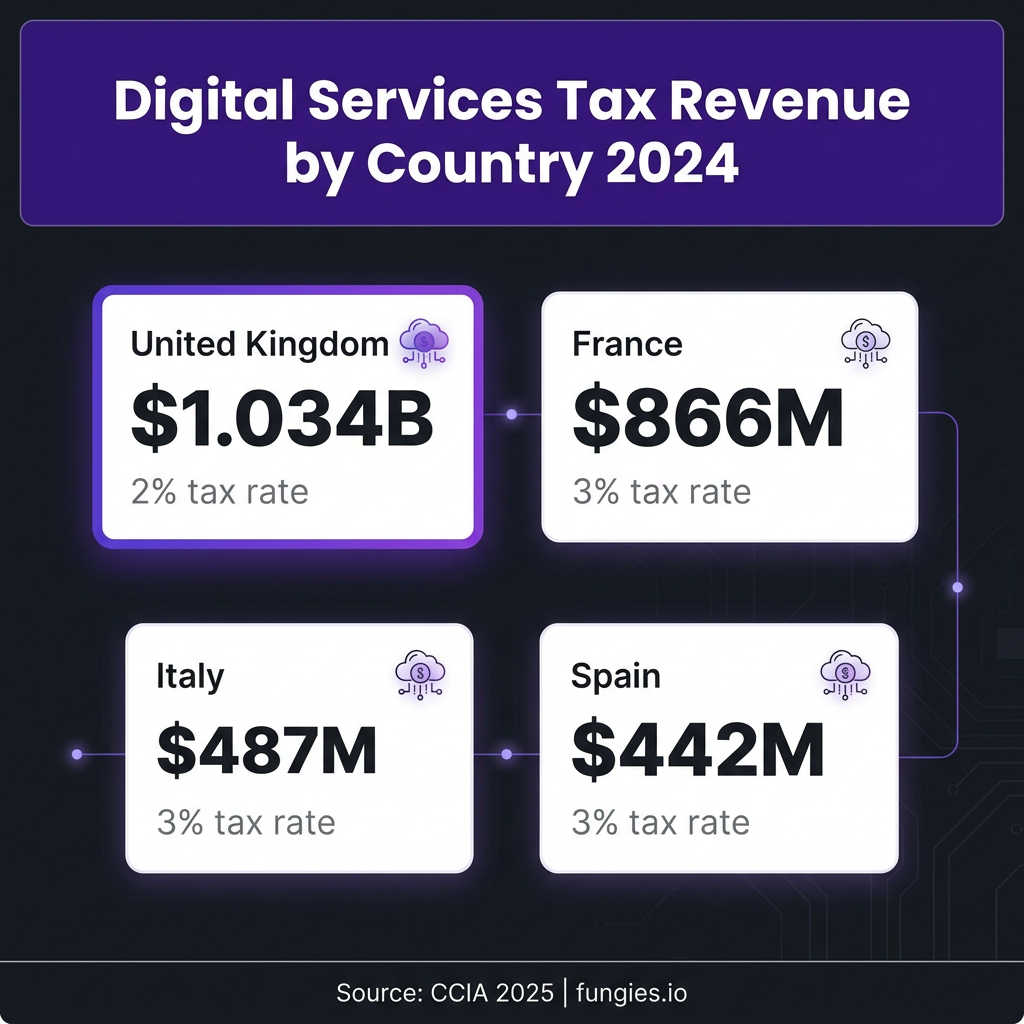
Digital Services Taxes (DSTs) have become a significant revenue source for governments seeking to tax large technology companies operating within their jurisdictions. According to the Computer & Communications Industry Association (CCIA), the four major European DST jurisdictions collected a combined $2.83 billion in 2024, bringing cumulative DST revenues to $9.13 billion since implementation.
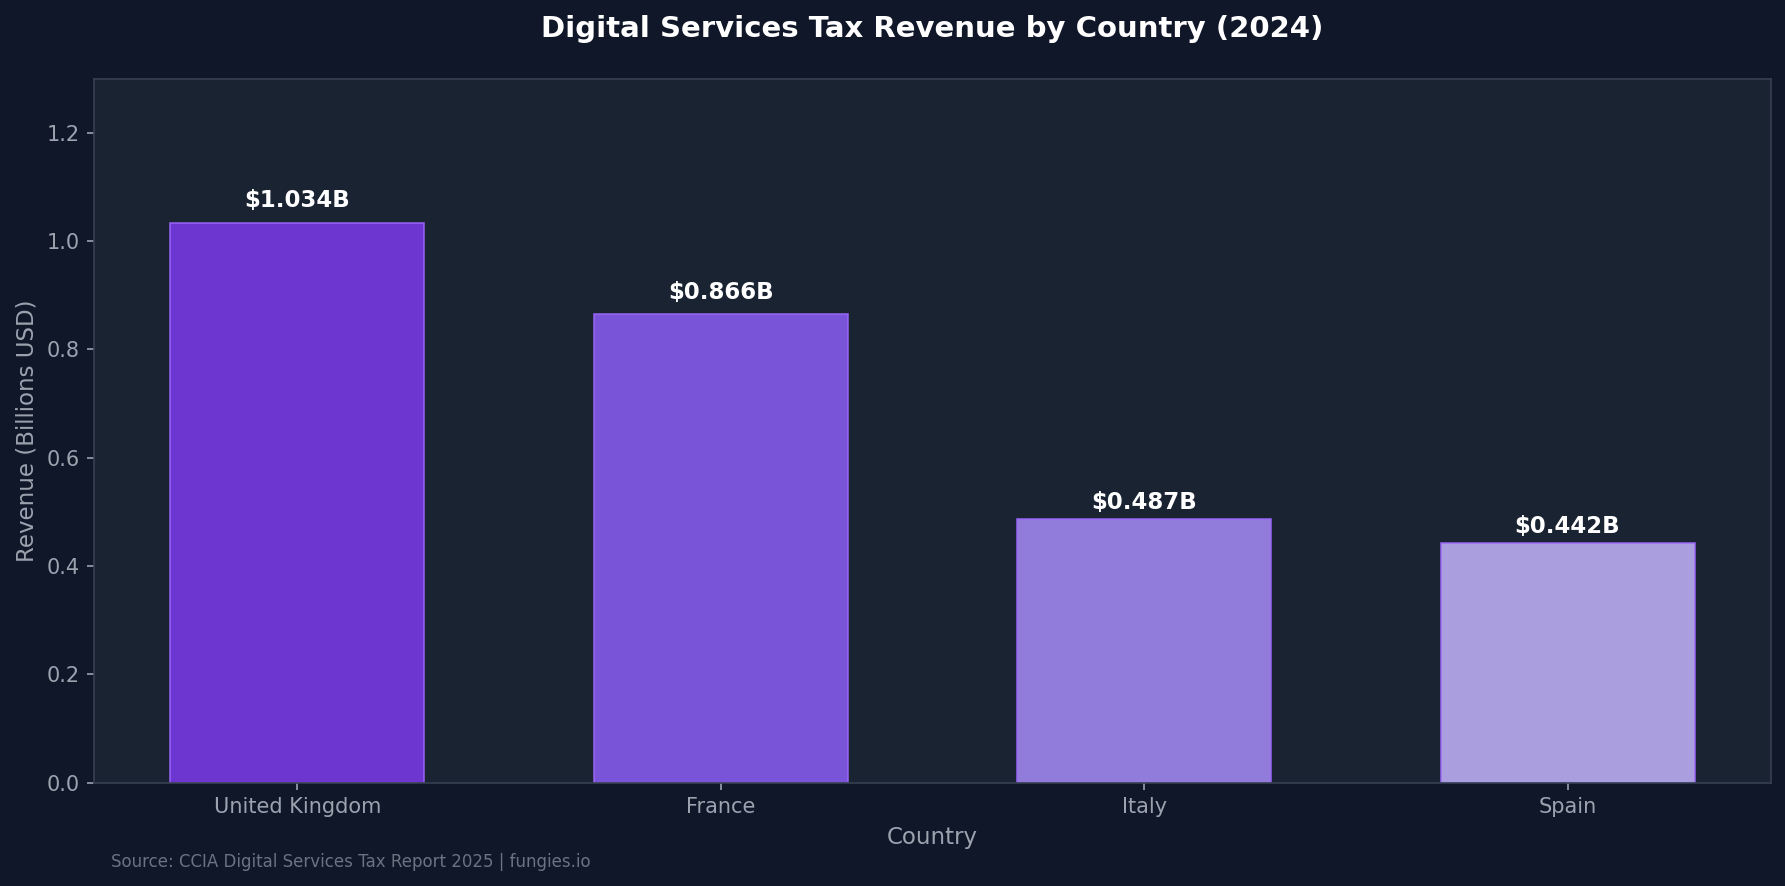
The United Kingdom leads DST collections, generating $1.034 billion in 2024 with cumulative revenues of $3.092 billion since the tax’s introduction in 2020. The UK applies a 2% tax rate on revenues derived from UK users of search engines, social media platforms, and online marketplaces, with thresholds of €560 million global revenue and €30 million UK revenue.
France follows with $866 million in 2024 DST revenue ($3.084 billion cumulative since 2019), applying a 3% rate on digital interface provision and advertising services based on user data. The French thresholds are €750 million global and €25 million domestic revenue. France was the first European country to implement a DST, with retroactive application to January 1, 2019.
Italy generated $487 million in 2024 ($1.776 billion cumulative), applying a 3% rate on online advertising, multisided digital interfaces, and data transmission services. Spain collected $442 million in 2024 ($1.175 billion cumulative) with the same 3% rate, covering online advertising, intermediary services, and data transmission.
| Country | 2024 Revenue | Cumulative Revenue | Tax Rate | Implementation Year |
|---|---|---|---|---|
| United Kingdom | $1.034B | $3.092B | 2% | 2020 |
| France | $866M | $3.084B | 3% | 2019 |
| Italy | $487M | $1.776B | 3% | 2020 |
| Spain | $442M | $1.175B | 3% | 2021 |
| Total | $2.829B | $9.127B | – | – |
Regional Breakdown: VAT on Digital Services
Value Added Tax (VAT) and Goods and Services Tax (GST) on digital services have been adopted by over 100 jurisdictions worldwide. The European Union stands at the forefront of e-commerce VAT reforms, with new figures showing that more than €33 billion in VAT revenues were collected in 2024 via the EU’s e-commerce VAT systems.
The EU’s 2021 e-commerce VAT package fundamentally changed how digital services are taxed, introducing the One-Stop Shop (OSS) system that allows businesses to register in one member state and report all EU cross-border B2C sales through a single quarterly return. This reduced the compliance burden but also expanded the reach of VAT collection.
The UK remains a major VAT jurisdiction, collecting £170 billion in VAT receipts during 2024/25, compared to £168 billion in the previous financial year. Poland generated over 287 billion zloty (approximately $72 billion) in VAT revenues during 2024, representing one of the highest collection rates in Central Europe.
According to Avalara’s global VAT tracking, standard rates for digital services vary significantly by region. The EU applies rates ranging from 17% (Luxembourg) to 27% (Hungary), with most major economies at 20% or above. Outside Europe, Australia applies 10% GST, Canada has a 5% federal GST plus provincial taxes bringing total rates to 5-15%, and India applies 18% GST on most digital services.
| Region/Country | VAT/GST Rate | Registration Threshold | Notes |
|---|---|---|---|
| European Union (27 states) | 17-27% | €10,000 EU-wide cross-border | One-Stop Shop available |
| United Kingdom | 20% | £85,000 | Post-Brexit separate regime |
| Australia | 10% GST | AUD $75,000 | Includes digital products |
| Canada (Federal) | 5% GST | CAD $30,000 | Plus provincial taxes |
| Canada (Provincial) | 5-15% | Varies by province | Quebec, BC have separate rules |
| India | 18% GST | ₹20 lakhs | Equalization levy on B2B |
| Philippines (from June 2025) | 12% | No threshold for non-residents | New 2025 implementation |
| Japan | 10% | ¥10 million | Reduced 8% for some items |
| New Zealand | 15% GST | NZD $60,000 | Includes remote services |
| Singapore | 9% GST | SGD $1 million | Increased from 8% in 2024 |
Compliance Costs and Business Impact
Tax compliance represents a significant operational burden for businesses selling digital goods and services across borders. According to research from Vertex Inc. and the European Parliament, tax compliance costs for companies based in the EU and UK generally range from 1% to 2% of annual turnover.
The European Parliament’s comprehensive study on tax compliance costs reveals significant variations by enterprise size and tax type. For corporate income tax (CIT) and VAT, private compliance costs scale with cross-border activity levels. Small and medium enterprises (SMEs) face disproportionately higher compliance burdens relative to their revenue compared to large multinational enterprises.
Key cost drivers include personnel costs (internal tax staff and external advisor fees), technology investments (tax software, ERP integrations, and e-invoicing systems), administrative burden (time spent on filing, reporting, and audit preparation), and registration and filing fees associated with multi-jurisdictional compliance.
For businesses using merchant of record platforms like Fungies.io, automated tax compliance solutions can significantly reduce these costs by handling VAT/GST calculations, collection, and remittance across multiple jurisdictions automatically. This is particularly valuable for indie game developers and SaaS companies that sell globally but lack the resources to maintain in-house tax compliance teams.
| Cost Category | Typical Range | Impact on SMEs |
|---|---|---|
| Total compliance cost | 1-2% of turnover | Higher relative burden |
| Personnel (internal) | 40-50% of compliance costs | Requires dedicated staff |
| Technology/software | 20-30% of compliance costs | Fixed costs hit harder |
| External advisors | 15-25% of compliance costs | Often necessary |
| Audit-related costs | 10-20% of compliance costs | Unpredictable spikes |
Key Players and Market Share
The tax technology market is dominated by established enterprise software providers and emerging specialized vendors. According to MarketsandMarkets and industry analysis, key players include Wolters Kluwer (leading provider of tax and accounting software with comprehensive global coverage), Thomson Reuters (major player in tax compliance and reporting solutions), and Vertex Inc. (specializes in indirect tax solutions and VAT compliance automation).
Other significant vendors include Avalara (cloud-based tax compliance platform with extensive jurisdiction coverage), H&R Block (consumer and small business tax preparation services), Intuit/TurboTax (dominant in North American consumer tax software), Sovos (focus on tax information reporting and compliance), and TaxJar (e-commerce sales tax automation, now part of Stripe).
The market is experiencing consolidation as larger players acquire specialized vendors to expand their capabilities in AI-driven tax analytics, real-time reporting, and cross-border compliance automation. Private equity investment in tax tech has accelerated, with several billion-dollar valuations achieved in 2024-2025.
Trends & Predictions (2026-2030)
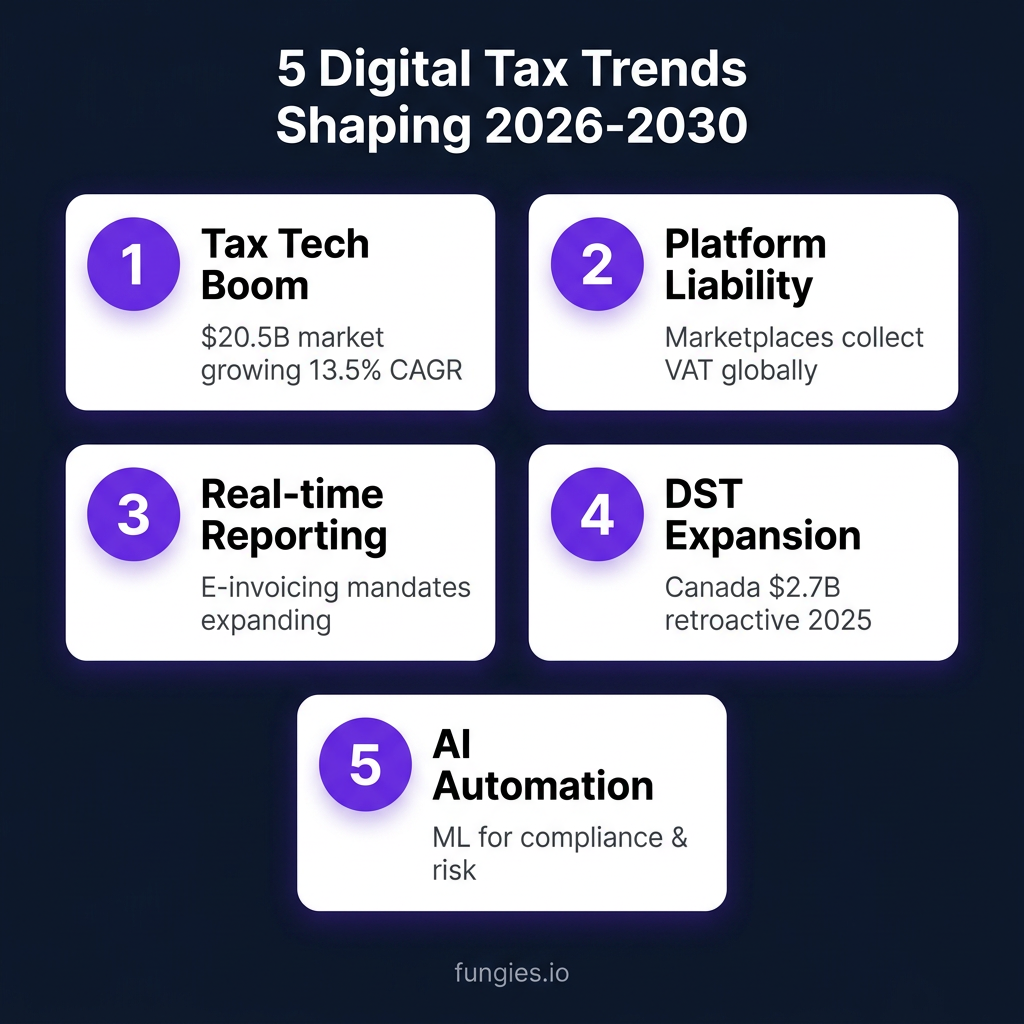
1. Accelerated Tax Technology Adoption
The tax tech market’s projected 13.50% CAGR reflects accelerating investment in automation. Businesses are increasingly adopting AI and machine learning solutions for predictive tax analytics, risk assessment, and real-time compliance monitoring. According to Precedence Research, the market will grow from $20.78 billion in 2025 to approximately $60.66 billion by 2034. The IT & Telecom sector is expected to grow at the highest CAGR during the forecast period.
2. Platform Liability Expansion
Online marketplaces and platforms are increasingly being held responsible for VAT compliance, particularly for overseas sellers. The EU’s marketplace facilitator rules have been adopted by numerous jurisdictions, requiring platforms to collect and remit VAT on behalf of third-party sellers. This trend is expanding to B2B services and digital products, fundamentally changing the compliance landscape for platform operators.
3. Real-Time Tax Reporting Mandates
E-invoicing and continuous transaction controls (CTCs) are becoming critical components of VAT compliance globally. Tax authorities now have near-instant visibility into commercial activity through real-time reporting systems. Countries implementing or expanding e-invoicing mandates include Italy (mandatory B2B), Poland (mandatory from 2026), France (expanding scope), and numerous Latin American jurisdictions including Brazil, Mexico, and Chile.
4. Digital Services Tax Expansion
Canada’s proposed Digital Services Tax would generate an estimated $2.7 billion in retroactive payments for 2025, with total projected collections of $5.3 billion by 2028. While the OECD’s Pillar One negotiations continue, more countries are considering unilateral DST measures, creating a complex patchwork of regulations for global businesses. The United States has opposed DSTs as discriminatory against American companies.
5. AI and Automation in Compliance
Robotic Process Automation (RPA), Natural Language Processing (NLP), and blockchain technologies are being integrated into tax compliance platforms. These technologies reduce manual data entry, improve accuracy, and enable predictive tax planning. The integration of generative AI for tax research and document preparation is expected to accelerate through 2026-2027.
Methodology
This report compiles data from authoritative sources including government tax authorities (HMRC, European Commission), industry associations (CCIA, OECD), and leading market research firms (MarketsandMarkets, Fortune Business Insights, Precedence Research, InsightAce Analytic). All monetary figures are presented in USD unless otherwise specified, with currency conversions applied at historical rates where necessary.
Statistics are verified against multiple sources where possible. DST revenue figures are sourced from official government budget documents and CCIA’s comprehensive tracking. Market size projections are based on analyst consensus and represent the most recent available forecasts as of Q2 2026.
Limitations include: (1) some 2024-2025 figures remain preliminary; (2) currency fluctuations may affect year-over-year comparisons; (3) market projections involve inherent uncertainty; (4) compliance cost estimates vary significantly by industry and company size.
Industry Benchmarks and KPIs
Understanding industry benchmarks is essential for businesses evaluating their tax compliance performance against peers. The following metrics represent averages and best practices observed across digital goods and SaaS companies operating in multiple jurisdictions.
Tax Filing Accuracy: Leading companies achieve 98-99% accuracy in VAT return filings, while industry averages hover around 94-96%. Errors typically stem from misclassified transactions, incorrect rate applications, and timing differences in cross-border sales recognition.
Time to File: Automated tax systems reduce filing preparation time by 60-75% compared to manual processes. Companies using modern tax technology report spending 2-3 hours per jurisdiction per quarter on VAT filings, versus 8-12 hours with manual processes.
Audit Frequency: Businesses with clean compliance histories face VAT audits every 3-5 years on average. High-risk profiles—including significant cross-border activity, frequent refund claims, or complex supply chains—may face annual audits.
Penalty Rates: Late filing penalties vary by jurisdiction but typically range from 1-10% of tax due per month. Interest charges on underpaid VAT range from 0.5% to 2% monthly. The UK charges 15% of VAT due for late registration, plus potential penalties of up to 100% for careless or deliberate errors.
| Benchmark Metric | Industry Average | Best-in-Class |
|---|---|---|
| VAT Filing Accuracy | 94-96% | 98-99% |
| Time to Prepare Quarterly Filing | 8-12 hours/jurisdiction | 2-3 hours/jurisdiction |
| Audit Frequency | Every 3-5 years | Every 5+ years |
| Compliance Cost as % of Revenue | 1.5-2.0% | 0.8-1.2% |
| Days to Respond to Tax Authority Queries | 15-30 days | 5-10 days |
Impact on Small and Medium Enterprises
The compliance burden of digital goods taxation falls disproportionately on small and medium enterprises (SMEs). While large technology companies have dedicated tax departments and sophisticated compliance infrastructure, smaller businesses often struggle with the complexity and cost of multi-jurisdictional tax compliance.
According to the European Parliament’s study on tax compliance costs, SMEs face several structural disadvantages. Fixed costs for tax software and advisory services represent a larger percentage of revenue for smaller companies. Limited internal expertise requires greater reliance on external consultants. Smaller transaction volumes make per-transaction compliance costs higher, and limited negotiating power with vendors results in less favorable pricing.
The €10,000 EU-wide threshold for cross-border B2C sales provides some relief for micro-businesses, but companies exceeding this threshold must register for VAT in all member states where they have customers—or use the One-Stop Shop system, which itself has compliance requirements.
For SaaS startups and indie game developers, the decision to sell globally must factor in tax compliance costs. A company with $500,000 in annual revenue might face $7,500-$10,000 in compliance costs (1.5-2% of revenue), which directly impacts profitability and growth capital.
Future Regulatory Landscape
The global tax landscape for digital goods continues evolving rapidly. Several key regulatory developments are expected to shape compliance requirements through 2030.
The OECD’s Pillar One negotiations aim to establish a unified approach to taxing the digital economy, potentially replacing unilateral DSTs with a coordinated framework. However, implementation has been delayed repeatedly, with the latest timeline suggesting 2026-2027 at the earliest. If implemented, Pillar One would reallocate taxing rights on profits of the largest multinational enterprises to market jurisdictions.
The EU’s VAT in the Digital Age (ViDA) proposals, expected to take effect in phases through 2026-2028, will introduce significant changes including mandatory e-invoicing for B2B transactions, digital reporting requirements, and potential changes to the place of supply rules for certain services.
The United States continues to debate federal digital goods taxation, with the Digital Goods and Services Tax Fairness Act periodically introduced in Congress. Currently, digital goods taxation remains a patchwork of state-level sales taxes with varying definitions and rates.
Frequently Asked Questions
What is the difference between VAT on digital services and Digital Services Tax (DST)?
VAT on digital services is a consumption tax applied to the sale of digital goods and services to end consumers, similar to traditional VAT on physical goods. Digital Services Tax (DST) is a separate tax on gross revenues of large digital companies, typically targeting online advertising, marketplaces, and user data monetization. DSTs generally apply to companies with global revenues exceeding €750 million.
How much do VAT compliance costs typically represent for digital businesses?
According to Vertex Inc. research, VAT compliance costs for EU and UK businesses typically range from 1% to 2% of annual turnover. For a business with $10 million in annual revenue, this translates to $100,000-$200,000 in compliance costs annually, including personnel, technology, and advisory fees.
Which countries have implemented Digital Services Taxes?
As of 2026, implemented DSTs include: United Kingdom (2%), France (3%), Italy (3%), Spain (3%), Austria (5% on advertising), Turkey (7.5%), India (2% equalization levy), Kenya (1.5%), Tanzania (2%), Nepal (2%), and Kyrgyzstan (2%). Canada has announced a DST with retroactive application to 2022. Several other countries have proposed or announced DSTs pending implementation.
What is the growth forecast for the tax technology market?
The tax technology market is projected to grow from $20.53 billion in 2025 to $72.05 billion by 2035, representing a 13.50% CAGR. Key growth drivers include increasing regulatory complexity, real-time reporting mandates, and the adoption of AI and automation in tax processes.
How are e-commerce VAT rules changing in 2025-2026?
Key changes include: (1) the Philippines implementing 12% VAT on digital services from June 2025; (2) expansion of marketplace facilitator obligations globally; (3) increasing adoption of e-invoicing mandates; (4) reduced VAT registration thresholds for cross-border digital services; and (5) enhanced information reporting requirements for payment processors.
Sources & Citations
- InsightAce Analytic – Tax Tech Market Report 2026-2035
- MarketsandMarkets – Tax Tech Market Forecast
- Fortune Business Insights – Tax Management Software Market
- Vertex Inc. – Quantifying VAT Compliance Costs
- European Commission – EU E-commerce VAT Revenue 2024
- CCIA – Status of Key Digital Services Taxes July 2025
- CEPS – Towards a European Digital Services Tax
- Statista – UK VAT Receipts
- Statista – Poland VAT Revenues
- Avalara – Global VAT and GST on Digital Services
- Tax Foundation – Digital Services Taxes in Europe 2026
- EU Tax Observatory – Digital Service Taxes
- WiseGuy Reports – Cross-Border Tax Service Market
- Forbes – Global VAT Trends 2025-2026
- Precedence Research – Tax Tech Market Analysis
- European Parliament – Tax Compliance Costs Study
- PwC – Value-Added Tax Rates by Country