SaaS Valuation Statistics 2026: Market Multiples, Data & Trends (Comprehensive Report)
The days of 20x revenue multiples for SaaS companies are firmly behind us. In 2026, the median private SaaS company trades at approximately 4.5x ARR—down from the double-digit multiples of 2021, but representing a stabilized “new normal” that investors and founders must navigate. This comprehensive report compiles data from over 2,700 M&A transactions, 100+ public SaaS companies, and industry-leading indices including the SaaS Capital Index and SEG SaaS Index. We’ve analyzed valuation multiples by company size, growth rate, geography, and AI positioning to give you the most complete picture of SaaS valuations in 2026.
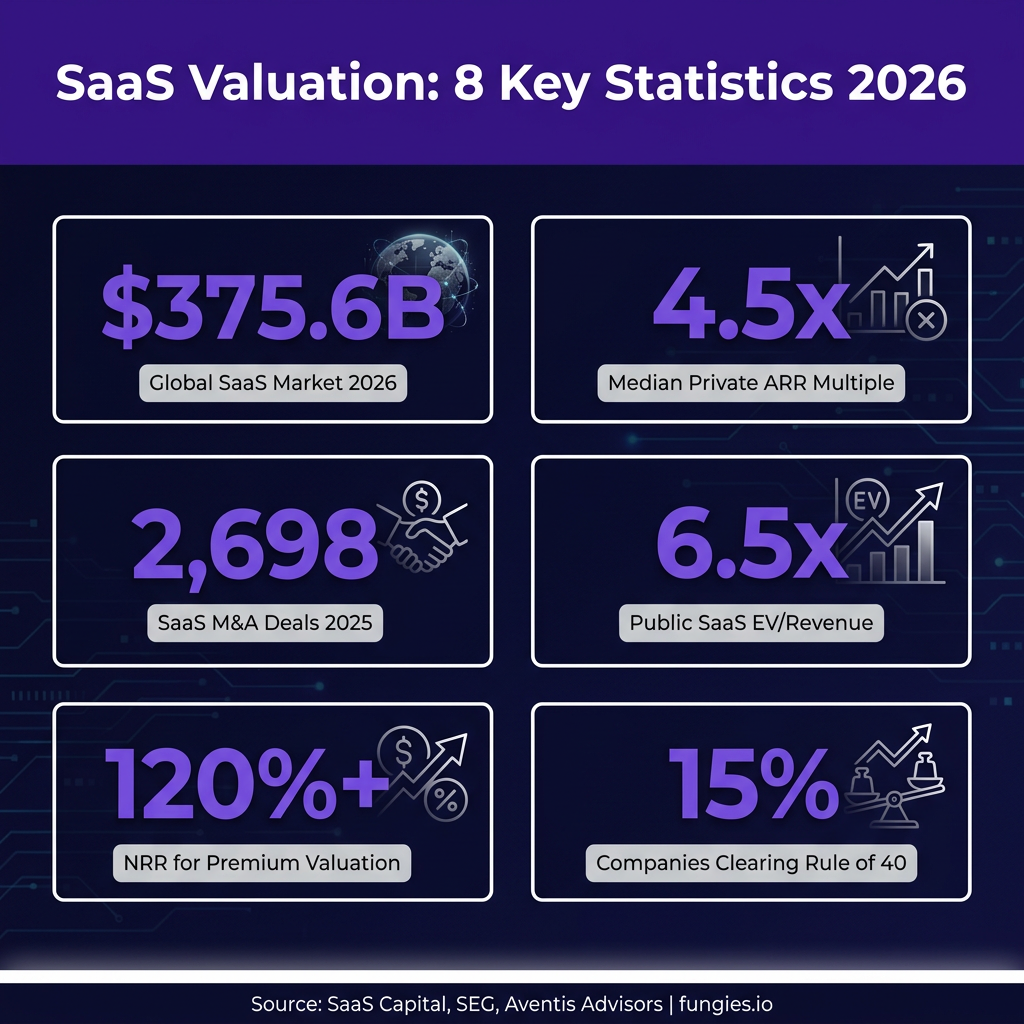
Key Statistics at a Glance
- $375.57 billion — Projected global SaaS market size for 2026 (up from $315.68 billion in 2025)
- 4.5x ARR — Median valuation multiple for private SaaS companies in the lower middle market
- 6.0x–7.0x EV/Revenue — Median multiple for public SaaS companies entering 2026
- 2,698 — Number of SaaS M&A deals completed in 2025, a 28% increase and record high
- 72% — Percentage of SaaS M&A targets in 2025 that referenced AI capabilities
- 15% — Only 8 of 55 public SaaS companies (15%) clear the Rule of 40 on an EBITDA basis
- 120%+ NRR — Net Revenue Retention threshold that commands 2–3x valuation premium
- 15–30x ARR — Valuation range for AI-native SaaS companies (vs. 3–7x for legacy SaaS)
- $2.00 — Median amount SaaS companies spend to acquire $1.00 of new ARR (up 14% since 2023)
- 3.8x — SaaS Capital Index reading as of March 2026 (down from 7.0x at start of 2025)
Market Size & Growth
The global SaaS market continues its expansion trajectory despite valuation compression. According to Fortune Business Insights, the global SaaS market was valued at $315.68 billion in 2025 and is projected to grow to $375.57 billion in 2026. This represents a compound annual growth rate (CAGR) of approximately 18.9%, demonstrating that while valuation multiples have contracted, the underlying market remains robust.
Statista’s market forecast provides additional granularity, projecting the SaaS market to reach $3.07 trillion by 2026, with growth moderating to 58.41% year-over-year—still substantial but down from the 80%+ growth rates seen in 2023–2024. The market is expected to continue expanding through 2030, reaching an estimated $5.32 trillion.
| Year | Market Size | YoY Growth | Spend per Employee |
|---|---|---|---|
| 2023 | $168.1 billion | 91.7% | $390 |
| 2024 | $213.0 billion | 80.1% | $486 |
| 2025 | $257.3 billion | 62.4% | $579 |
| 2026 | $307.4 billion | 58.4% | $682 |
| 2027 | $361.4 billion | 52.7% | $791 |
| 2030 | $532.2 billion | 36.4% | $1,121 |
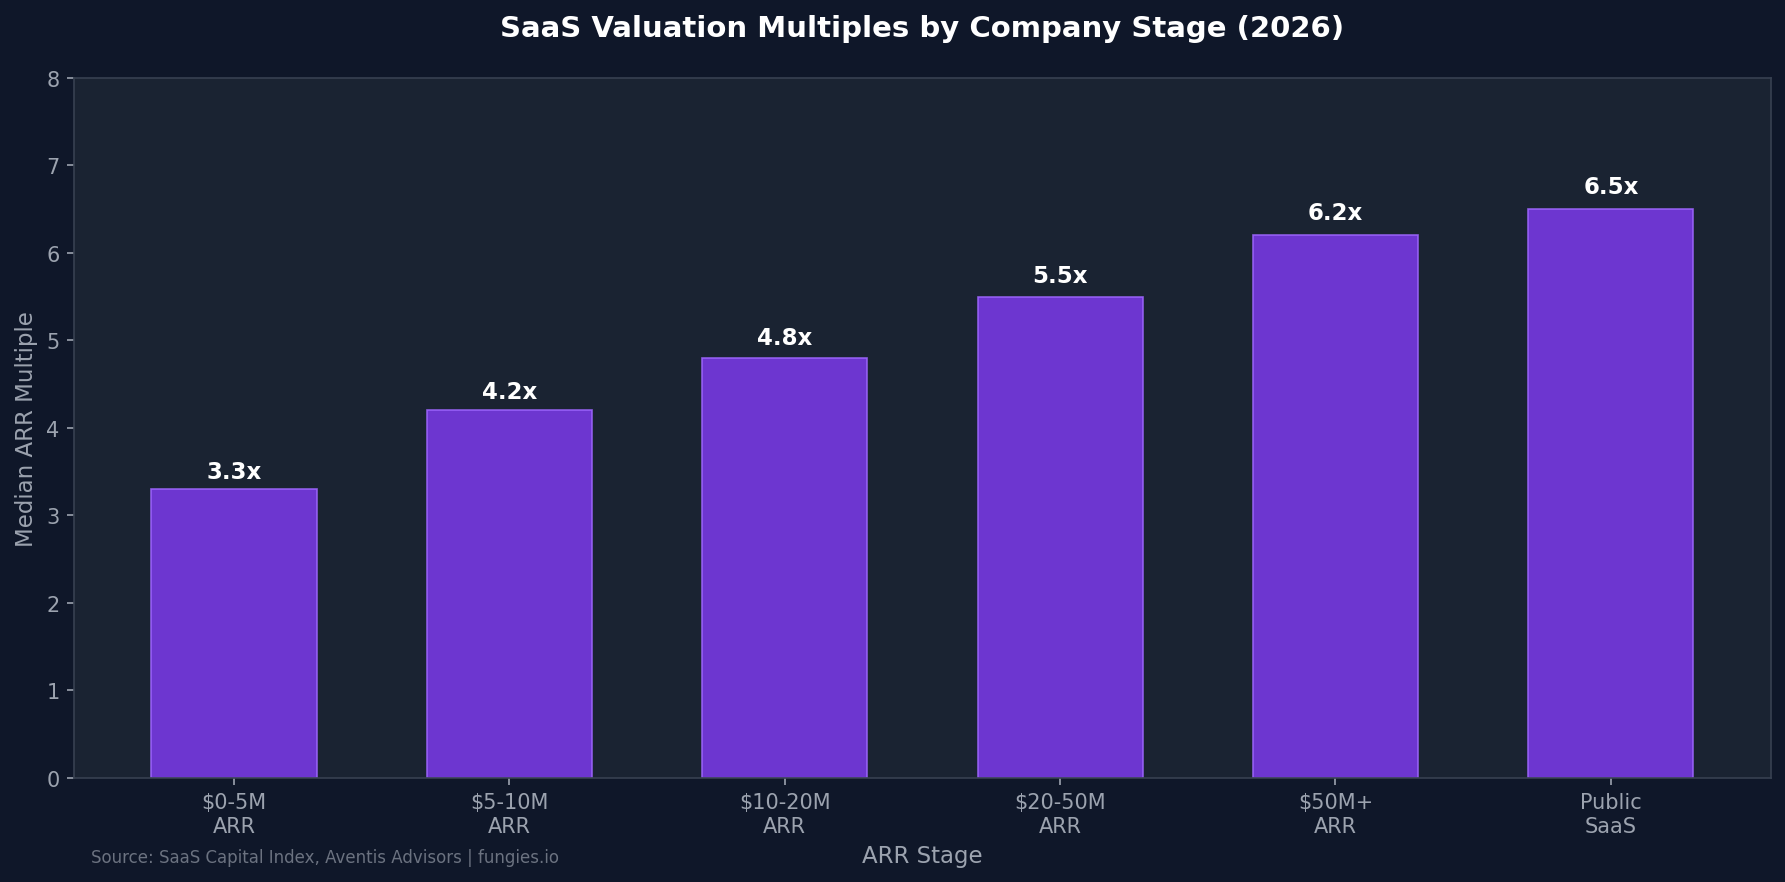
Valuation Multiples by Company Stage
Valuation multiples vary significantly based on company stage, with clear progression as ARR scales. According to data from SaaS Capital and Aventis Advisors, the relationship between ARR and valuation multiple follows a predictable pattern—larger companies command higher multiples due to reduced risk and greater market validation.
| ARR Range | Median Multiple | Top Quartile | Key Characteristics |
|---|---|---|---|
| $0–$5M | 3.3x | 5.0x+ | Early stage, higher risk, limited track record |
| $5–$10M | 4.2x | 6.0x+ | Product-market fit emerging, initial scale |
| $10–$20M | 4.8x | 7.0x+ | Proven go-to-market, repeatable sales motion |
| $20–$50M | 5.5x | 8.0x+ | Scale stage, established market position |
| $50M+ | 6.2x | 9.0x+ | Market leaders, strong competitive moats |
| Public SaaS | 6.0–7.0x | 10.0x+ | Liquidity premium, transparency, institutional ownership |
For companies in the $0–5 million ARR range, the median valuation multiple stands at 3.3x, according to SaaS Capital’s 2026 benchmarking data. This represents the entry point for institutional investment, with multiples expanding as companies demonstrate sustainable growth and retention metrics.
Regional Breakdown
Geographic location continues to influence SaaS valuations, with North American companies commanding premiums over their European and UK counterparts. According to Scale with CFO’s UK SaaS analysis, UK SaaS companies typically trade at a 15–25% discount to comparable US rounds.
| Region | Median Multiple | Premium/Discount vs. US | Notable Factors |
|---|---|---|---|
| United States | 4.8x ARR | Baseline | Deepest capital markets, highest valuations |
| UK | 4.0x ARR | -15% to -25% | SEIS/EIS incentives, smaller market |
| Europe (ex-UK) | 3.8x ARR | -20% to -30% | Fragmented markets, regulatory complexity |
| Nordics | 3.1x EV/Revenue | -35% | Viking Growth Nordic SaaS Index median |
The Viking Growth Nordic SaaS Index showed a median EV/Revenue LTM multiple of 3.1x as of early 2026, indicating minimal arbitrage between the US and Nordics has disappeared as global investors have become more selective.
Key Players & Market Share
Public SaaS companies provide the valuation ceiling for the entire sector. As of March 13, 2026, Palantir Technologies leads public SaaS companies on U.S. stock exchanges by market capitalization, with the AI-driven data analytics platform commanding premium multiples due to its government and enterprise focus.
| Category | Median EV/Revenue | Top Quartile | Gross Margin |
|---|---|---|---|
| Infrastructure SaaS | 8.5x | 15.0x+ | 75–80% |
| Vertical SaaS | 4.2x | 8.0x+ | 65–75% |
| Horizontal SaaS | 3.5x | 7.0x+ | 70–75% |
| Financial Management | 2.3x | 10.0x | 70% |
| Content Management | 2.2x | 7.6x | 72% |
| AI-Native SaaS | 12.5x | 25.0x+ | 80%+ |
According to Multiples.vc data from May 2026, public software valuations show clear segmentation across infrastructure, vertical, and horizontal categories. Infrastructure SaaS commands the highest median multiples at 8.5x EV/Revenue, reflecting the critical nature of cloud infrastructure and data services.
Industry Benchmarks: The Metrics That Drive Valuation
Understanding the operational metrics behind valuation multiples is essential for founders seeking to maximize their exit outcomes. In 2026, investors have shifted focus from pure growth to capital efficiency and retention quality.
Net Revenue Retention (NRR)
Net Revenue Retention has emerged as the single most important valuation driver. According to McKinsey analysis of more than 100 B2B SaaS companies, top-quartile performers on NRR trade at a median 24x EV/Revenue—nearly five times the 5x multiple for bottom-quartile peers.
| NRR Range | Median Valuation Multiple | Premium vs. Baseline |
|---|---|---|
| Below 100% | 3.0x | Baseline |
| 100–110% | 4.5x | +50% |
| 110–120% | 6.0x | +100% |
| Above 120% | 11.7x | +290% |
A company with 120% NRR grows its existing revenue base by 20% annually without acquiring a single new customer. This expansion revenue is structurally more valuable than new logo ARR because it comes at significantly lower acquisition cost.
Rule of 40
The Rule of 40—calculated as revenue growth rate plus EBITDA margin—remains the gold standard for SaaS valuation. According to Aventis Advisors data from May 2026, only 8 of 55 public SaaS companies (15%) clear the Rule of 40 on an EBITDA basis.
| Rule of 40 Score | Valuation Impact | % of Companies |
|---|---|---|
| Below 20 | Significant discount | 35% |
| 20–40 | Market average | 50% |
| Above 40 | Premium multiple (7–9x+) | 15% |
| Above 50 | Top quartile premium | 8% |
Customer Acquisition Cost (CAC) Benchmarks
The median B2B SaaS company now spends $2.00 to generate $1.00 in new ARR—up 14% since 2023, according to SaaS Mag’s capital efficiency analysis. Average customer acquisition costs have surged to $1,200 per customer, marking a 60% increase over five years.
| Metric | Median | Top Quartile | Benchmark Source |
|---|---|---|---|
| CAC Payback Period | 15 months | <12 months | Data-Mania 2026 |
| LTV:CAC Ratio | 3.8:1 | 4.2:1+ | SaaS Hero |
| CAC per Customer | $1,200 | <$600 | Data-Mania 2026 |
| Sales Efficiency | $2.00 per $1 ARR | <$1.50 | SaaS Mag |
Churn Rate Benchmarks
Churn rates vary dramatically by customer segment. According to ChurnBase data, enterprise SaaS selling at over $100K average contract value retains near 118% NRR on a median basis, while SMB SaaS under $25K ACV sits at 97%—a 21-point spread.
| Segment | Annual Logo Churn | Gross Revenue Retention | Net Revenue Retention |
|---|---|---|---|
| Enterprise ($100K+ ACV) | 5–8% | 90%+ | 118%+ |
| Mid-Market ($25K–$100K) | 8–12% | 88–92% | 105–115% |
| SMB (Under $25K ACV) | 15–25% | 85–88% | 95–105% |
Trends & Predictions: 5 Forces Shaping SaaS Valuations
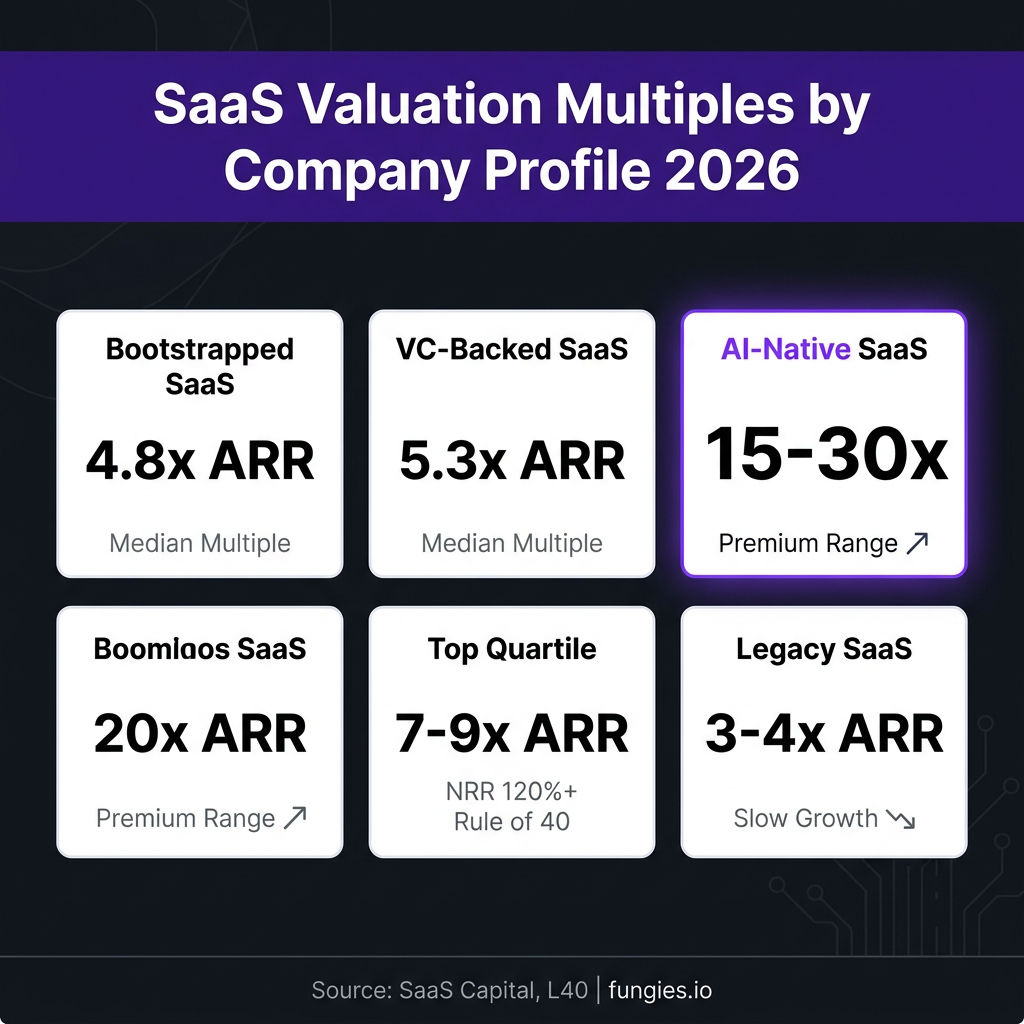
1. The AI Valuation Premium
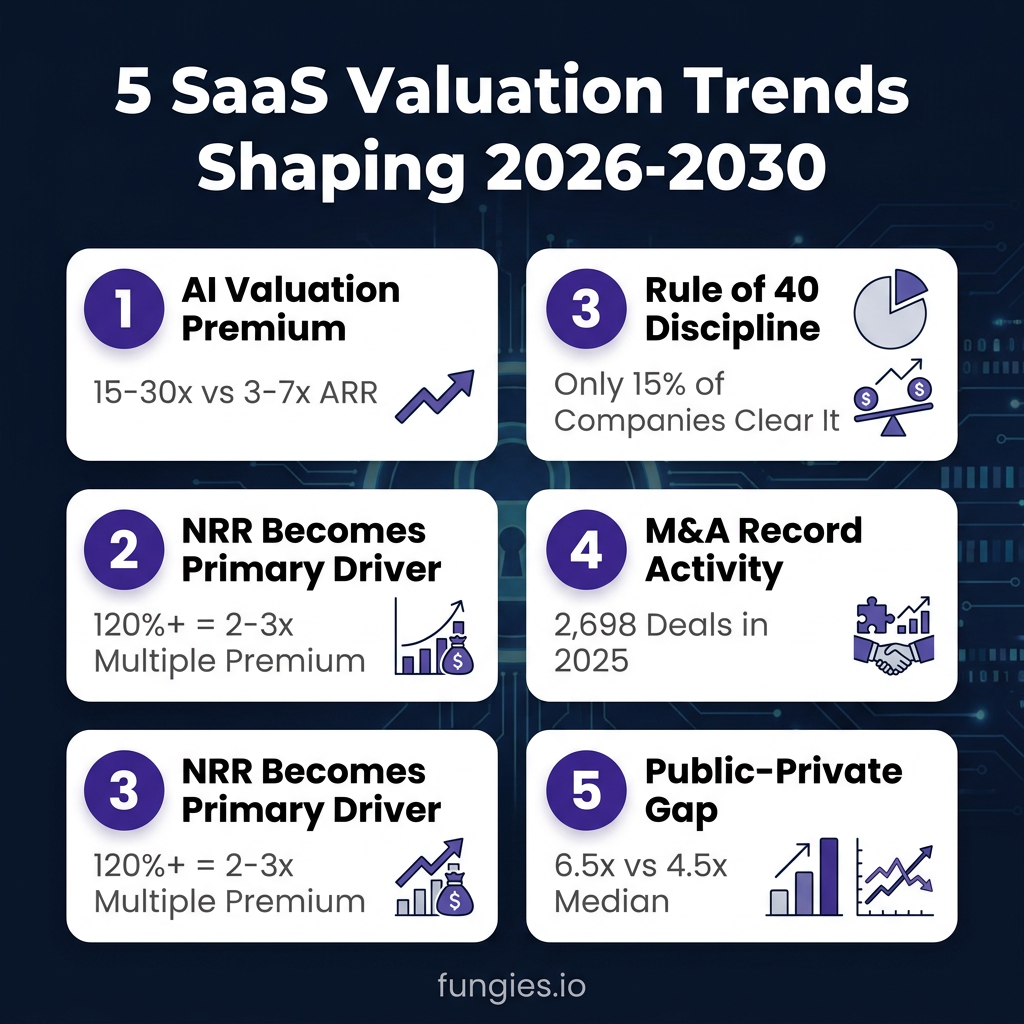
AI-native SaaS companies command 15–30x ARR multiples, with foundation models and breakout enterprise AI reaching 35–45x, according to SaaS Valuation Multiple. This compares to 3–7x for legacy SaaS in the lower-middle market—a 3–5x premium for AI positioning.
Public AI pure-plays span 10–78x EV/Revenue, with Palantir leading at the high end. According to L40°, one in five strategic buyers walked from a 2025 deal over AI exposure concerns—AI is now both a value driver and a deal-risk variable.
2. NRR as the Primary Valuation Driver
Net Revenue Retention has overtaken growth rate as the most important metric for valuation. According to Value Add VC, NRR is the single biggest valuation driver—a company with 120%+ NRR earns a 2–3x multiple premium over peers at the same growth rate.
The SaaS Library reports that companies with the highest NRR are trading at a 5x valuation premium over the lowest quartile. This shift reflects investor preference for efficient growth over growth-at-all-costs.
3. Rule of 40 Discipline
The era of “grow at all costs” is definitively over. According to BCG’s analysis, companies that can retain current customers while capturing new ones are more likely to exceed the Rule of 40 threshold. The premium for Rule of 40 compliance is most pronounced at the growth stage.
Companies scoring above 50 on the Rule of 40 while maintaining NRR above 120% are closing at 7–9x ARR in private transactions, according to Livmo—nearly double the median multiple.
4. Record M&A Activity
SaaS M&A activity reached its highest level on record in 2025. According to Software Equity Group’s 2026 Annual SaaS Report, 2,698 SaaS M&A deals closed in 2025—a 28% jump from 2024 and the highest annual count ever recorded.
SaaS M&A accounted for approximately 58% of total software M&A activity. Analytics & Data Management and Content & Workflow Management were the two most active categories, together accounting for nearly 38% of total SaaS deal volume.
5. The Public-Private Valuation Gap
Public SaaS companies continue to trade at a premium to private companies. The SaaS Capital Index shows public SaaS companies traded at a median of 6.0x to 7.0x EV/Revenue entering 2026—significantly higher than the 4.5x median for private companies.
This gap reflects the liquidity premium, transparency, and institutional governance of public markets. However, the gap has narrowed from 2021 peaks, when public SaaS traded at 16.9x versus 8–10x for private companies.
Methodology
This report compiles data from multiple authoritative sources to provide a comprehensive view of SaaS valuations in 2026. Our methodology includes:
- M&A Transaction Data: Analysis of 2,700+ SaaS M&A transactions from Software Equity Group’s 2026 Annual SaaS Report and Berkery Noyes Q1 2026 data
- Public Market Data: The SaaS Capital Index™, SEG SaaS Index™, and Multiples.vc public comps covering 100+ publicly traded SaaS companies
- Private Company Benchmarks: SaaS Capital’s annual survey of 1,000+ private B2B SaaS companies
- Valuation Research: Data from Aventis Advisors, L40°, Windsor Drake, and The VC Corner based on actual transaction data
- Market Research: Fortune Business Insights, Statista, and McKinsey market sizing data
All figures represent median values unless otherwise specified. Valuation multiples are typically expressed as EV/Revenue for public companies and ARR multiples for private companies. Data collection period spans Q4 2025 through Q2 2026.
Frequently Asked Questions
What is a good SaaS valuation multiple in 2026?
A “good” SaaS valuation multiple depends on your company’s stage and metrics. For private B2B SaaS companies, 4–6x ARR is considered market rate in 2026. Companies with NRR above 120%, Rule of 40 scores above 50, and growth above 30% can command 7–9x ARR. AI-native SaaS companies trade at 15–30x ARR premiums.
How much is a $1M ARR SaaS company worth?
Based on 2026 median private SaaS multiples of 3.8x–5.3x ARR, a $1M ARR SaaS company is typically worth $3.8M–$5.3M. The exact multiple depends on growth rate, churn, and NRR—a fast-growing company at $1M ARR could command 7–10x, while a flat-growth company might get 2–3x.
What is the Rule of 40 and why does it matter?
The Rule of 40 is calculated by adding your revenue growth rate (%) to your EBITDA margin (%). A score above 40% indicates healthy balance between growth and profitability. In 2026, only 15% of public SaaS companies clear this threshold, making it a significant differentiator for valuation premiums.
How does AI impact SaaS valuations?
AI-native SaaS companies command 15–30x ARR multiples compared to 3–7x for legacy SaaS—a 3–5x premium. However, AI is also a deal-risk variable: one in five strategic buyers walked from 2025 deals over AI exposure concerns. The market is distinguishing between AI-native companies and those merely adding AI features.
What is the most important metric for SaaS valuation?
Net Revenue Retention (NRR) has overtaken growth rate as the single most important valuation driver. Companies with 120%+ NRR earn a 2–3x multiple premium over peers at the same growth rate. NRR measures how much revenue you retain and expand from existing customers—higher NRR means more efficient growth.
Sources & Citations
- SaaS Capital — Four Early 2026 SaaS Trends
- SaaS Capital — 2026 Benchmarking Metrics for Bootstrapped SaaS
- Software Equity Group — 2026 Annual SaaS Report
- L40° — SaaS Multiples: Methods and Company Valuation in 2026
- Aventis Advisors — Rule of 40 in SaaS: 2026 Data
- Multiples.vc — Public Software Valuation Multiples May 2026
- Statista — Software as a Service Worldwide Market Forecast
- Scale with CFO — UK SaaS Valuation Multiples 2026
- Value Add VC — Why Net Revenue Retention Is the Single Biggest Driver of SaaS Multiples
- SaaS Mag — Why Net Revenue Retention Is the Defining SaaS Metric of 2026
- SaaS Mag — SaaS Consolidation Wave: 2026 M&A Trends
- ChurnBase — SaaS Churn Rate Benchmarks 2026
- Data-Mania — B2B SaaS Benchmarks 2026
- SaaS Hero — Best LTV to CAC Ratio Benchmarks for B2B SaaS in 2026
- BCG — Rule of 40 Lessons from the Top Performers in Software
- SaaS Valuation Multiple — AI SaaS Valuation Multiples 2026
- Livmo — SaaS Valuation Multiples 2026
- Ryan Allis — The SaaS M&A Report 2026
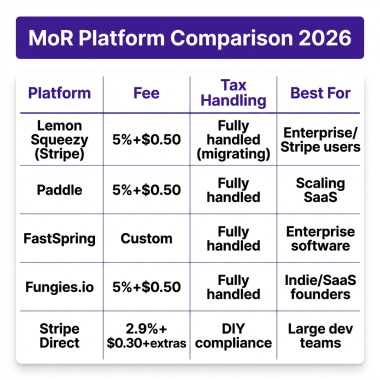
At Fungies.io, we help SaaS companies streamline their payment infrastructure so they can focus on the metrics that matter—like NRR, CAC efficiency, and sustainable growth. Our Merchant of Record platform handles global tax compliance, payment processing, and subscription management, letting founders concentrate on building valuation-driving businesses.