Digital Goods Tax Statistics 2026: Global VAT, Compliance Costs & Digital Services Tax (Comprehensive Report)
The taxation of digital goods has become one of the most complex challenges facing global businesses in 2026. With the European Union’s VAT gap reaching €128 billion and 25 U.S. states now taxing SaaS products, understanding digital tax obligations isn’t just about compliance—it’s about protecting your margins. Whether you’re selling software subscriptions, digital downloads, or online services, the regulatory landscape has shifted dramatically. This report compiles authoritative data from the European Commission, OECD, and leading tax authorities to give you the complete picture of digital goods taxation worldwide.
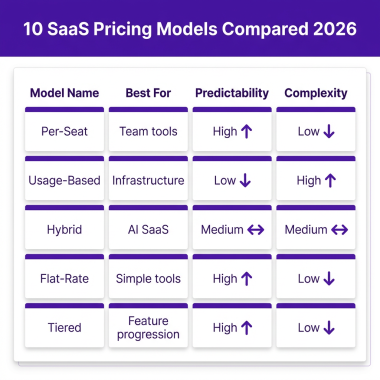
Key Statistics at a Glance
- The EU VAT compliance gap reached €128 billion in 2023, representing 9.5% of total VAT liability
- 25 U.S. states now tax SaaS in some form—a 14% increase from 2024
- France generated €680 million from Digital Services Tax in 2023, the highest in Europe
- The global indirect tax compliance software market is valued at $8.4 billion in 2025
- Hungary has the world’s highest VAT rate at 27%
- The EU’s ViDA reforms could generate an additional €18 billion annually in VAT revenue
- Over 12,000 sales tax jurisdictions exist across the United States
- Romania has the largest VAT compliance gap at 30% of total tax liability
Global Market Size & Growth
The digital tax compliance market has experienced explosive growth as businesses scramble to meet evolving regulatory requirements. According to Dataintelo, the global indirect tax compliance software market was valued at $8.4 billion in 2025 and is projected to reach $21.6 billion by 2034, expanding at a compound annual growth rate (CAGR) of 11.1%.
The broader tax management software market tells a similar story. Fortune Business Insights reports the market was valued at $20.26 billion in 2025 and is expected to grow from $22.97 billion in 2026 to $56.02 billion by 2034, exhibiting a CAGR of 11.80%. North America dominates this market with a 34.70% share in 2025, driven by complex state-level sales tax requirements.
The Tax Tech market, encompassing AI and automation solutions, is projected to reach $23 billion in 2026 and expand to $60 billion by 2033 at a 12% CAGR, according to Coherent Market Insights. This growth reflects the increasing automation of tax compliance as businesses seek to manage complexity at scale.
| Market Segment | 2025 Value | 2030/2034 Projection | CAGR | Source |
|---|---|---|---|---|
| Indirect Tax Compliance Software | $8.4 billion | $21.6 billion (2034) | 11.1% | Dataintelo |
| Tax Management Software | $20.26 billion | $56.02 billion (2034) | 11.8% | Fortune Business Insights |
| Tax Tech Market | $20.78 billion | $60.66 billion (2034) | 12.6% | Precedence Research |
| Sales Tax & VAT Compliance Software | $4.2 billion | $9.8 billion (2033) | 11.2% | LinkedIn Market Research |
The EU VAT Gap: A €128 Billion Challenge
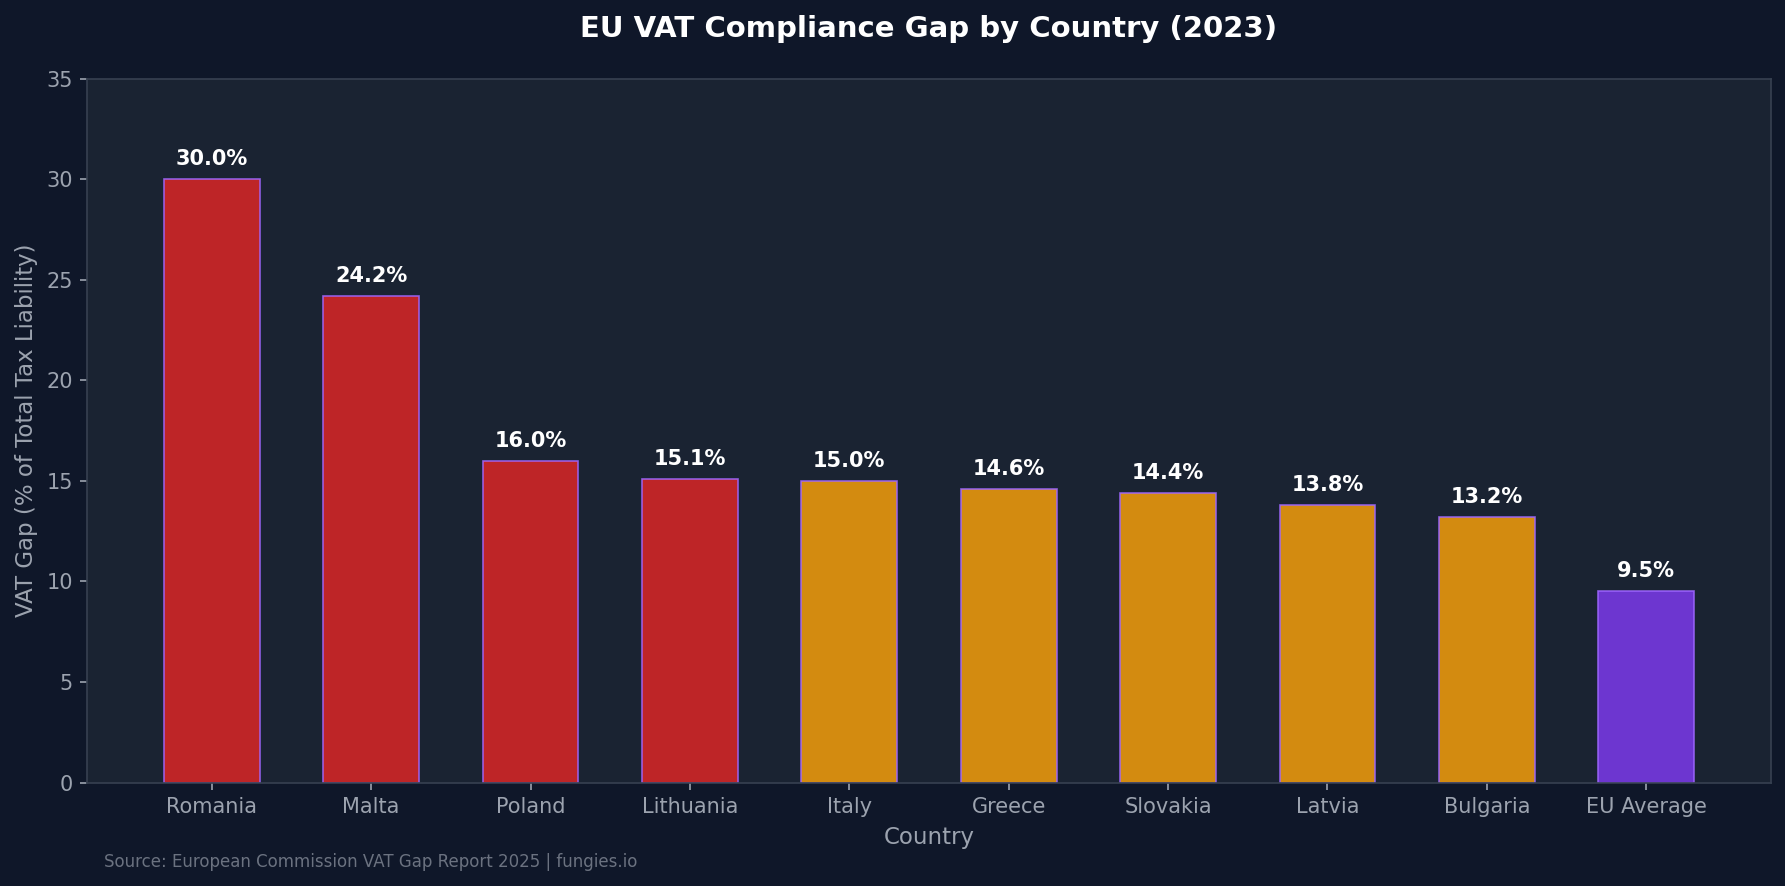
The European Commission’s VAT Gap Report 2025 reveals a stark reality: the EU lost approximately €128 billion in VAT revenue in 2023 due to non-compliance and fraud. This represents 9.5% of the total VAT tax liability—a significant increase from 7.9% (€101 billion) in 2022.
The VAT compliance gap varies dramatically across member states. Romania leads with a staggering 30% gap, followed by Malta at 24.2%, Poland at 16%, Lithuania at 15.1%, and Italy at 15%. At the other end of the spectrum, Austria maintains an impressive 1% gap, with Finland at 3% and Cyprus at 3.3%.
Beyond the compliance gap, the European Commission has introduced the concept of the VAT policy gap—revenue foregone due to reduced rates and exemptions. This actionable policy gap amounted to €773.5 billion in 2024, six times the compliance gap, highlighting the massive impact of policy choices on potential VAT revenue.
Regional Breakdown: VAT & Digital Tax Rates
VAT and GST rates on digital services vary significantly across regions, creating a complex compliance landscape for global businesses. Understanding these variations is essential for pricing strategies and margin calculations.
European Union VAT Rates (2026)
| Country | Standard VAT Rate | Reduced Rate | Digital Services Threshold |
|---|---|---|---|
| Hungary | 27% | 18% / 5% | No threshold (immediate) |
| Croatia | 25% | 13% / 5% | No threshold (immediate) |
| Denmark | 25% | None | No threshold (immediate) |
| Sweden | 25% | 12% / 6% | No threshold (immediate) |
| Germany | 19% | 7% | €10,000 EU-wide |
| France | 20% | 10% / 5.5% | €10,000 EU-wide |
| EU Average | ~21% | Varies | €10,000 cross-border |
Global VAT/GST on Digital Services
| Country/Region | Rate | Registration Threshold | Effective Date |
|---|---|---|---|
| United Kingdom | 20% VAT | £85,000 | 2015 |
| Australia | 10% GST | AUD $75,000 | 2017 |
| New Zealand | 15% GST | NZD $60,000 | 2016 |
| Canada | 5-15% (varies) | CAD $30,000 | 2021 |
| Singapore | 9% GST | SGD $1 million | 2020 |
| India | 18% GST | Immediate for foreign | 2017 |
| Japan | 10% Consumption Tax | JPY 10 million | 2015 |
Digital Services Taxes (DST) in Europe
While VAT applies broadly to digital goods and services, several European countries have implemented Digital Services Taxes (DSTs) specifically targeting large digital platforms. These taxes apply to revenue generated from digital advertising, online marketplaces, and user data monetization.
According to a 2025 CEPS report, a 5% digital services tax would have raised approximately €11.9 billion across Europe. Currently, France, Spain, Italy, Austria, Denmark, Hungary, and Poland have implemented DSTs, with others announcing plans.
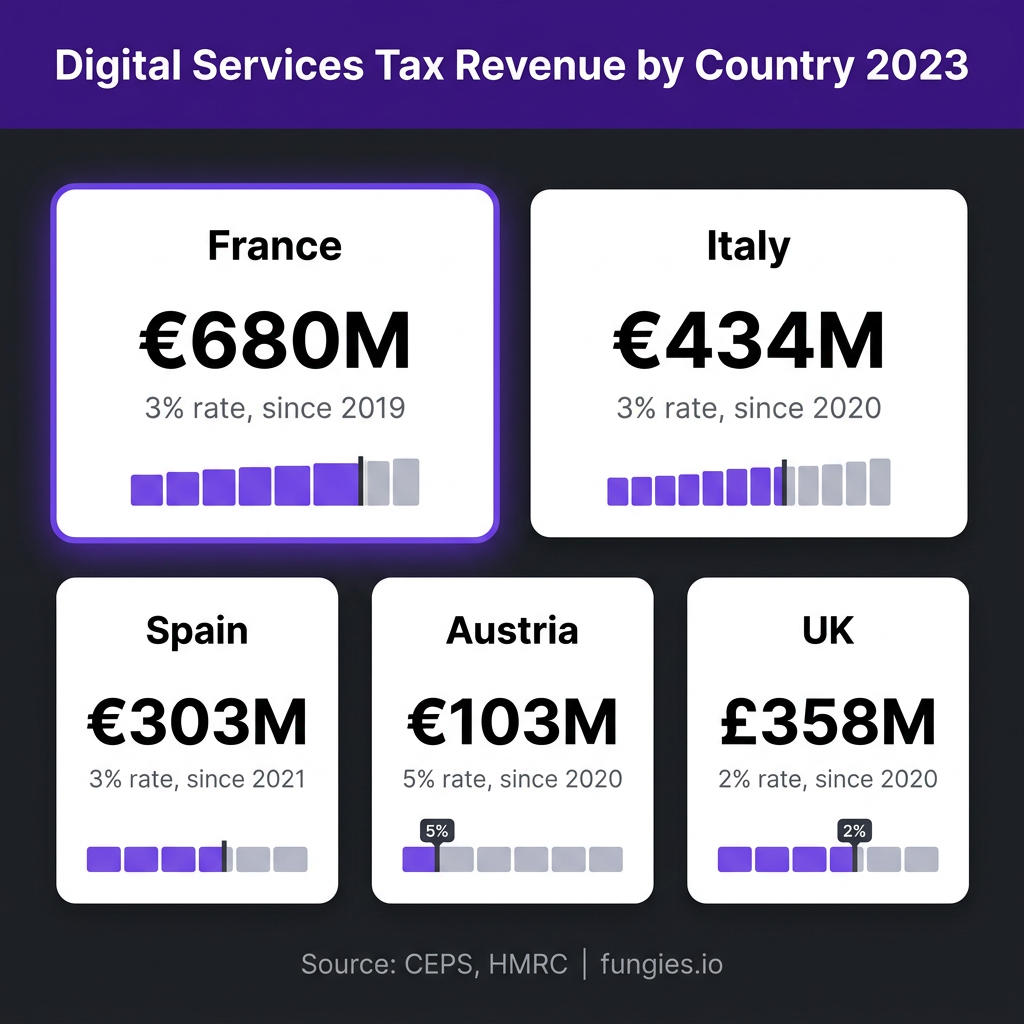
| Country | Tax Rate | Annual Revenue (2023) | Global Revenue Threshold | Domestic Revenue Threshold |
|---|---|---|---|---|
| France | 3% | €680 million | €750M | €25M |
| Italy | 3% | €434 million | €750M | €5.5M |
| Spain | 3% | €303 million | €750M | €3M |
| Austria | 5% | €103 million | €750M | €25M |
| United Kingdom | 2% | £358 million | £500M | £25M |
France’s DST, implemented in January 2019, targets suppliers of digital interfaces and advertising services based on user data. Italy’s tax, effective since January 2020, covers online advertising, multisided digital interfaces, and data transmission services. Spain followed in January 2021 with a similar 3% rate on online advertising, intermediary services, and data transmission.
U.S. Sales Tax on Digital Goods
The United States presents a uniquely complex environment for digital goods taxation. Unlike the EU’s harmonized VAT system, the U.S. has over 12,000 sales tax jurisdictions across 45 states plus Washington D.C., each with its own rules and rates.
According to Anrok’s 2025 research, SaaS is now taxable in 25 U.S. jurisdictions—a 14% increase from 22 jurisdictions at the beginning of 2024. This means approximately 50% of U.S. states now tax SaaS in some form, making compliance tracking increasingly complex for B2B software companies.
Vertex Inc.’s 2025 End-of-Year U.S. Sales Tax Rates and Rules Report tracked 12,414 tax jurisdiction changes in 2025, revealing one of the most active and complex years in more than a decade. The report notes the first increase in average state sales tax rates in three years as jurisdictions address budget shortfalls.
| State | SaaS Taxable? | State Rate | Notes |
|---|---|---|---|
| California | No | 7.25% | Software generally exempt |
| New York | Yes | 4% | Taxable as software |
| Texas | Yes | 6.25% | Taxable as data processing |
| Washington | Yes | 6.5% | Digital products taxable |
| Florida | No | 6% | Custom software exempt |
| Illinois | Yes | 6.25% | Taxable since 2021 |
| Louisiana | Yes | 4.45% | Expanded Jan 2025 |
Compliance Costs & Burden
Tax compliance represents a significant cost burden for businesses of all sizes. According to the National Taxpayers Union Foundation, U.S. taxpayers will spend nearly 6.93 billion hours complying with the federal tax code for the 2026 filing season, representing more than $477 billion in total compliance burdens.
For small and medium businesses (SMBs), the burden is disproportionately heavy. Avalara research shows that SMBs devote significantly more time to compliance tasks than large enterprises:
- 3 additional hours monthly identifying sales tax obligations
- 5.7 additional hours on tax rates and calculations
- 6.6 additional hours on exemption certificate management
- 7.8 additional hours on consumer use tax
- 8.7 additional hours on tax returns preparation
The Tax Foundation’s survey of multinational enterprises found that companies reported a weighted average increase of 32% in compliance costs from 2017 to 2023, with 43% of federal income tax compliance costs attributed to rules relating to foreign-source income.
Key Trends Shaping 2026-2030
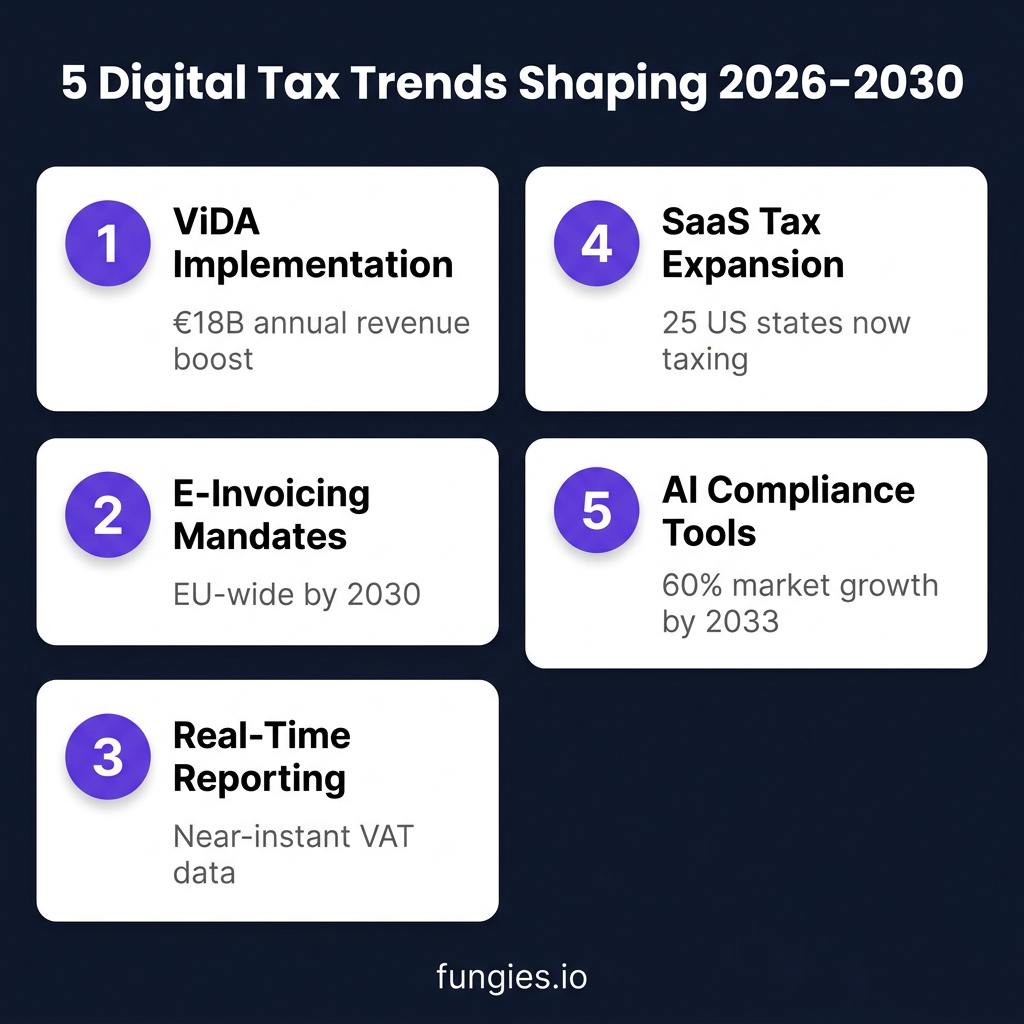
1. ViDA Implementation
The EU’s VAT in the Digital Age (ViDA) package, adopted by the Council on March 11, 2025, represents the most significant overhaul of EU VAT rules in decades. Key actions under ViDA will help EU countries collect up to €18 billion more in VAT revenues annually, with €11 billion coming from anti-fraud measures alone. The reforms include digital reporting requirements, platform economy adjustments, and a uniform €10,000 threshold for cross-border digital sales.
2. E-Invoicing Mandates
2026 marks a turning point for mandatory e-invoicing across Europe. Belgium launched mandatory B2B e-invoicing on January 1, 2026, using the Peppol network. France will require e-invoicing for large companies from September 2026, with all businesses covered by 2027. Poland’s B2B mandate takes effect February 2026. By 2030, ViDA will standardize digital reporting across all 27 member states.
3. Real-Time Reporting
Tax authorities are moving toward near real-time data collection. As Bloomberg Tax reports, “As tax authorities gain access to granular, near real-time data, there will be more scrutiny of all tax positions, not just VAT—this is a game-changer.” The digitalization of tax is transforming compliance from periodic filing to continuous monitoring.
4. SaaS Tax Expansion
The trend toward taxing digital services continues unabated. With 25 U.S. states now taxing SaaS and more considering similar measures, software companies face an ever-expanding compliance footprint. Louisiana enacted changes in January 2025 expanding sales tax to include SaaS, digital products, and information services.
5. AI-Powered Compliance Tools
The Tax Tech market is embracing AI and machine learning to manage complexity. With the market projected to reach $60 billion by 2033, businesses are investing heavily in automated solutions. According to MarketsandMarkets, the tax tech market is growing owing to increased demand for effective tax technology solutions across financial services, retail, eCommerce, and IT sectors.
Industry Benchmarks & KPIs
| Metric | Benchmark | Source |
|---|---|---|
| Average EU VAT Gap | 9.5% | European Commission 2025 |
| Best-in-Class VAT Gap (Austria) | 1.0% | European Commission 2025 |
| Worst VAT Gap (Romania) | 30.0% | European Commission 2025 |
| U.S. States Taxing SaaS | 25 states (50%) | Anrok 2025 |
| Tax Jurisdiction Changes (2025) | 12,414 | Vertex Inc. |
| Compliance Cost Increase (2017-2023) | 32% | Tax Foundation |
| Tax Compliance Hours (U.S.) | 6.93 billion | NTUF |
| Total Compliance Burden (U.S.) | $477 billion | NTUF |
Methodology
This report synthesizes data from authoritative sources including the European Commission’s VAT Gap Report 2025, the OECD’s tax policy databases, national tax authorities, and leading market research firms. Statistics are drawn from official publications, peer-reviewed studies, and verified industry reports published between 2024 and 2026.
VAT gap figures represent the difference between expected VAT revenue and actual collections, as calculated by the European Commission using the top-down approach. DST revenue figures are sourced from national finance ministries and the Centre for European Policy Studies (CEPS). Market size projections are based on analyst consensus from multiple research firms.
Data limitations include varying fiscal years across jurisdictions, differences in VAT calculation methodologies, and the evolving nature of digital tax regulations. Readers should verify current rates and thresholds with local tax authorities before making compliance decisions.
Frequently Asked Questions
What is the difference between VAT on digital services and Digital Services Tax (DST)?
VAT on digital services is a broad consumption tax applied to virtually every digital sale in Europe, typically ranging from 19-27%. Digital Services Tax (DST) is a separate revenue levy targeting large online platforms with global revenues exceeding €750 million. While VAT applies to all sellers, DST only affects major digital platforms like Google, Amazon, and Meta.
Do U.S. SaaS companies need to collect VAT when selling to EU customers?
Yes. Non-EU businesses selling digital services to EU consumers must collect VAT at the customer’s local rate from the first sale. The EU’s One-Stop Shop (OSS) system allows businesses to register in one member state and report all EU sales through a single return, simplifying compliance across 27 countries.
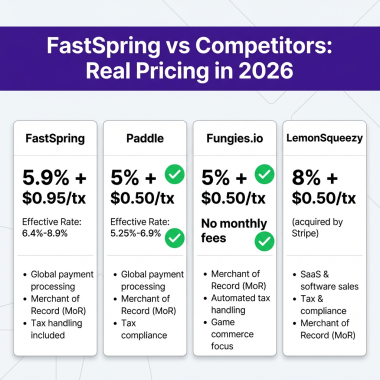
How much does VAT compliance software cost?
Costs vary based on transaction volume and complexity. Small businesses might pay $50-200 monthly for basic solutions, while enterprise platforms handling millions of transactions can cost $10,000+ monthly. The global indirect tax compliance software market, valued at $8.4 billion in 2025, reflects significant investment in automated solutions.
Which EU country has the highest VAT rate?
Hungary has the highest standard VAT rate in the European Union at 27%, followed by Croatia, Denmark, and Sweden at 25%. The EU average standard rate is approximately 21%, though reduced rates apply to certain categories of goods and services in most member states.
What is the EU doing to reduce the VAT gap?
The EU’s VAT in the Digital Age (ViDA) package aims to close the €128 billion gap through digital reporting requirements, real-time transaction monitoring, and enhanced cooperation between member states. The reforms are expected to generate €18 billion in additional annual revenue, with €11 billion specifically from anti-fraud measures.
Sources & Citations
- European Commission. (2025). VAT Gap in Europe Report 2025. https://taxation-customs.ec.europa.eu/taxation/vat/fight-against-vat-fraud/vat-gap_en
- Centre for European Policy Studies (CEPS). (2025). Towards a European Digital Services Tax. https://cdn.ceps.eu/wp-content/uploads/2025/04/2025_04_FMI-Toward-a-European-digital-tax-1-1.pdf
- Dataintelo. (2025). Indirect Tax Compliance Software Market Research Report 2034. https://dataintelo.com/report/indirect-tax-compliance-software-market
- Fortune Business Insights. (2025). Tax Management Software Market Size, Share & Growth 2034. https://www.fortunebusinessinsights.com/tax-management-software-market-102631
- Anrok. (2025). 6 Sales Tax Statistics to Know Going Into 2026. https://www.anrok.com/resources/sales-tax-statistics
- Vertex Inc. (2025). 2025 End-of-Year U.S. Sales Tax Rates and Rules Report. https://www.vertexinc.com/company/news/latest-news/vertex-report-us-sees-record-level-growth-sales-tax-rates-and-rules-changes-2025-amid-fiscal
- Coherent Market Insights. (2026). Tax Tech Market Size and Share Analysis 2033. https://www.coherentmarketinsights.com/industry-reports/tax-tech-market
- National Taxpayers Union Foundation. (2025). The Hidden Cost of the Tax Code: 6.93 Billion Hours and More Than $477 Billion in Total Compliance Burdens. https://www.ntu.org/foundation/detail/the-hidden-cost-of-the-tax-code-693-billion-hours-and-more-than-477-billion-in-total-compliance-burdens
- Tax Foundation. (2025). EU VAT Compliance Gap Analysis. https://taxfoundation.org/blog/eu-vat-revenue-compliance
- European Commission. (2025). VAT in the Digital Age (ViDA). https://taxation-customs.ec.europa.eu/taxation/vat/vat-digital-age-vida_en
- Avalara. (2026). Global VAT and GST on Digital Services. https://www.avalara.com/us/en/vatlive/global-vat-gst-on-e-services.html
- PwC. (2026). Value-added Tax (VAT) Rates by Country. https://taxsummaries.pwc.com/quick-charts/value-added-tax-vat-rates
- Marosa VAT. (2026). E-invoicing B2B and B2G in Europe Overview. https://marosavat.com/resources/e-invoicing-in-europe-overview-and-dates
- Precedence Research. (2025). Tax Tech Market Size to Hit USD 60.66 Billion by 2034. https://www.precedenceresearch.com/tax-tech-market
- MarketsandMarkets. (2024). Tax Tech Market Report 2024. https://www.marketsandmarkets.com/Market-Reports/tax-tech-market-28373824.html