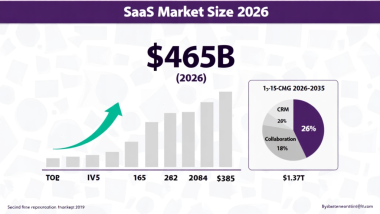
Seven out of ten people who start your checkout never finish it. That’s not a traffic problem. That’s not a pricing problem. That’s a checkout problem — and it’s costing you 70% of your potential revenue.
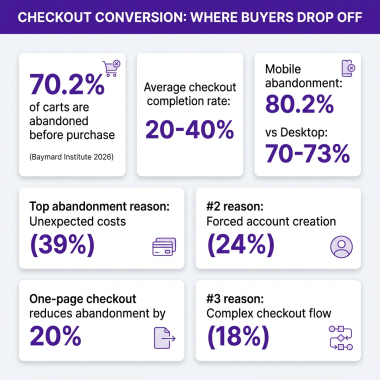
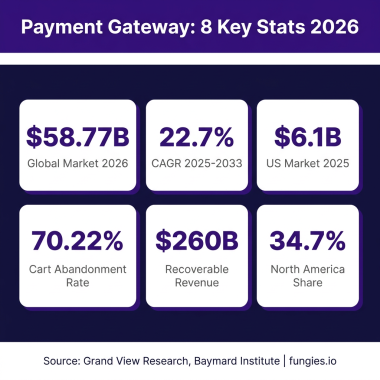
In 2026, the average cart abandonment rate is 70.22% (Baymard Institute, across 50 studies). For mobile, it jumps to 80.2%. Meanwhile, the best-performing digital product sellers are hitting 5–8% checkout conversion rates — three times what a basic Stripe redirect setup delivers.
The difference isn’t luck. It’s a set of specific, measurable checkout optimizations that eliminate friction, build trust, and get buyers across the finish line. This guide covers exactly what they are, with data on what each one actually moves the needle by.
Why Digital Product Checkout Is Broken (By the Numbers)
Before we get into fixes, let’s understand where buyers are actually dropping off. Most checkout abandonments fall into predictable categories:
- 39% leave because of unexpected costs (fees, taxes, shipping shown too late)
- 24% abandon when forced to create an account before purchase
- 18% cite a checkout process that’s too long or complicated
- 17% don’t trust the site with their card details
- 13% can’t find their preferred payment method
Here’s what’s frustrating: four of these five are 100% fixable with product decisions. You’re not losing buyers to your competition — you’re losing them to your own checkout form.

The checkout completion rate — buyers who start checkout and actually finish it — averages between 20% and 40% for most ecommerce and digital product stores. The gap between 20% and 40% is the optimization opportunity. Closing it doesn’t require more ad spend. It requires fixing the right things in the right order.
Fix 1: Kill the Forced Account Wall
This is the most damaging pattern in digital product sales. You’ve convinced someone to buy. They click “Checkout.” Then you ask them to create an account, verify their email, and come back.
You’ve lost them. Studies consistently show that 24% of shoppers abandon checkout when forced to register. For digital products priced under $50 — impulse buy territory — that number is even higher.
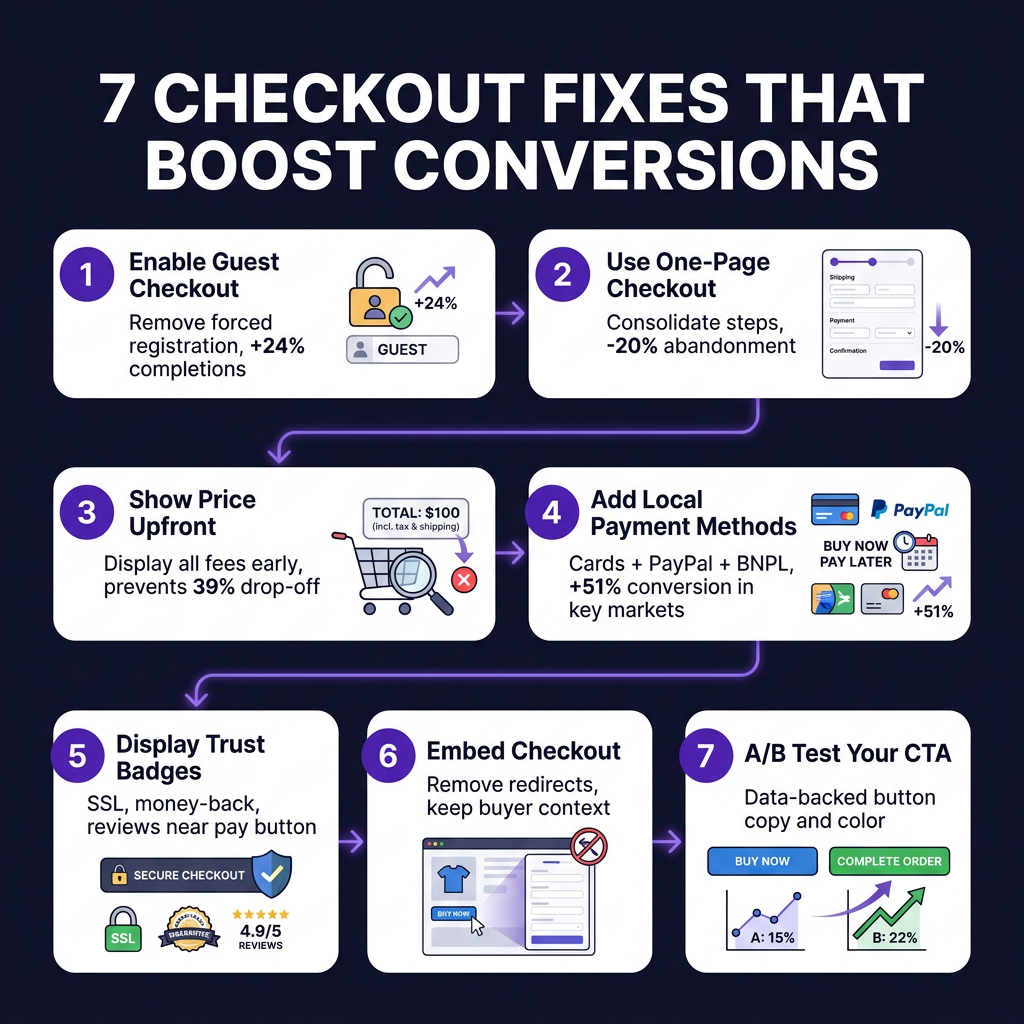
The fix: offer guest checkout as your primary path. Invite account creation after purchase, when you already have the sale. Frame it as a benefit (“Create an account to access your purchases anytime”) rather than a gate.
Tools like Fungies, Gumroad, and ThriveCart handle this correctly by default. If you’re building on Stripe directly, you’ll need to architect this yourself — most teams forget that the account registration step adds 60–90 seconds of friction in a flow where seconds matter.
Fix 2: Show Every Cost Upfront
The single biggest reason buyers abandon checkout is unexpected costs. Not high costs — unexpected costs. The psychological impact of seeing a $15 price jump to $18.50 at checkout is disproportionate to the dollar difference. It breaks trust. It creates doubt. The buyer starts wondering what else they weren’t told.
The solution is radical transparency:
- Show the final price (including tax) on the product page, or at least show an estimate
- If you handle taxes via a Merchant of Record like Fungies or Paddle, display the tax calculation before the final step — not on it
- Never add processing fees at the last step — either absorb them or price them in from the start
This is one area where MoR platforms have a structural advantage. When your payment provider handles tax as part of the sale, buyers in Germany see the €8 VAT-inclusive price before they ever click “Pay.” No surprises, no drop-off.
Fix 3: Consolidate to One Page (or as Close as Possible)
Research from multiple A/B testing studies shows that one-page checkout reduces abandonment by ~20% on average compared to multi-step flows. Shopify’s data from their own one-page checkout rollout confirmed a 7.5% conversion improvement over their previous three-step flow.
Why? Progress anxiety. When buyers can see three or four steps ahead of them, they calculate the effort and decide it’s not worth it. When everything is on one scrollable page, the checkout feels fast — even if it isn’t technically shorter.
For SaaS and digital products, the minimum viable one-page checkout contains:
- Email field (pre-populated if logged in)
- Payment method selector
- Card/wallet input
- Order summary sidebar
- Single “Pay Now” button
That’s it. Every extra field you add decreases conversion. Baymard Institute found that the average checkout contains 14.88 form fields — but most can be reduced to 7–8 without losing any required data. That reduction alone can improve completion rates by 20–60%.
Fix 4: Add Local Payment Methods (The 51% Conversion Lift)
If you’re only accepting credit cards, you’re excluding a significant percentage of buyers in key markets. Payment preferences vary dramatically by region:
| Region | Preferred Method | Card Usage |
|---|---|---|
| United States | Credit/Debit Card | 57% |
| Germany | PayPal, SEPA | 16% |
| Netherlands | iDEAL | ~20% |
| Brazil | Boleto, PIX | <40% |
| Southeast Asia | Digital wallets, local rails | ~30% |
| India | UPI, net banking | <35% |
The data on the impact is striking. Paddle’s own analysis of localized vs non-localized checkouts showed up to 51% higher conversion rates in markets where local payment methods were enabled. That’s not a marginal improvement — that’s the difference between a business that scales internationally and one that doesn’t.
For most SaaS founders, setting this up manually means integrating with Stripe, then adding PayPal, then figuring out iDEAL and SEPA separately, then debugging tax rules for each market. It’s months of engineering work.
The MoR shortcut: platforms like Fungies, Paddle, and Dodo Payments handle 50–100+ local payment methods out of the box. You get the conversion lift without building the infrastructure.
Fix 5: Embed the Checkout (Stop Redirecting)
Every redirect is a conversion risk. When a buyer clicks “Buy” and gets sent to a new domain — even a trusted one like Stripe’s hosted checkout or Gumroad’s payment page — a percentage of them never come back. Browser trust warnings, visual inconsistency, and the simple act of leaving a page all contribute to drop-off.
Embedded checkout keeps the buyer in your product context. They never leave your page. The payment form appears inline, the order summary stays visible, and the trust they’ve built with your brand extends through to the payment step.
The data on embedded vs redirect is consistent: embedded checkout typically sees 15–25% higher completion rates in head-to-head tests. For SaaS products specifically, where the buyer is already inside your app or on your landing page, keeping them there is even more valuable.
Fungies offers a fully embedded checkout widget that you can drop into any page with a few lines of JavaScript. Same for Paddle Billing’s overlay checkout. Neither requires you to handle PCI compliance directly — the MoR handles that.
Fix 6: Trust Signals — Where and What
Trust badges matter, but placement matters more than presence. A security badge buried in the footer is worthless. A money-back guarantee shown immediately above the “Pay Now” button addresses the exact hesitation buyers feel at that moment.
What works at checkout:
- SSL/security indicators near the payment field (not just in the URL bar)
- Money-back guarantee badge immediately adjacent to the CTA button
- Customer review count (“Trusted by 14,000+ creators”) in the order summary
- Recognized payment logos (Visa, Mastercard, PayPal, Apple Pay) displayed as available methods
- No-spam assurance for the email field (“We’ll only email you your receipt”)
A study by Conversion Rate Experts found that adding a specific, relevant guarantee near the checkout button lifted conversions by 32.5% in one test. The guarantee itself wasn’t new — it just moved to where buyers were looking.
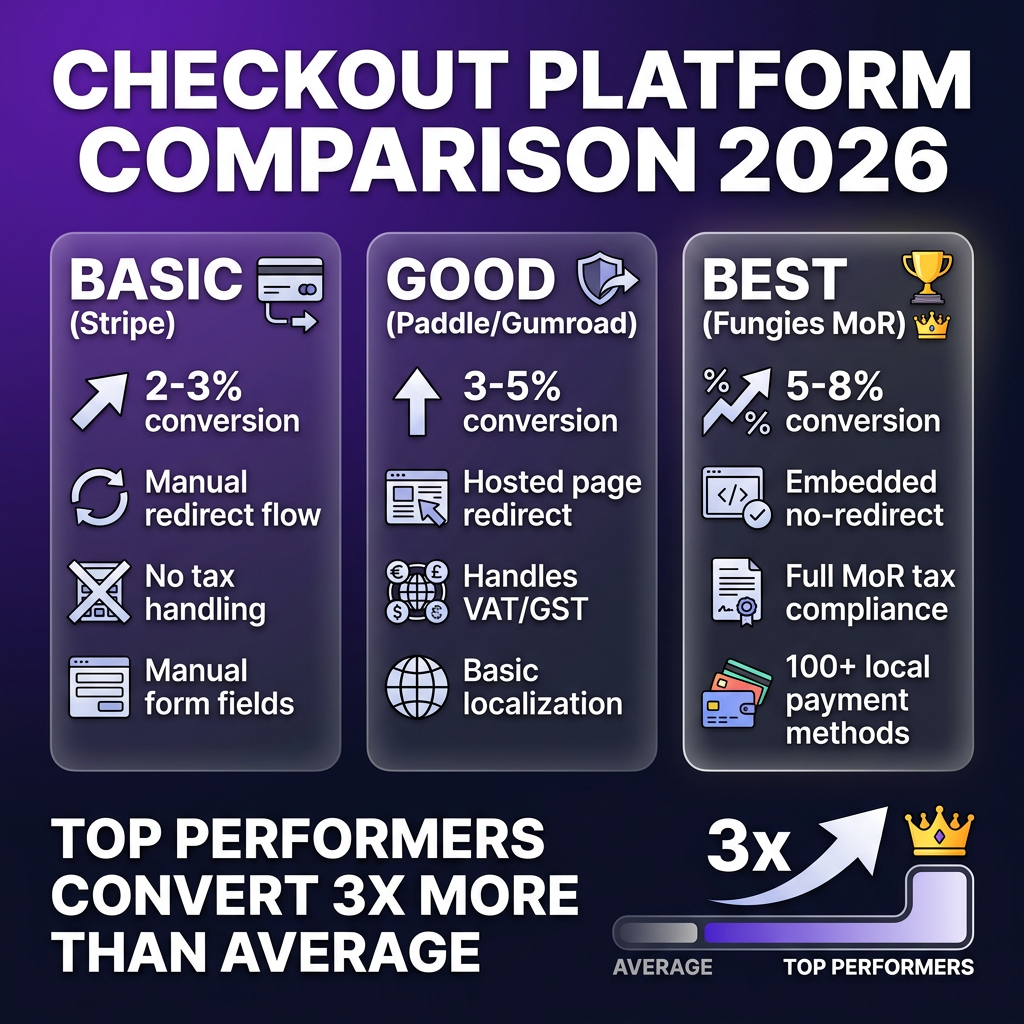
Checkout Optimization Comparison: Basic vs Optimized vs MoR
| Feature | Basic Stripe | Hosted (Paddle/Gumroad) | Embedded MoR (Fungies) |
|---|---|---|---|
| Typical conversion rate | 2–3% | 3–5% | 5–8% |
| Guest checkout | Manual setup | ✅ Default | ✅ Default |
| One-page checkout | Manual build | ✅ Hosted page | ✅ Inline embed |
| Price transparency | Manual | Partial | ✅ Tax-inclusive display |
| Local payment methods | Add-on (complex) | 40–60 methods | 100+ methods |
| Embedded (no redirect) | ❌ Redirects to Stripe | ❌ Redirects to hosted | ✅ Inline widget |
| Tax handling | Manual / TaxJar | VAT + sales tax | Global MoR compliance |
| A/B testing built-in | ❌ | Limited | ✅ |
Fix 7: A/B Test Like You Mean It
Most founders treat their checkout as a finished product. It’s not. It’s a hypothesis. Every element — button copy, button color, form layout, price display, trust badge placement — should be tested.
The highest-ROI checkout A/B tests for digital products in 2026:
- CTA button copy: “Buy Now” vs “Get Instant Access” vs “Start Today” — the latter often outperforms because it reduces commitment anxiety
- Price framing: “$97/year” vs “$8.08/month (billed annually)” — the monthly equivalent can improve conversions by 15–30% for annual plans
- Order bump placement: Add-ons shown above the payment field convert better than those shown below
- Progress indicators: In multi-step checkouts, progress bars improve completion even when they slow the process slightly
- Urgency elements: “X copies sold today” or time-limited discounts — work best when genuine, backfire when fake
Tools like Google Optimize’s successor, VWO, or built-in testing in platforms like ThriveCart make running these tests accessible without an engineering team.
Fix 8: Optimize for Mobile (Where 80% of Abandonment Happens)
Mobile abandonment at 80.2% isn’t a device problem — it’s a UX problem. Mobile checkout that was designed on a desktop becomes a nightmare of tiny tap targets, form fields that trigger the wrong keyboard, and payment flows that require constant zooming.
Mobile checkout non-negotiables in 2026:
| Element | Desktop | Mobile Must-Have |
|---|---|---|
| Payment input | Card form | Apple Pay / Google Pay as primary option |
| Form fields | Standard layout | Large tap targets, correct keyboard types |
| Autofill | Nice-to-have | Critical — browser autofill support required |
| CTA button | Any position | Sticky bottom, thumb-reachable |
| Order summary | Sidebar | Collapsible, doesn’t dominate viewport |
Apple Pay and Google Pay deserve special attention: they convert 50% better than typed card entry on mobile (Shopify data). They eliminate form friction entirely — the buyer authenticates with their face or fingerprint and the payment completes. If your checkout doesn’t support wallet payments, you’re leaving half your mobile conversions on the table.
Key Takeaways
- 70.22% of carts are abandoned — this is recoverable revenue, not lost buyers. Fix your flow and you get it back.
- Remove the account wall. Guest checkout is a revenue feature, not a compromise. Add account creation post-purchase.
- Show every cost upfront. Unexpected fees at checkout kill trust and conversions. Price transparency pays for itself.
- Embed the checkout. Redirects lose buyers. An inline checkout widget keeps your brand context intact through the payment step.
- Local payment methods are not optional. Cards are barely 16% of payments in Germany. If you sell internationally, you need local rails — or a MoR that provides them.
- Mobile needs wallet payments. Apple Pay and Google Pay convert 50% better than card forms on mobile. Enable them or lose those buyers.
FAQ
What’s the average checkout conversion rate for digital products in 2026?
Most digital product sellers see overall site conversion rates of 2–4%. Checkout-specific completion rates (buyers who start checkout) range from 20–40%. The gap between average and top performers is significant: optimized checkouts with local payments, embedded flows, and guest checkout regularly hit 5–8% overall conversion.
Does an embedded checkout actually convert better than a hosted redirect?
Yes, consistently. Embedded checkouts that keep buyers on your page outperform redirect-to-hosted flows by 15–25% in most A/B tests. The primary reason is trust continuity: buyers are already on your domain and brand, and an inline form maintains that context rather than breaking it with an external redirect.
How much does adding local payment methods increase conversions?
Paddle’s data shows up to 51% higher conversion rates in markets where local payment methods match buyer preferences. In Germany (where PayPal and SEPA dominate), offering only credit cards can reduce your addressable market by over 80%. The ROI on adding local payment support via a MoR is typically immediate in international markets.
Should I build these optimizations myself on Stripe, or use a platform like Fungies or Paddle?
For a solo founder or small team, building a fully optimized checkout on Stripe — with embedded form, local payment methods, tax display, and mobile optimization — requires significant engineering time. Platforms like Fungies or Paddle deliver most of these optimizations out of the box, including global tax compliance. If you have the engineering bandwidth and specific customization needs, Stripe gives you maximum control. If you want to ship a conversion-optimized checkout fast without becoming a payments engineer, an MoR is the faster path.
Conclusion
Checkout optimization isn’t glamorous work. It doesn’t show up in your product roadmap or your launch announcements. But it directly determines what percentage of the people who want to buy from you actually do.
A 70% abandonment rate is the industry baseline. It doesn’t have to be yours. Guest checkout, upfront pricing, one-page layout, local payment methods, and embedded flows — implemented together, these changes routinely move conversion from 2–3% to 5–8%. For a product doing $10K/month, that’s $30–40K/month in found revenue.
If you want a checkout that handles all of this — embedded, local payments, full MoR tax compliance, and mobile-optimized — try Fungies for free. Setup takes under 30 minutes, and you get the full global payment infrastructure without building it yourself.
References
- Baymard Institute. “Cart Abandonment Rate Statistics 2026.” baymard.com
- Ringly.io. “50 Ecommerce Cart Abandonment Statistics for 2026.” ringly.io
- Mida-App. “Checkout Conversion Rate Benchmarks for Ecommerce 2026.” mida-app.io
- Digital Applied. “eCommerce Checkout Optimization: UX Guide 2026.” digitalapplied.com
- Nexway. “SaaS Checkout Localization Best Practices 2026.” nexway.com
- Statista. “Global Digital Shopping Cart Abandonment Rate 2026.” statista.com
- Charle. “Shopify One-Page Checkout: The Complete Guide for 2026.” charle.io
- Paddle. “Local Payment Methods: How to Unlock Them at Scale.” paddle.com