SaaS Valuation Statistics 2026: Market Multiples, Data & Trends (Comprehensive Report)
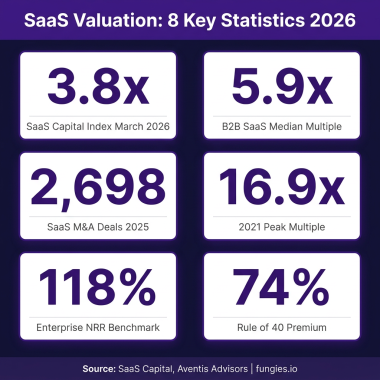
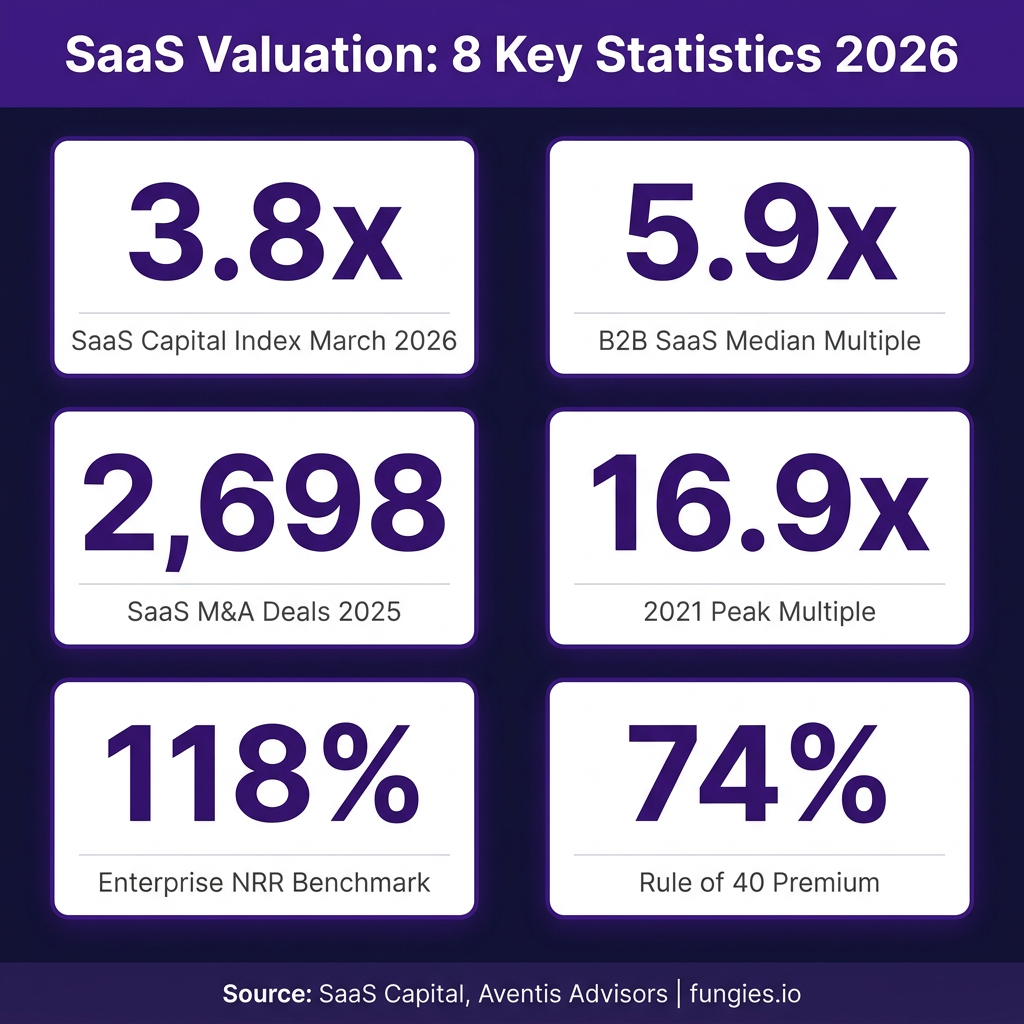
The SaaS valuation landscape has undergone a dramatic transformation. What was once a market where growth-at-all-costs commanded 20x revenue multiples has evolved into a disciplined environment where profitability, efficiency, and AI-readiness determine value. As of March 2026, the SaaS Capital Index sits at 3.8x ARR—down from 16.9x at the 2021 peak but settling into what many analysts consider a sustainable “new normal.”
This comprehensive report examines over 2,700 SaaS M&A transactions and 100+ public SaaS companies to bring you the definitive data on how software companies are valued in 2026. Whether you’re a founder preparing for fundraising, an investor evaluating opportunities, or an executive benchmarking your company’s performance, these statistics provide the quantitative foundation for strategic decision-making.
Key Statistics at a Glance
- The SaaS Capital Index stands at 3.8x ARR as of March 2026, down from 7.0x at the start of 2025
- B2B SaaS revenue multiples settled at 5.9x in 2025, contracting from 6.7x in 2024
- Private SaaS M&A transactions reached a record 2,698 deals in 2025, up 28% year-over-year
- Median public SaaS EV/Revenue multiple is 6.7x entering 2026
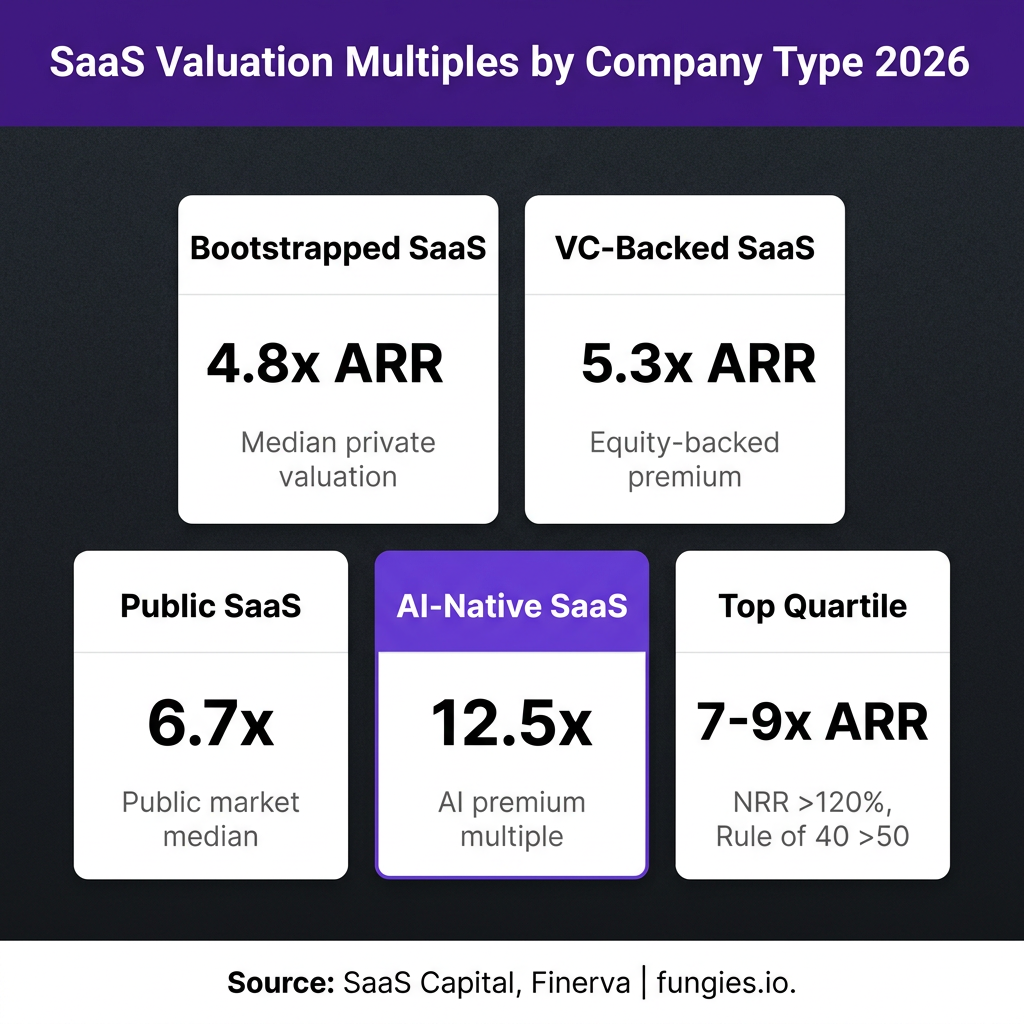
- Bootstrapped SaaS companies trade at a median 4.8x ARR; VC-backed companies at 5.3x ARR
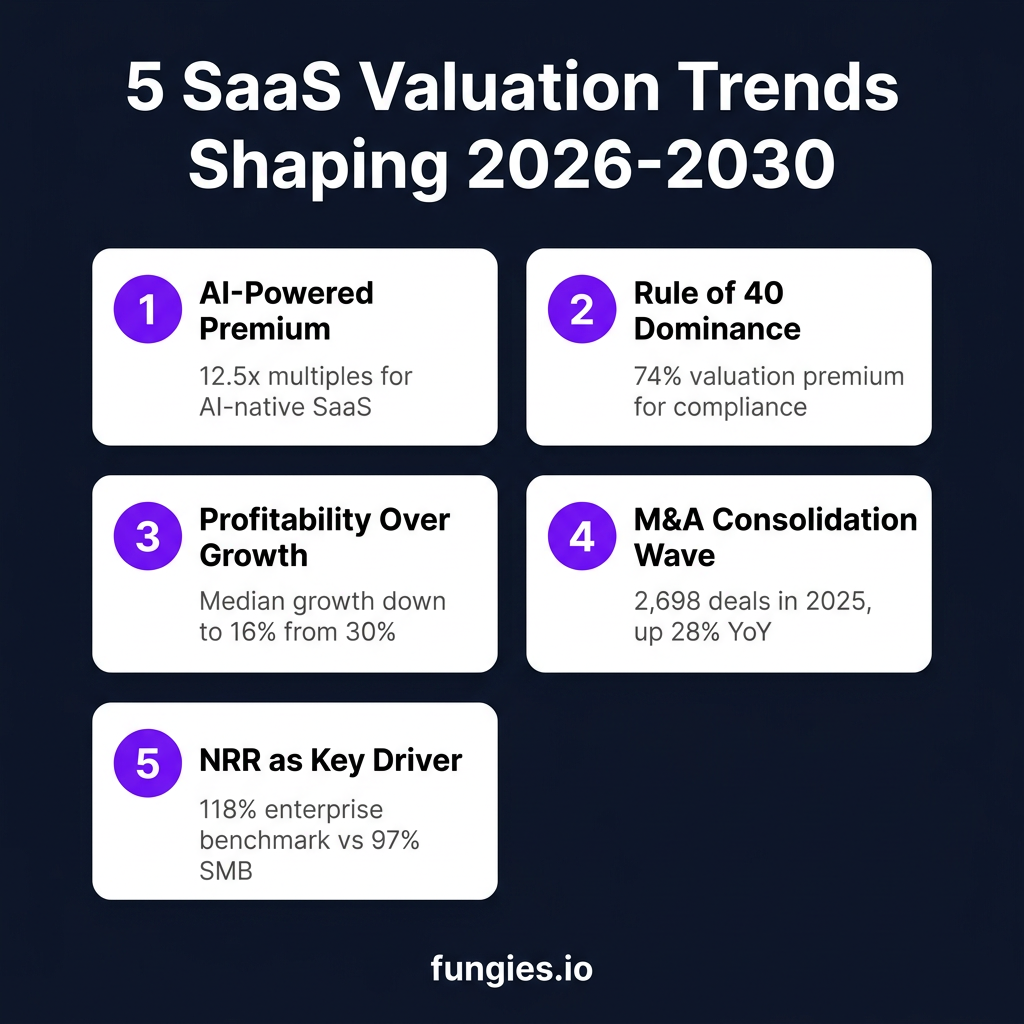
- AI-native SaaS companies command premium multiples of 12.5x EV/Revenue
- Companies clearing the Rule of 40 trade at a 74% premium (4.8x vs 2.7x)
- Enterprise SaaS NRR benchmark is 118%, while SMB SaaS sits at 97%
- Median EBITDA multiple for private SaaS is 22.4x; public software at 12.7x
- Technology M&A reached $1.08 trillion in 2025, up 66% year-over-year
Market Size & Growth
The global SaaS market has demonstrated remarkable resilience despite valuation compression. According to Statista, worldwide SaaS revenue reached approximately $280.19 billion in 2023 and is projected to grow to $793.10 billion by 2029, representing a compound annual growth rate (CAGR) of 18.9%. This growth trajectory underscores the continued digital transformation across industries, even as investor expectations have shifted toward sustainable unit economics.
The valuation reset of 2022-2023 fundamentally altered how SaaS companies are valued. The 2021 peak, when public SaaS companies traded at a median of 18.6x EV/Revenue, is now viewed as an anomaly driven by zero-interest-rate policies and pandemic-era digital acceleration. According to Finerva’s 2026 B2B SaaS Valuation Multiples report, while multiples saw a slight recovery in 2024 to 6.7x, they contracted again in 2025, settling at 5.9x—reflecting a market that has found equilibrium between growth expectations and profitability requirements.
| Metric | 2021 Peak | 2024 | 2025 | March 2026 |
|---|---|---|---|---|
| SaaS Capital Index | 16.9x | 6.7x | 5.9x | 3.8x |
| Public SaaS Median | 18.6x | 7.0x | 6.7x | 6.0x |
| Private M&A Median | 8.5x | 2.9x | 3.8x | 4.5x |
| B2B SaaS Median | 15.2x | 6.7x | 5.9x | 5.5x |
The divergence between public and private market multiples has narrowed significantly. While private SaaS companies historically traded at a 30-50% discount to public peers, that gap has compressed as public valuations have fallen faster than private transaction prices. According to Aventis Advisors, this convergence reflects a more rational pricing environment where fundamentals—rather than momentum—drive valuations.
Valuation by Company Size & Stage
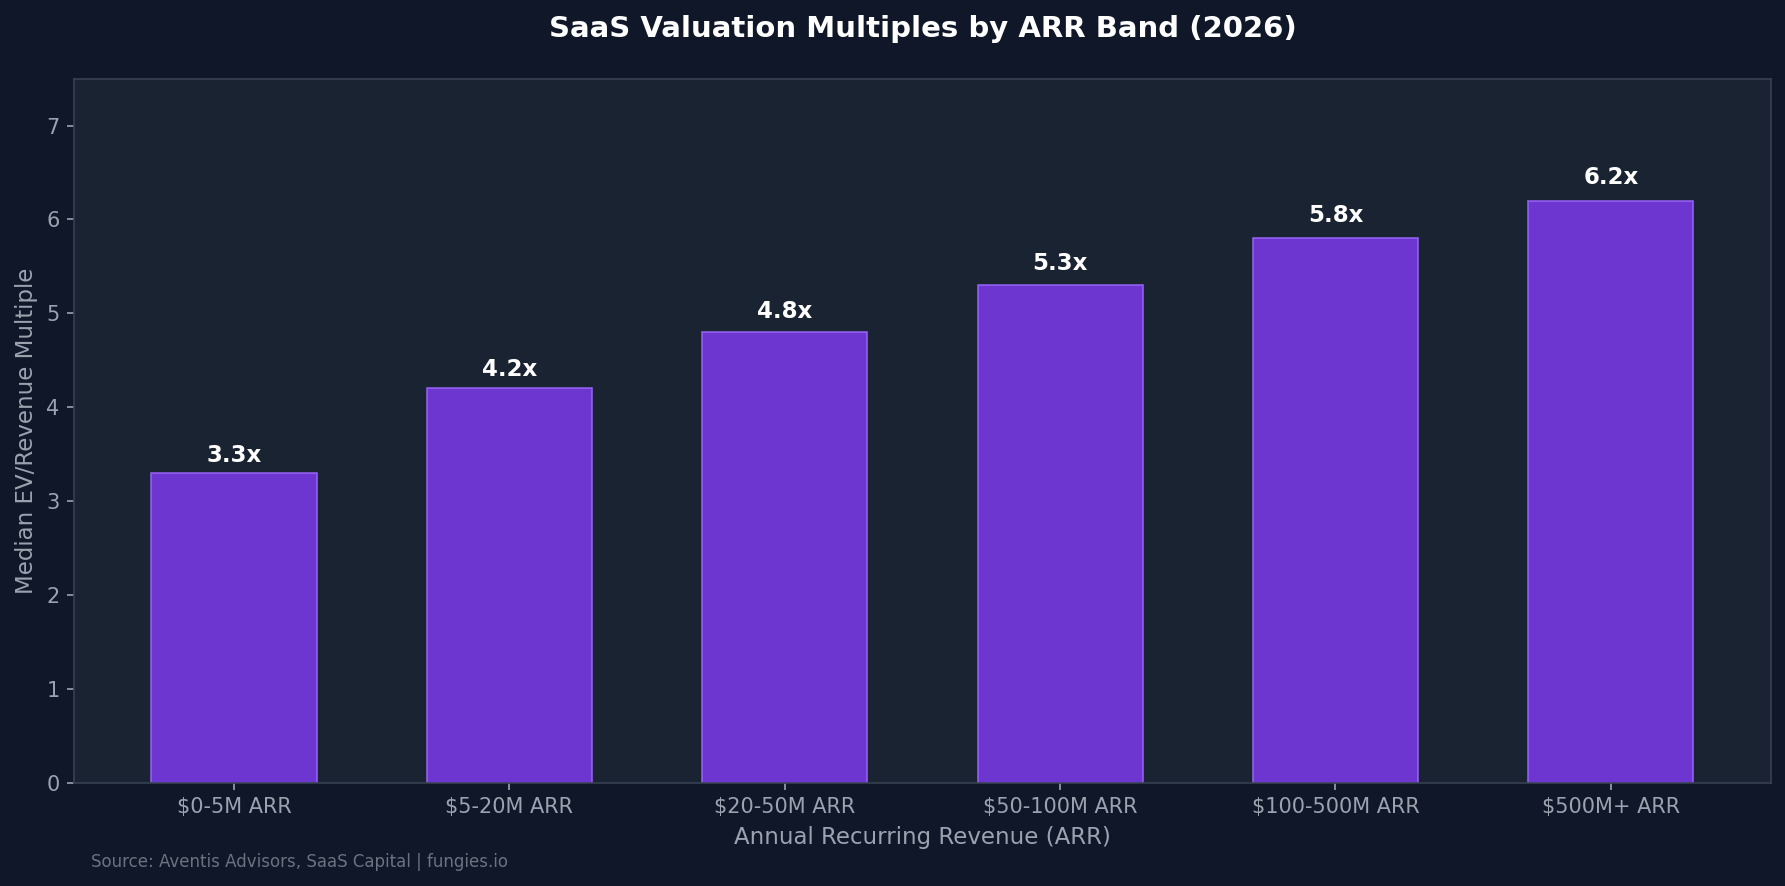
Company size remains one of the most significant determinants of valuation multiples. According to Aventis Advisors’ comprehensive analysis of SaaS M&A transactions, median valuation multiples increase steadily with ARR scale. Companies with $0-5M ARR trade at a median 3.3x, while those exceeding $500M ARR command 6.2x multiples—a nearly 2x premium that reflects reduced risk, established market position, and proven scalability.
This size premium extends beyond just multiples. Larger SaaS companies benefit from deeper buyer pools, with strategic acquirers and private equity firms competing more aggressively for assets above $50M ARR. According to Windsor Drake, in the private lower middle market—where most founder-led deals fall between $5M and $50M of enterprise value—SaaS companies typically transact at a median of 4 to 5x revenue, with the strongest multiples reserved for businesses clearing the Rule of 40.
| ARR Band | Median Multiple | Top Quartile | Key Characteristics |
|---|---|---|---|
| $0-5M | 3.3x | 5.0x | High growth, unproven scalability |
| $5-20M | 4.2x | 6.5x | Product-market fit, early scale |
| $20-50M | 4.8x | 7.0x | Proven go-to-market, expansion revenue |
| $50-100M | 5.3x | 7.5x | Market leadership, operational efficiency |
| $100-500M | 5.8x | 8.5x | Strategic platforms, acquisition targets |
| $500M+ | 6.2x | 9.0x+ | Category leaders, public market ready |
The funding stage also significantly impacts valuation. According to SaaS Capital’s 2026 benchmarking survey, bootstrapped companies with $3M to $20M ARR show median revenue growth of 15%, Net Revenue Retention (NRR) of 103%, and Gross Revenue Retention (GRR) of 91%. In contrast, VC-backed companies command a modest premium, with SaaS Capital reporting a median multiple of 5.3x for equity-backed versus 4.8x for bootstrapped companies—reflecting expectations of faster growth and larger exit outcomes.
Key Players & Market Share
The public SaaS landscape is dominated by a handful of mega-cap companies that set the tone for sector valuations. According to Statista’s latest data, Apple leads with a market capitalization exceeding $3 trillion as of early 2025, followed by Microsoft at approximately $3 trillion. While these tech giants operate diversified businesses, their cloud and SaaS components represent significant value drivers.
Pure-play SaaS leaders include Salesforce (market cap ~$250B), Adobe (~$200B), and ServiceNow (~$180B). These companies trade at varying multiples based on their growth profiles, profitability, and competitive positioning. According to Multiples.vc’s June 2026 analysis, horizontal SaaS public comps show wide valuation dispersion—a sign of AI’s “creative destruction”—with Design & Engineering Software trading at 4.9x EV/Revenue and Productivity Software at 2.9x.
| Company | Market Cap (Est.) | EV/Revenue Multiple | Primary Category |
|---|---|---|---|
| Microsoft | $3.0T | 10.5x | Cloud Infrastructure |
| Salesforce | $250B | 8.2x | CRM |
| Adobe | $200B | 9.1x | Creative Software |
| ServiceNow | $180B | 15.3x | Enterprise Workflow |
| Intuit | $185B | 10.8x | Financial Software |
| Workday | $65B | 8.5x | HCM/ERP |
Vertical SaaS—software tailored to specific industries—has emerged as a particularly active segment. According to Windsor Drake’s Software M&A Update, vertical SaaS represented 54% of all SaaS M&A in Q3 2025, up from 43% a year earlier. This shift reflects both the maturity of horizontal categories and the superior unit economics often achieved by industry-specific solutions.
Industry Benchmarks & KPIs
Understanding valuation requires fluency in the metrics that drive multiples. The Rule of 40—revenue growth rate plus profit margin—has become the defining benchmark for SaaS health. According to Aventis Advisors’ 2026 analysis, SaaS companies that clear the Rule of 40 on a free cash flow basis trade at a median 4.8x EV/Revenue, versus 2.7x for those that fail—a 74% premium that underscores the market’s prioritization of balanced growth and profitability.
Net Revenue Retention (NRR) has emerged as perhaps the single most important metric for SaaS valuations. According to McKinsey’s analysis of more than 100 B2B SaaS companies, top-quartile performers on NRR trade at a median 24x EV/Revenue. The benchmark varies sharply by customer segment: Optifai’s 2026 Pipeline Study of 939 B2B SaaS companies found median NRR of 118% for Enterprise (ACV >$100K), 108% for Mid-Market ($25K-$100K), and 97% for SMB (<$25K).
| Metric | Median | Top Quartile | Bottom Quartile |
|---|---|---|---|
| YoY Revenue Growth | 16% | 35% | 8% |
| Net Revenue Retention (NRR) | 106% | 118% | 98% |
| Gross Revenue Retention (GRR) | 88% | 93% | 82% |
| Rule of 40 Score | 12% | 45% | 5% |
| CAC Payback Period | 15 months | 10 months | 24 months |
| EBITDA Margin | 6% | 22% | -15% |
Capital efficiency metrics have gained prominence as investors scrutinize unit economics. According to SaaS Mag’s 2026 Capital Efficiency analysis, the median SaaS company now spends $2.00 to acquire every dollar of new ARR. SMB SaaS companies (under $15K ACV) recover acquisition costs in 8 to 12 months, while enterprise-focused companies typically see payback periods of 12 to 18 months. AI-native SaaS companies are achieving burn multiples of 0.8x to 1.2x, outperforming traditional SaaS at nearly every stage.
Trends & Predictions
Several powerful trends are reshaping SaaS valuations through 2026 and beyond:
1. The AI Valuation Premium
AI capabilities have become a primary valuation differentiator. According to Pawel Maj’s January 2026 analysis, SaaS companies with AI at their core command 12.5x EV/Revenue multiples—more than double the median. However, this premium comes with scrutiny: one in five strategic buyers walked from a 2025 deal over AI exposure concerns, according to L40’s SaaS Multiples report. The market is rewarding genuine AI integration while penalizing companies whose business models face AI disruption risk.
2. The Rule of 40 as Non-Negotiable
The Rule of 40 has evolved from aspiration to requirement. According to Aventis Advisors, the correlation between Rule of 40 performance and valuation multiples has strengthened significantly. Companies scoring above 50 on the Rule of 40 while maintaining NRR above 120% are consistently landing in the top quartile, commanding 7x to 9x ARR in private transactions. Some investors now advocate for a “Rule of 50” standard, reflecting heightened expectations for capital efficiency.
3. Profitability Over Growth-at-All-Costs
The median YoY revenue growth rate for SaaS companies has declined to 16-17%, the lowest since 2014 and far from the +30% growth that fueled higher multiples in previous years. According to SaaS Capital, 80% of SaaS companies are now growing <20%. This slowdown reflects both market maturation and a deliberate strategic shift: companies are prioritizing sustainable unit economics over growth-at-all-costs, recognizing that profitability commands premium valuations in the current environment.
4. M&A Consolidation Acceleration
2025 marked a record year for SaaS M&A, with 2,698 transactions according to Software Equity Group’s 2026 Annual SaaS Report—a 28% jump from 2024. AI-referenced targets accounted for approximately 72% of all SaaS M&A transactions, reflecting how quickly AI has become embedded across the landscape. Global M&A value reached $4.8 trillion in 2025, making it the second-highest year on record according to Bain & Company. For founders, this consolidation wave presents both opportunity (exit liquidity) and challenge (increased competition from combined entities).
5. NRR as the North Star Metric
Net Revenue Retention has emerged as the definitive SaaS metric of 2026. According to McKinsey, companies with sophisticated customer value-realization programs achieve NRR roughly seven percentage points higher than peers with basic onboarding. Expansion revenue now accounts for 40% to 50% of new ARR at high-performing SaaS companies. The 21-point spread between enterprise NRR (118%) and SMB NRR (97%) highlights how customer segment strategy fundamentally impacts valuation potential.
Methodology
This report synthesizes data from multiple authoritative sources to provide a comprehensive view of SaaS valuations in 2026. Primary data sources include: SaaS Capital’s annual survey of 1,000+ private B2B SaaS companies; Software Equity Group’s analysis of 2,700+ M&A transactions and 100+ public SaaS companies; Aventis Advisors’ proprietary transaction database; Finerva’s B2B SaaS valuation research; Optifai’s Pipeline Study of 939 B2B SaaS companies; ChartMogul’s subscription growth benchmarks; and McKinsey’s analysis of public SaaS performance.
Valuation multiples are presented as median figures unless otherwise specified, with quartile ranges provided where available to illustrate dispersion. All figures are current as of Q1-Q2 2026 unless historical context is provided. Private company data reflects actual transaction multiples from M&A deals and funding rounds; public company data reflects trading multiples based on market capitalizations and reported revenues.
Frequently Asked Questions
What is the average SaaS valuation multiple in 2026?
The average SaaS valuation multiple in 2026 varies significantly by company profile. The SaaS Capital Index sits at 3.8x ARR as of March 2026. Private SaaS companies in the lower middle market typically trade at 4-5x ARR, while public SaaS companies command median multiples of 6-7x EV/Revenue. Top-performing companies with strong Rule of 40 scores and NRR above 120% can achieve 7-9x ARR.
How is SaaS valuation calculated?
SaaS valuation is typically calculated using the ARR multiple method: Enterprise Value = Annual Recurring Revenue × ARR Multiple. The appropriate multiple depends on growth rate, profitability (Rule of 40), net revenue retention, market position, and company size. Alternative methods include EBITDA multiples (median 22.4x for private SaaS) and discounted cash flow analysis for mature companies with predictable cash flows.
What is a good Rule of 40 score for SaaS?
A Rule of 40 score of 40% or higher is considered good for SaaS companies, indicating a healthy balance between growth and profitability. However, the median private SaaS company currently scores just 12% (10% growth + 6% EBITDA margin). Companies scoring above 50% command significant valuation premiums, with some investors now advocating for a “Rule of 50” standard. The key is balancing growth with sustainable unit economics rather than pursuing growth-at-all-costs.
What is a good NRR for SaaS companies?
Good NRR benchmarks vary by customer segment. Enterprise SaaS (ACV >$100K) should target 115-120%+ NRR, with best-in-class performers exceeding 130%. Mid-market SaaS ($25K-$100K ACV) typically achieves 105-110% NRR. SMB SaaS (<$25K ACV) averages 97% NRR, with 100%+ considered strong. NRR above 100% means a company can grow without acquiring new customers—a powerful indicator of product-market fit and expansion revenue potential.
How has AI impacted SaaS valuations?
AI has created a bifurcated valuation landscape. AI-native SaaS companies command premium multiples of 12.5x EV/Revenue—more than double the median. However, AI also introduces risk: 20% of strategic buyers walked from 2025 deals due to AI exposure concerns. Companies leveraging AI effectively in Data Infrastructure (24.4x EBITDA multiples) and DevOps (36.5x) see significant valuation boosts, while those facing AI disruption risk trade at discounts.
Sources & Citations
- SaaS Capital – Four Early 2026 SaaS Trends
- Finerva – B2B SaaS 2026 Valuation Multiples
- Aventis Advisors – SaaS Valuation Multiples 2015-2026
- Software Equity Group – 2026 Annual SaaS Report
- L40 – SaaS Multiples: Methods and Company Valuation
- Windsor Drake – SaaS Valuation Multiples 2026
- ClearlyAcquired – EBITDA Multiples for SaaS 2025-2026
- Multiples.vc – Public Software Valuation Multiples June 2026
- SaaS Mag – SaaS Consolidation Wave 2026
- SaaS Capital – 2026 Benchmarking Metrics for Bootstrapped SaaS
- Optifai – B2B SaaS NRR Benchmarks 2026
- SaaS Mag – Net Revenue Retention: Defining SaaS Metric 2026
- Aventis Advisors – Rule of 40 in SaaS 2026
- Statista – Software as a Service Market Data 2025
- Bain & Company – M&A Report 2026
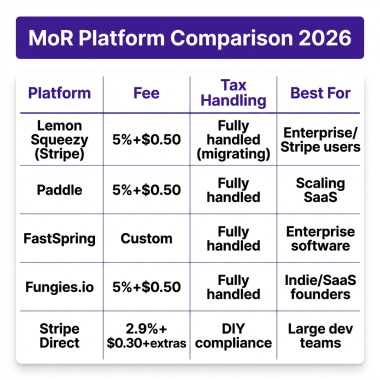
At Fungies.io, we help SaaS companies streamline their payment operations with our Merchant of Record platform. Whether you’re a startup processing your first payments or a scaling SaaS managing global tax compliance, our no-code checkout solution handles VAT, sales tax, and regulatory complexity so you can focus on growth metrics that matter.