Payment Processing Statistics 2026: Market Size, Data & Trends (Comprehensive Report)
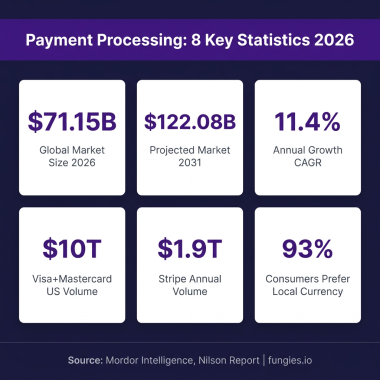
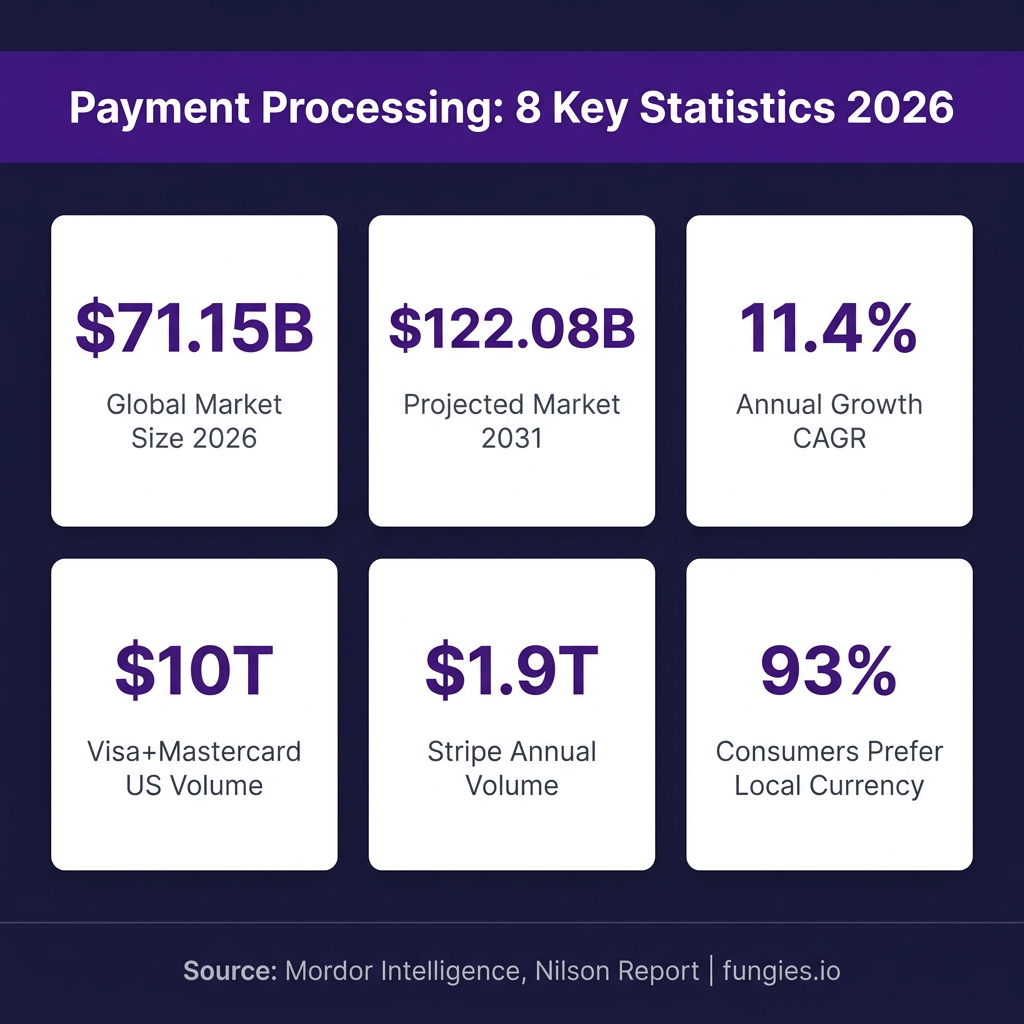
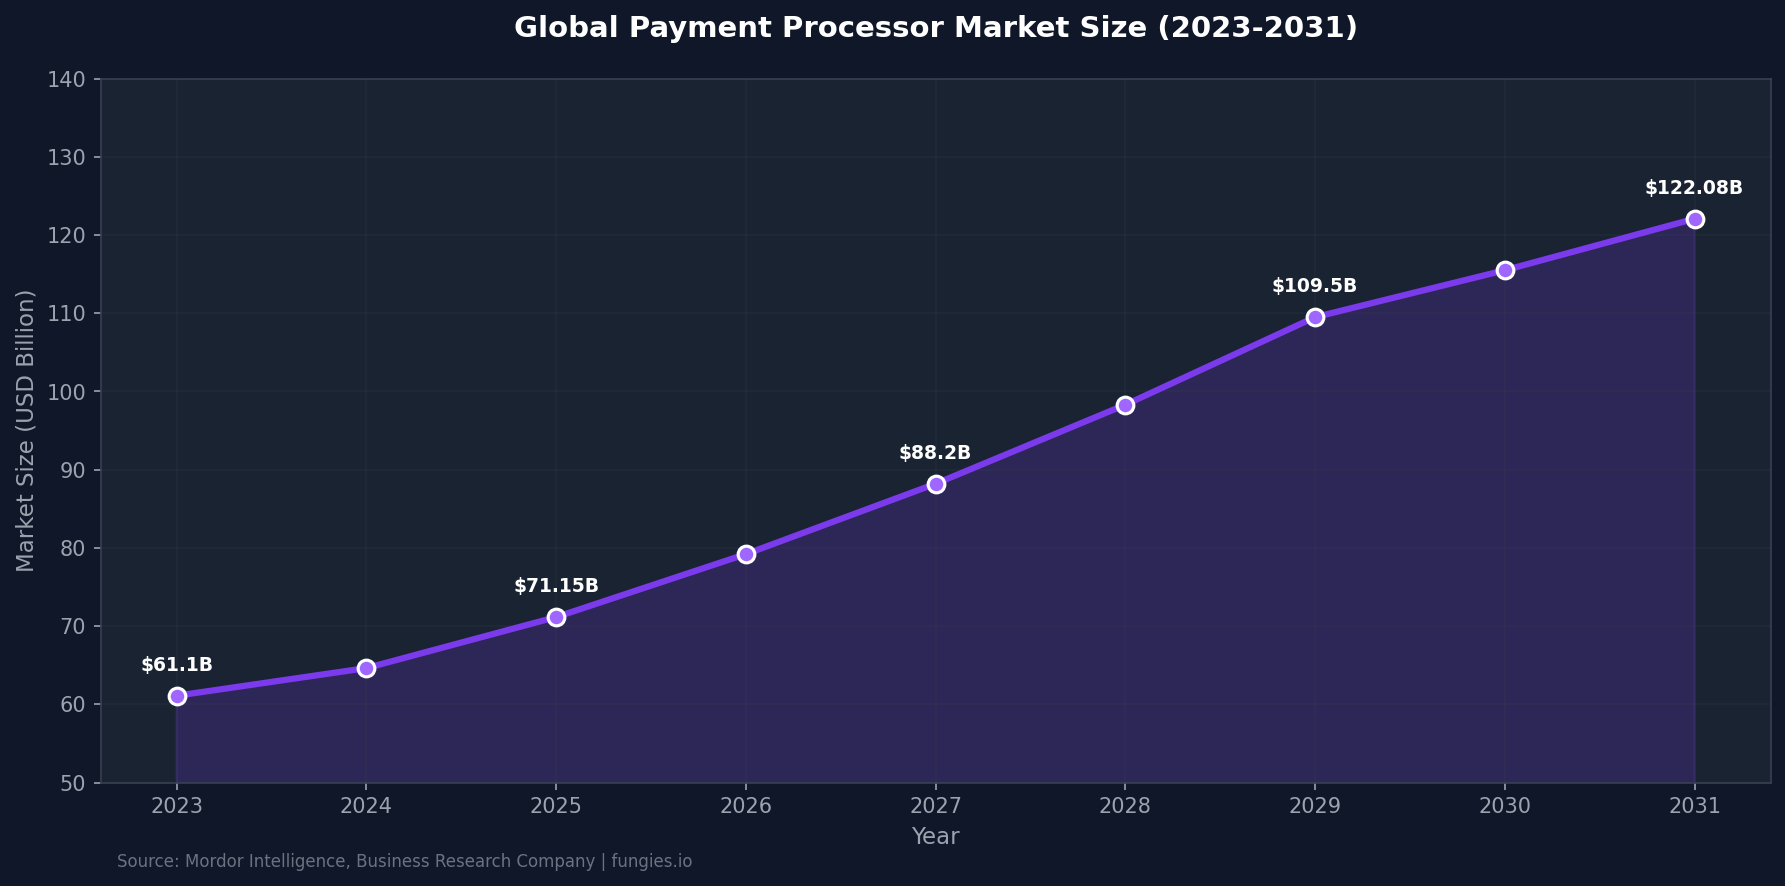
The global payment processing industry has reached an inflection point. In 2026, the market is valued at $71.15 billion and is projected to nearly double to $122.08 billion by 2031, representing a compound annual growth rate (CAGR) of 11.4%. This isn’t just incremental growth—it’s a fundamental restructuring of how money moves through the global economy.
For businesses, developers, and investors, understanding these numbers isn’t optional. Payment processing has become the invisible infrastructure powering everything from SaaS subscriptions to in-game purchases. When a payment fails, revenue evaporates. When it succeeds seamlessly, customer lifetime value compounds.
Payment Processing Key Statistics 2026
Before diving into the analysis, here are the essential figures that define the payment processing landscape in 2026:
- The global payment processor market reached $71.15 billion in 2026, up from $63.87 billion in 2025 (Mordor Intelligence)
- The broader payment processing solutions market is valued at $208.57 billion in 2026 and projected to reach $1.05 trillion by 2035 (Precedence Research)
- Visa and Mastercard combined for $10 trillion in U.S. card spending in 2025—the first time this milestone has been reached (Nilson Report)
- Stripe processed approximately $1.9 trillion in payment volume in 2025 with estimated net revenue of $5.84 billion
- PayPal maintains 430 million+ active accounts and processed over $1.68 trillion in total payment volume
- The top 20 global payment companies generated combined revenues of $280 billion in 2025, representing 8% year-over-year growth
- 93% of global consumers say pricing in their local currency affects their purchase decision, making payment localization critical
- AI applications in payment processing can potentially reduce fraud detection costs by 30%
- 39% of consumers—and more than half of Gen Z—are already using AI tools for product discovery
- Cross-border payment volumes grew 13% year-over-year in constant currency terms (Visa FY2025)
Market Size & Growth Analysis
The payment processing market is not monolithic. Different research firms define the market boundaries differently, leading to varying size estimates. Understanding these distinctions matters for strategic planning.
According to Mordor Intelligence, the core payment processor market—representing the infrastructure that facilitates transaction authorization, clearing, and settlement—was valued at $63.87 billion in 2025 and grew to $71.15 billion in 2026. This segment is projected to reach $122.08 billion by 2031, expanding at an 11.4% CAGR.
However, Precedence Research takes a broader view of payment processing solutions, estimating the market at $173.38 billion in 2025, growing to $208.57 billion in 2026. By 2035, this market is anticipated to reach approximately $1.05 trillion, representing a CAGR of 19.76% from 2026 to 2035.
The digital payment solutions segment—encompassing mobile wallets, contactless payments, and online transactions—is valued at $164.8 billion in 2026 and projected to reach $682.8 billion by 2033, growing at a 22.5% CAGR according to Grand View Research.
| Market Segment | 2025 Value | 2026 Value | 2031/2033 Projection | CAGR | Source |
|---|---|---|---|---|---|
| Payment Processor Market | $63.87B | $71.15B | $122.08B (2031) | 11.4% | Mordor Intelligence |
| Payment Processing Solutions | $173.38B | $208.57B | $1.05T (2035) | 19.76% | Precedence Research |
| Digital Payment Solutions | $137.0B | $164.8B | $682.8B (2033) | 22.5% | Grand View Research |
| Payment Processing Software | $66.8B | $74.6B | $221.16B (2031) | 17.95% | Mordor Intelligence |
Regional Market Breakdown
Payment processing growth is not evenly distributed globally. Regional differences in digital adoption, regulatory frameworks, and economic development create distinct market dynamics.
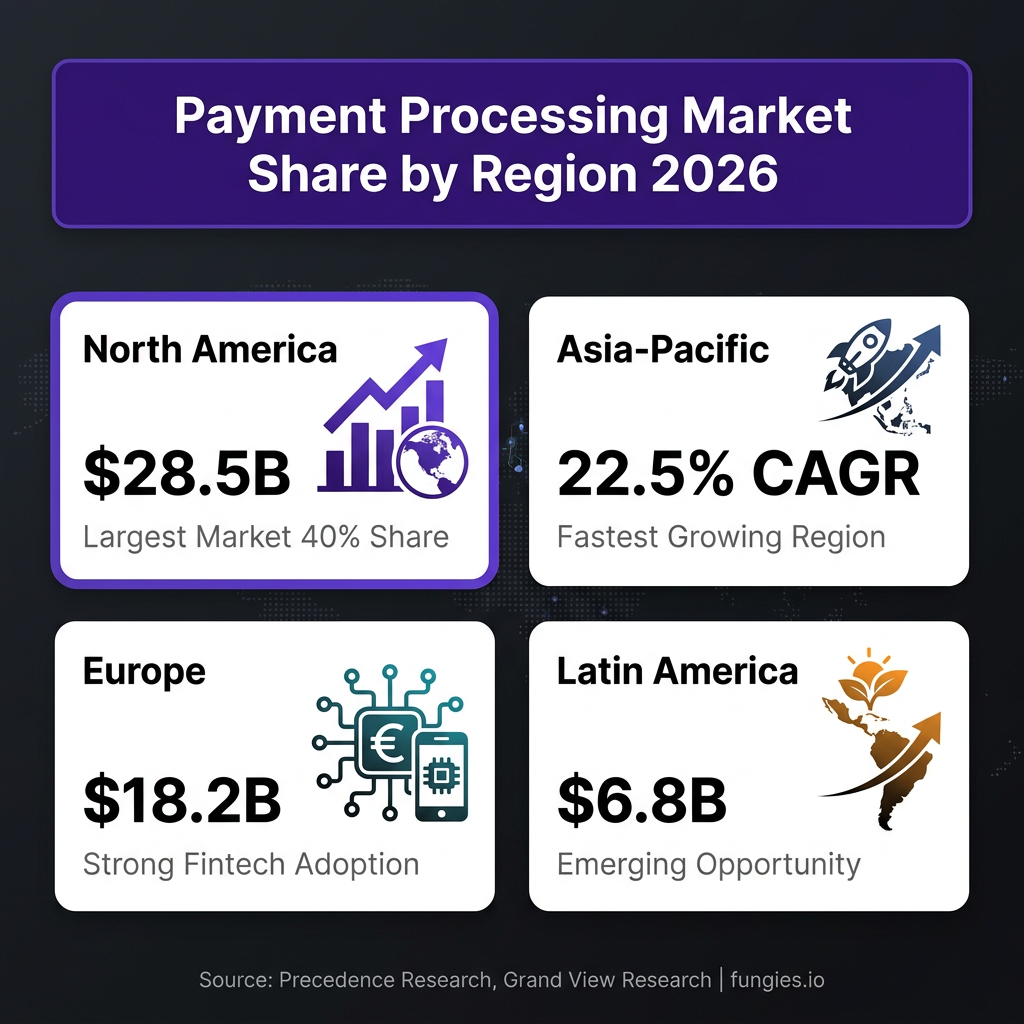
North America remains the largest regional market, accounting for approximately 40% of global payment processing revenue. The region benefits from mature digital infrastructure, high credit card penetration, and early adoption of emerging payment technologies. In 2026, North American payment processing revenue is estimated at $28.5 billion.
Asia-Pacific is the fastest-growing region, with a projected CAGR exceeding 22.5% through 2030. The region’s growth is driven by massive mobile wallet adoption in China, India, and Southeast Asia. China’s Alipay and WeChat Pay alone process trillions of dollars annually, though much of this volume remains domestic.
Europe represents a mature but evolving market valued at approximately $18.2 billion in 2026. The region benefits from strong regulatory frameworks including PSD2 and open banking initiatives, which have accelerated fintech innovation. The European payment landscape is increasingly fragmented as local payment methods gain market share alongside traditional card networks.
Latin America and Middle East & Africa are emerging as significant growth opportunities. Latin America’s payment processing market reached $6.8 billion in 2026, driven by financial inclusion initiatives and the rapid adoption of PIX in Brazil, which now processes over 6 billion transactions monthly.
| Region | 2026 Market Size | Share of Global | Projected CAGR | Key Growth Driver |
|---|---|---|---|---|
| North America | $28.5B | 40% | 10.5% | SaaS & embedded finance |
| Asia-Pacific | $22.1B | 31% | 22.5% | Mobile wallet adoption |
| Europe | $18.2B | 26% | 12.8% | Open banking & PSD2 |
| Latin America | $6.8B | 9.5% | 18.2% | PIX & financial inclusion |
| Middle East & Africa | $3.4B | 4.8% | 20.1% | Mobile money expansion |
Key Players & Market Share
The payment processing industry is dominated by a mix of established card networks, technology platforms, and emerging fintech challengers. Understanding their relative positions provides insight into competitive dynamics.
Visa maintains its position as the global leader in payment networks. In 2025, Visa’s purchase volume on credit, debit, and prepaid card products reached $7.028 trillion, representing a 6.8% increase year-over-year. Visa processed 251.4 billion transactions in the 12 months ending June 2025, growing at 10% annually.
Mastercard holds the second position with $2.958 trillion in purchase volume across all card products in 2025, growing at 6.3%. Mastercard has been particularly aggressive in expanding its value-added services portfolio, including data analytics, cybersecurity solutions, and open banking APIs.
Together, Visa and Mastercard’s U.S. cards reached a historic milestone in 2025: $10 trillion in spending for the first time. The number of credit, debit, and prepaid cards in circulation with these brands totaled 2.29 billion as of December 31, 2025.
Stripe has emerged as the dominant technology-native payment processor. The company processed approximately $1.9 trillion in payment volume in 2025 and generated an estimated $5.84 billion in net revenue. Stripe holds 22.3% market share in payment processing software and serves 90% of Dow Jones Industrial Average companies.
PayPal remains a significant player with 430 million+ active accounts and over $1.68 trillion in total payment volume. However, PayPal’s growth has slowed relative to competitors, with the company facing pressure from newer entrants and changing merchant preferences.
| Company | 2025 Payment Volume | YoY Growth | Key Strength |
|---|---|---|---|
| Visa | $7.028 trillion | +6.8% | Global network reach |
| Mastercard | $2.958 trillion | +6.3% | Value-added services |
| Stripe | $1.9 trillion | +27.5% | Developer experience |
| PayPal | $1.68 trillion | +4.3% | Consumer wallet adoption |
| Adyen | $0.45 trillion | +24% | Unified commerce platform |
| Square (Block) | $0.22 trillion | +12% | SMB & in-person focus |
Industry Benchmarks & KPIs
For merchants and payment professionals, understanding industry benchmarks is essential for evaluating performance. These metrics reveal where revenue is being lost and where optimization opportunities exist.
The payment success rate—the percentage of successful transactions out of total attempted transactions—varies significantly by industry and geography. Top-performing merchants achieve success rates above 95%, while average performers often see rates between 85-90%. Each percentage point improvement directly impacts revenue.
Authorization rates represent the percentage of transactions approved by issuing banks. These rates vary by card type: credit cards typically see 85-92% authorization rates, while debit cards average 88-94%. Cross-border transactions experience lower authorization rates, often 10-15 percentage points below domestic transactions.
Chargeback rates serve as a critical risk indicator. The industry average chargeback rate is approximately 0.6% of transactions, though this varies significantly by vertical. Digital goods and subscription businesses often see higher rates (1-2%), while physical retail typically experiences lower rates (0.3-0.5%).
Processing fees represent a significant cost center for merchants. Interchange fees typically range from 1.4% to 3.5% depending on card type, transaction method, and merchant category. Assessment fees from card networks add approximately 0.14%, while processor margins vary widely based on pricing models.
| KPI | Industry Average | Top Performers | Impact on Revenue |
|---|---|---|---|
| Payment Success Rate | 85-90% | 95%+ | Direct revenue impact |
| Authorization Rate (Credit) | 85-92% | 93%+ | Reduced cart abandonment |
| Authorization Rate (Debit) | 88-94% | 95%+ | Higher conversion |
| Chargeback Rate | 0.6% | <0.4% | Risk & compliance cost |
| Refund Rate | 8-12% | 5-7% | Customer satisfaction |
| Processing Time | 2-5 seconds | <2 seconds | Conversion optimization |
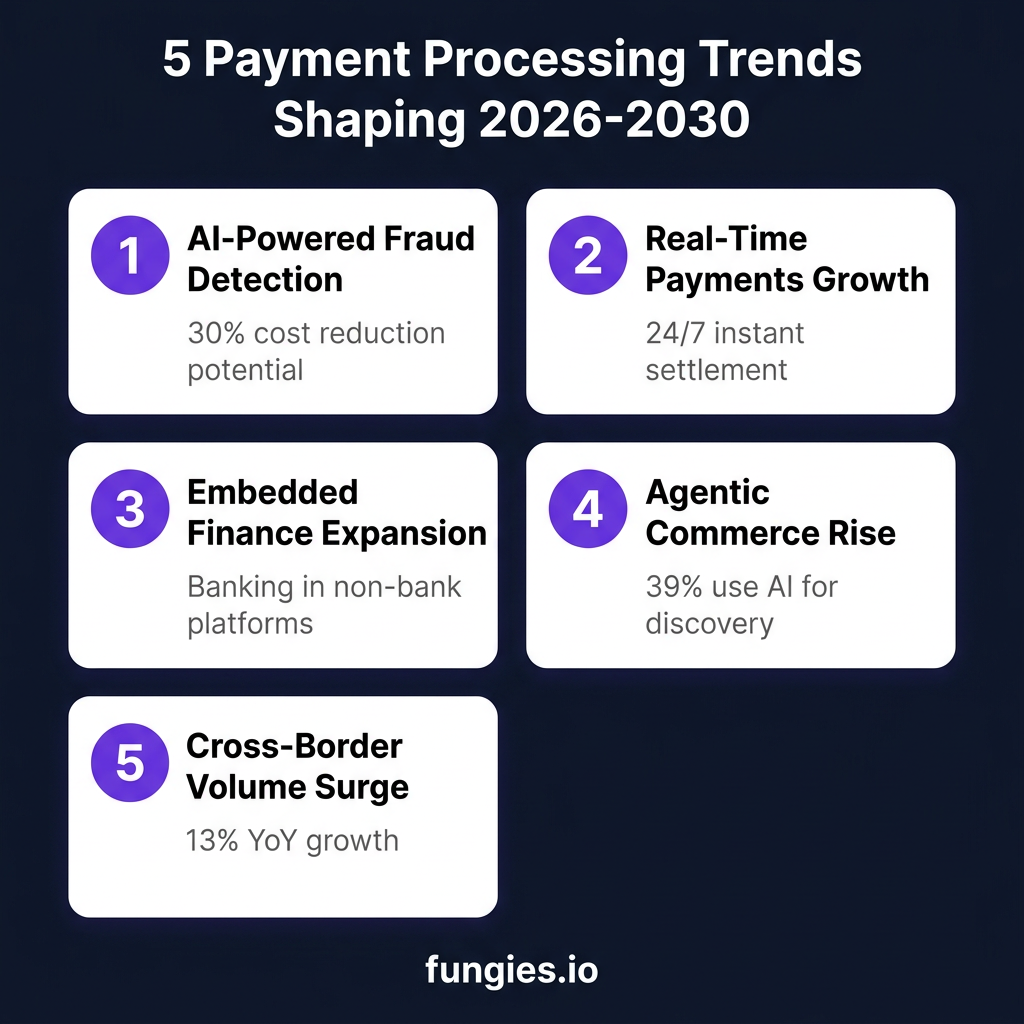
5 Payment Processing Trends Shaping 2026-2030
The payment processing landscape is evolving rapidly. Five major trends are reshaping how businesses accept and manage payments:
1. AI-Powered Fraud Detection and Risk Management
Artificial intelligence has become essential for keeping pace with evolving fraud vectors. According to the Payments Association, 70% of retailers are prioritizing AI for enhancing fraud detection and risk management. AI applications in payment processing can potentially reduce fraud detection costs by 30% while improving accuracy rates.
Machine learning models now analyze transaction patterns in real-time, identifying anomalies that rule-based systems miss. This shift is critical as fraud attempts become more sophisticated, with synthetic identity fraud and account takeover attacks increasing in frequency.
2. Real-Time Payments Become the Standard
Real-time payment systems are transitioning from novelty to expectation. According to Visa research, 90% of users expect real-time payouts, which has become a primary driver of trust and loyalty. Mastercard Transaction Stream, the company’s real-time processing technology, continues rolling out globally, enabling same-day settlement.
The implications extend beyond consumer convenience. Real-time payments improve cash flow for businesses, reduce working capital requirements, and enable new business models that were previously impractical due to settlement delays.
3. Embedded Finance Expansion
Embedded finance—integrating financial services into non-financial platforms—continues its rapid expansion. According to J.P. Morgan’s 2026 Payments Outlook, embedded banking is perceived as highly valuable by treasury professionals, with adoption accelerating across industries.
For software platforms, offering integrated payments has become a primary revenue driver. Companies like Shopify, Toast, and Mindbody generate significant portions of their revenue from payment processing, demonstrating how embedded finance transforms business models.
4. Agentic Commerce and AI-Driven Payments
Agentic commerce—where AI-powered systems anticipate and act on consumer needs—is expanding in 2026. According to Getnet’s research, 39% of consumers—and more than half of Gen Z—are already using AI tools for product discovery.
This trend represents a fundamental shift in how payments are initiated. Rather than consumers actively initiating transactions, AI agents will increasingly make purchasing decisions on behalf of users, requiring payment systems to adapt to new authentication and authorization models.
5. Cross-Border Payment Volume Surge
Cross-border payment volumes continue growing at double-digit rates. Visa reported 13% year-over-year growth in cross-border volumes for its full fiscal year 2025, while Mastercard has seen similar acceleration. This growth is driven by expanding e-commerce, post-pandemic travel recovery, and the globalization of digital services.
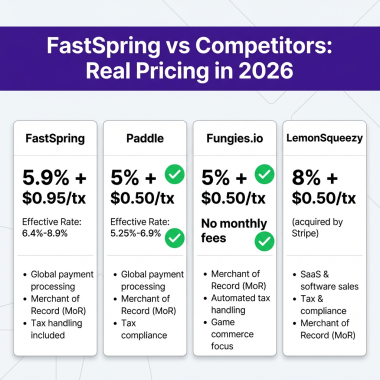
For merchants, this trend creates both opportunity and complexity. Accepting international payments requires managing multiple payment methods, currencies, and regulatory frameworks—challenges that payment processors and merchant-of-record platforms like Fungies.io help address.
Methodology
This report synthesizes data from multiple authoritative sources to provide a comprehensive view of the payment processing industry. Market size figures are derived from established research firms including Mordor Intelligence, Grand View Research, Precedence Research, and The Business Research Company. Transaction volume data comes from company financial reports, SEC filings, and the Nilson Report. Regional breakdowns are based on geographic revenue allocations reported by public companies and regional market analyses.
All figures are verified against multiple sources where possible. Projections represent consensus estimates from research firms and do not constitute investment advice. Currency figures are in U.S. dollars unless otherwise specified. Data collection occurred in June 2026, with statistics reflecting the most recent available reporting periods.
Frequently Asked Questions
What is the size of the payment processing market in 2026?
The payment processor market is valued at $71.15 billion in 2026, while the broader payment processing solutions market reaches $208.57 billion. The digital payment solutions segment alone accounts for $164.8 billion. Market size varies based on definition boundaries—core processing infrastructure versus comprehensive solutions including software, services, and value-added features.
What is the growth rate of the payment processing industry?
The payment processor market is growing at an 11.4% CAGR from 2026 to 2031. The broader payment processing solutions market is expanding at 19.76% CAGR through 2035, while digital payment solutions are growing at 22.5% CAGR. Growth rates vary significantly by region, with Asia-Pacific leading at over 22% annually.
Who are the largest payment processing companies?
Visa leads with $7.028 trillion in purchase volume, followed by Mastercard at $2.958 trillion. Among technology-native processors, Stripe dominates with $1.9 trillion in volume, while PayPal processes over $1.68 trillion. The top 20 payment companies collectively generated $280 billion in revenue during 2025.
What percentage of payments fail?
Industry data shows that 10-15% of online payment attempts fail, with failure rates varying by industry, geography, and payment method. Forrester research indicates that more than one in 10 U.S. online adults encountered technical failures at checkout in 2023. Failed payments cost merchants billions in lost revenue annually, making payment optimization a critical priority.
How much do payment processors charge?
Payment processing fees typically range from 1.4% to 3.5% per transaction, depending on card type, transaction method, and merchant category. Interchange fees—the portion paid to card-issuing banks—range from 1.4% to 2.9%. Assessment fees to card networks add approximately 0.14%. Processor margins vary based on pricing models, with some charging flat rates and others using interchange-plus pricing.
Sources & Citations
- Mordor Intelligence. “Payment Processor Market Size & Share Analysis – Growth Trends and Forecast (2026 – 2031).” https://www.mordorintelligence.com/industry-reports/payment-processor-market
- Precedence Research. “Payment Processing Solutions Market Size to Hit USD 1051.93 Bn by 2035.” https://www.precedenceresearch.com/payment-processing-solutions-market
- Grand View Research. “Digital Payment Market Size & Share Report, 2026-2033.” https://www.grandviewresearch.com/industry-analysis/digital-payment-solutions-market
- The Business Research Company. “Payment Processor Market 2026, Market Size And Forecast 2035.” https://www.thebusinessresearchcompany.com/report/payment-processor-global-market-report
- Nilson Report. “Mastercard and Visa Cards Reach $10 Trillion in Spending in 2025.” March 2026.
- Visa Inc. Q3 FY2025 Operational Performance Data. SEC Filing
- FXC Intelligence. “Visa and Mastercard’s Q3 2025 insights: Stablecoins, AI and cross-border growth.” https://www.fxcintel.com/research/analysis/ct-visa-mastercard-q3-25-earnings
- Chargeflow. “Stripe Stats for 2026: The Most Accurate Stripe Statistics Online.” https://www.chargeflow.io/blog/stripe-statistics
- GlobalData/Electronic Payments International. “Top 20 global payment companies’ revenue rises 8% in 2025.” Yahoo Finance
- Airwallex. “32 global payment processing industry statistics and trends for 2025.” https://www.airwallex.com/us/blog/payment-processing-industry-statistics
- J.P. Morgan. “Payments Outlook: Five Trends Powering Payments in 2026.” https://www.jpmorgan.com/insights/payments/trends-innovation/payments-outlook-trends-2026
- Mastercard. “The future of payments: Six industry trends shaping 2026.” https://www.mastercard.com/global/en/news-and-trends/stories/2025/2026-payment-trends.html
- The Payments Association. “The Global Payments Landscape: Key Trends Shaping the Future of Payments.” March 2026. Pay360 Intelligence Report
- Getnet. “The Future of Payments, 2026 vision.” White Paper
- Forrester. “Payment Processing Is Not Commoditized: Optimization Tactics.” https://www.forrester.com/blogs/payment-processing-is-not-commoditized-optimization-tactics
- Research and Markets. “Payment Processor – Market Share Analysis, Industry Trends & Statistics, Growth Forecasts (2026-2031).” Yahoo Finance