Optimizing your applications is an essential process that underpins the entire development cycle. Hardware continues to evolve, and a game’s optimization – along with its art, game design, audio, and monetization strategy – plays a crucial role in shaping the player experience. If your game is highly optimized, it can pass the certification from platform-specific stores better.
This article recompiles knowledge and advice from Unity’s expert talks, interviews, and articles.
Profiling
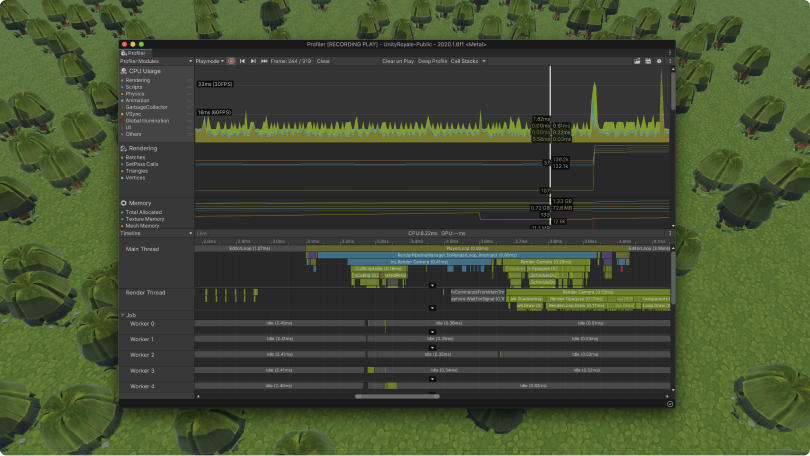
The Unity Profiler is an incredibly useful tool that can assist you in identifying the root causes of lags or freezes that may occur during runtime. Moreover, it allows you to gain a deeper understanding of what exactly is happening at any given frame, providing valuable insights into your application’s performance. By default, it is highly recommended to enable the CPU and Memory tracks within the Unity Profiler. These tracks provide essential information that can detect performance bottlenecks. If your game has specific requirements, you have the option to monitor additional Profiler Modules such as Renderer, Audio, or Physics. This flexibility is particularly beneficial for games that heavily rely on physics-based mechanics or music-driven gameplay.
To optimize the performance of your game, there are a few steps you can take.
To begin with, it’s important to consider a couple of key settings when developing your game for your device. One crucial step is to make sure you enable the “Development Build” and “Autoconnect Profiler” options. These settings offer valuable benefits for optimizing your game’s performance. On the other hand, if you prefer more control, you also have the option to manually connect to the Profiler. This alternative method can notably enhance the startup time of your application.
First, you’ll want to choose the target you wish to examine in detail. Simply click the “Record” button, and our Profiler will capture a few seconds of your application’s activity. By default, it’s usually set to 300 frames, which should give you a good starting point. However, if you require a longer recording, you have the option to adjust the frame count. To do so, go to Unity > Preferences > Analysis > Profiler > Frame Count. You can increase this value to a maximum of 2000 frames. Do keep in mind, though, that raising the frame count will result in the Unity Editor utilizing more of your computer’s CPU resources and taking up additional memory. Nevertheless, this trade-off can prove immensely valuable in certain scenarios, catering to your specific profiling requirements.
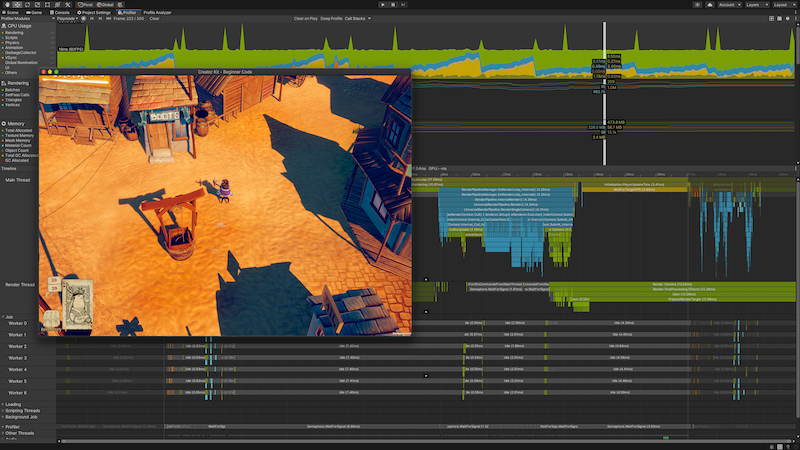
Also, it becomes vital to take into account two key aspects: performance spikes and the overall cost of an average frame. By thoroughly examining and optimizing resource-intensive operations that occur within each frame, you have the potential to greatly enhance your application’s performance. This becomes particularly beneficial for situations where your application is running below the desired target framerate. Through careful analysis and optimization, you can make substantial improvements that address both occasional performance spikes and the efficiency of every frame.
When you’re on the lookout for performance spikes, I suggest focusing your attention on exploring the most resource-intensive operations first. These usually include tasks such as physics calculations, AI computations, animation processing, and garbage collection. By addressing these areas of high resource consumption, you can effectively mitigate potential bottlenecks and optimize the overall performance of your game. It’s important to prioritize these critical components as improving their efficiency can greatly enhance the smoothness and responsiveness of your game.
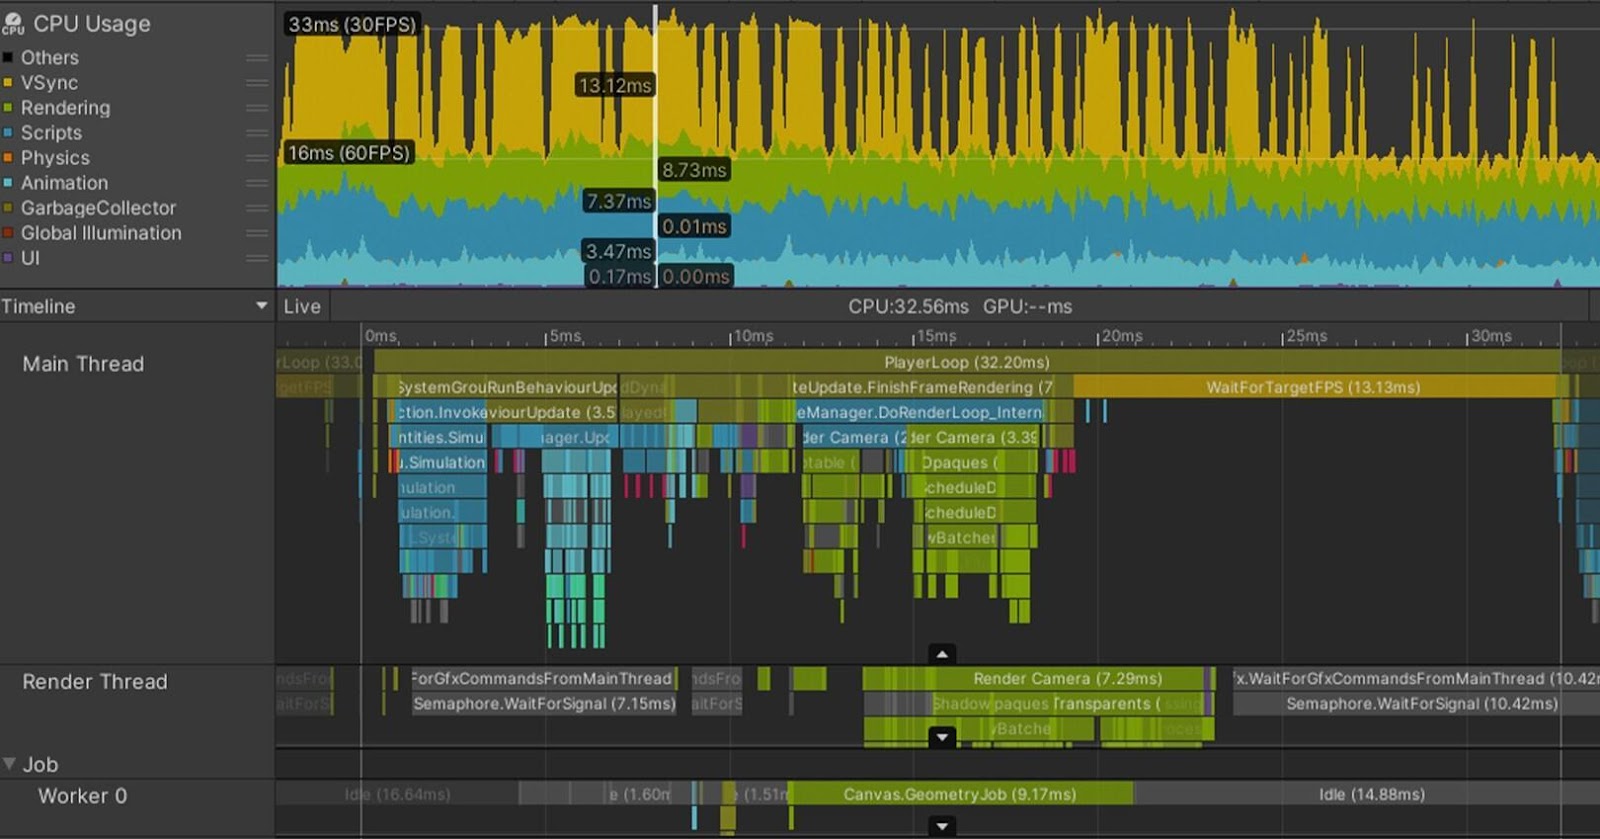
Click in the window to analyze a specific frame. Next, use either Timeline or the Hierarchy view:
- Hierarchy: The Hierarchy provides a visual representation of the ProfileMarkers organized in groups. This hierarchical view enables you to sort the samples based on their time cost in milliseconds, including both Time ms and Self ms. Additionally, you can track the number of function Calls and monitor the managed heap memory (GC Alloc) for the specific frame. This information offers valuable insights into the performance and resource utilization of your application, aiding in the identification of potential areas for optimization and improvement.
- Timeline: The visual breakdown displayed provides a comprehensive overview of the timings for the specific frame. This visual representation enables you to observe the relationships between different activities and how they interact across various threads. By analyzing this breakdown, you can determine whether your application is primarily CPU-bound or GPU-bound. This insight is crucial for understanding the performance bottlenecks and identifying areas where optimizations can be implemented to achieve better efficiency and balance between CPU and GPU utilization.
Prior to embarking on any optimization efforts within your project, it is essential to save the Profiler .data file. Once you have implemented your desired changes, it’s important to compare the previously saved .data file with the new one generated after the modifications. This iterative cycle is key to improving performance: profiling, optimizing, and comparing. Repeating this cycle, you can effectively fine-tune your project, identifying areas that require further optimization and evaluating the impact of your modifications. It’s through this iterative process that you can continuously refine and enhance the performance of your project.
Do it early
The Unity Profiler offers valuable performance information for your application, but it’s important to actively utilize it to reap its benefits. Instead of waiting until you’re close to shipping your project, make it a practice to profile your application early in the development process. By doing so, you can identify and investigate any glitches or performance spikes as soon as they arise.
Don’t guess
When it comes to identifying the factors that are impacting your game’s performance, it’s crucial not to rely on guesswork or assumptions. Instead, make effective use of the Unity Profiler and platform-specific tools at your disposal. These tools provide valuable insights into the specific areas that are causing lag or slowdown in your game.
The Hierarchy view, in particular, offers a useful feature that allows you to sort ProfileMarkers based on their time cost. This feature enables you to prioritize and focus on the areas of your game that are contributing the most to performance issues.
Target device
When profiling and optimizing your game, it’s crucial to consider the lowest-spec device you plan to support. By focusing on the performance and optimization requirements of this device, you can ensure that your game runs smoothly and efficiently across a wide range of hardware configurations. Prioritizing compatibility with lower-spec devices helps you create an inclusive experience for all players, regardless of their device capabilities.
Profiling and optimizing on target devices provide valuable insights and enable you to fine-tune your game’s performance to deliver the best possible experience for your players.
Memory
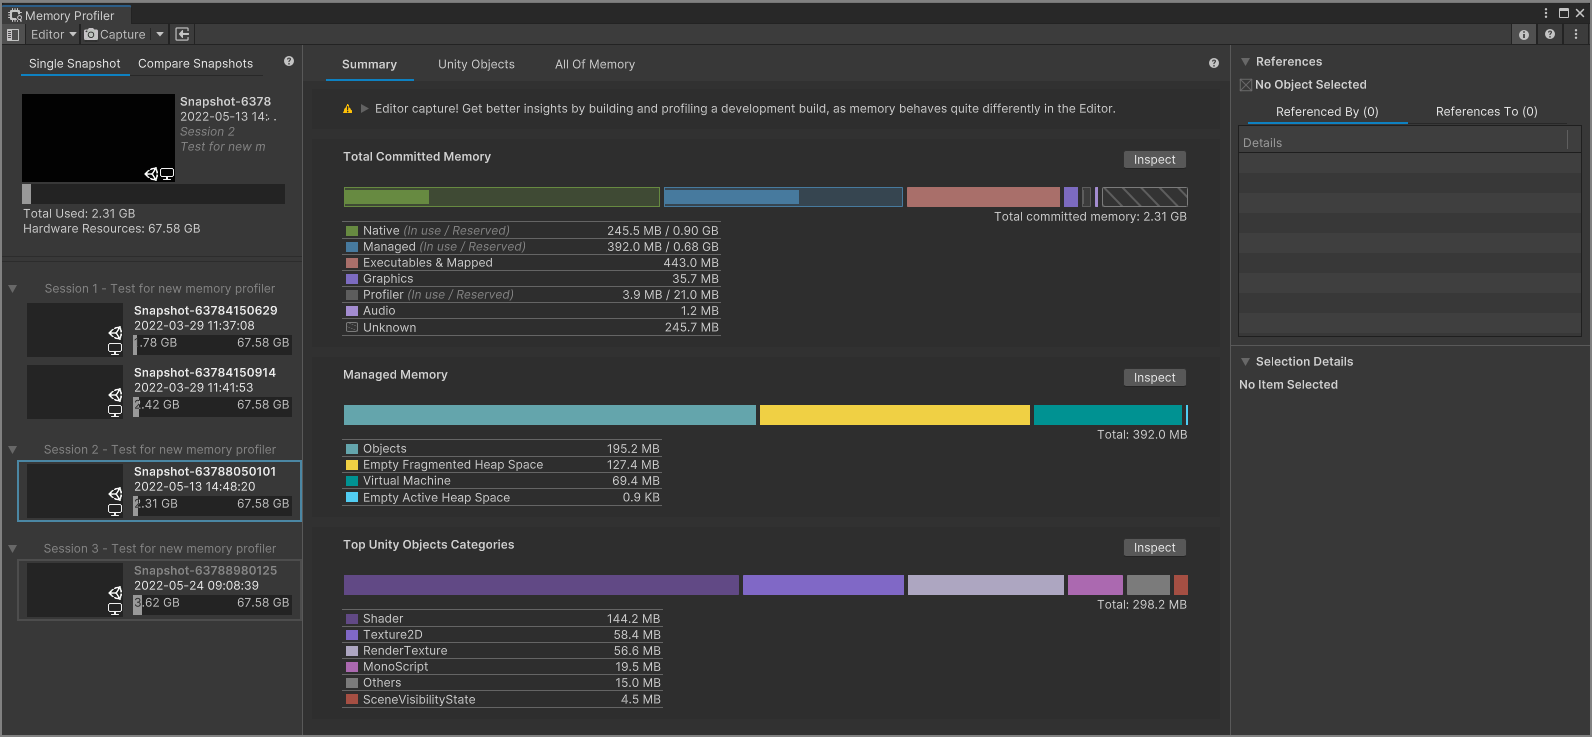
In Unity, automatic memory management is employed to handle user-generated code and scripts. Storing small pieces of data, such as value-typed local variables, they are allocated to the stack. On the other hand, larger data structures and long-term storage are allocated to the managed heap.
The garbage collector (GC) is responsible for periodically identifying and deallocating unused memory on the heap. While this process occurs automatically, it’s important to note that examining all the objects in the heap can sometimes cause the game to experience stutters or run slowly.
To optimize your memory usage, it’s essential to be mindful of when you allocate and deallocate memory on the heap.
Garbage collection (GC)
Be aware of certain unnecessary heap allocations, which could cause GC spikes:
- Strings: In C#, strings are reference types, not value types. Reduce unnecessary string creation or manipulation. Avoid parsing string-based data files such as JSON and XML; store data in ScriptableObjects or formats such as MessagePack or Protobuf instead. Use the StringBuilder class if you need to build strings at runtime.
- Unity function calls: Be aware that some functions create heap allocations. Cache references to arrays rather than allocating them in the middle of a loop. Also, take advantage of certain functions that avoid generating garbage; for example, use GameObject.CompareTag instead of manually comparing a string with GameObject.tag (returning a new string creates garbage).
- Boxing: Avoid passing a value-typed variable in place of a reference-typed variable. This creates a temporary object, and the potential garbage that comes with it (e.g., int i = 123; object o = i) implicitly converts the value type to a type object.
- Coroutines: Though yield does not produce garbage, creating a new WaitForSeconds object does. Cache and reuse the WaitForSeconds object instead of creating it in the yield line.
- LINQ and Regular Expressions: Both of these generate garbage from behind-the-scenes boxing. Avoid LINQ and Regular Expressions if performance is an issue.
Incremental garbage collector
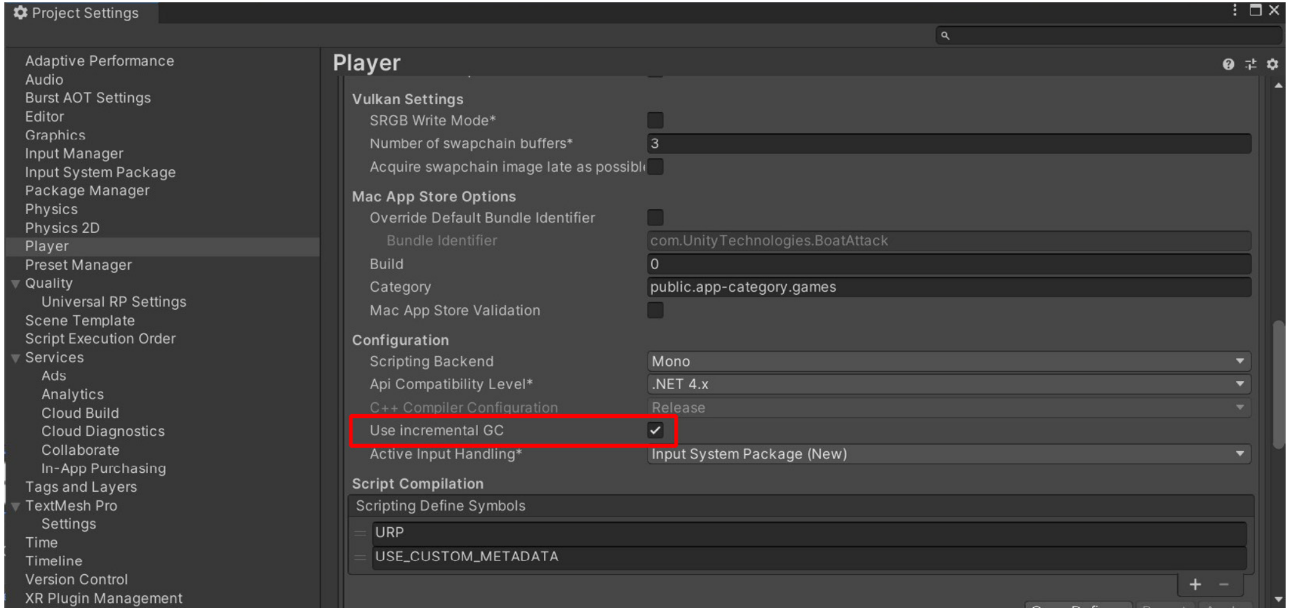
In contrast to a single, lengthy interruption of your program’s execution, incremental garbage collection takes a different approach. It divides the workload into multiple, much shorter interruptions, spreading the impact over several frames. If you find that garbage collection is negatively affecting performance, consider enabling this option to see if it can effectively mitigate the issue of GC spikes.
Enabling incremental garbage collection has the potential to significantly reduce the impact of these spikes on performance.
To determine the actual benefits for your specific application, I recommend utilizing the Profile Analyzer. This powerful tool allows you to analyze the performance impact and assess the effectiveness of incremental garbage collection in your particular scenario.
Programming
The Unity PlayerLoop encompasses a collection of functions that enable interaction with the core of the game engine. This hierarchical structure consists of various systems responsible for initialization and per-frame updates. It is within this PlayerLoop that the foundation for gameplay is established, as all your scripts rely on it.
During profiling sessions, you will find that all of your project’s user code is nested within the PlayerLoop (with Editor components falling under the EditorLoop). By examining and analyzing the performance of your scripts within this context, you can identify areas for optimization and improvement.
To optimize your scripts, consider utilizing the following tips and tricks. These techniques can help enhance the efficiency and performance of your code, leading to a smoother and more responsive gameplay experience.
Unity PlayerLoop
It’s crucial to have a solid understanding of Unity’s frame loop and how event functions are executed within it. Each Unity script follows a specific order in which these event functions are called, and it’s important to be aware of the differences between functions such as Awake, Start, Update, and others. These functions play a significant role in defining the lifecycle of a script.
To gain clarity on the exact order in which these event functions are executed, I recommend referring to the Script Lifecycle Flowchart. This handy resource provides a visual representation of the sequence in which event functions are called during runtime.
Code loop frame by frame
Consider whether it needs to run during every frame.
To optimize performance, it’s advisable to move unnecessary logic out of event functions like Update, LateUpdate, and FixedUpdate. While these functions are convenient for code that requires frequent updates, it’s important to extract any logic that doesn’t need to be updated at that frequency. Whenever possible, execute the code only when there are actual changes or updates.
If you find that you still need to use the Update function but want to minimize its impact on performance, you can consider implementing a time-slicing technique. Time slicing involves distributing a heavy workload across multiple frames. For instance, you can choose to run a specific function, such as ExampleExpensiveFunction, once every n frames. This approach allows you to spread the execution of resource-intensive tasks across several frames, avoiding significant performance hits caused by executing them every frame.
| private int interval = 3; void Update(){ if (Time.frameCount % interval == 0) { ExampleExpensiveFunction(); }} |
Debug Log
Using excessive log statements, especially within frequently called event functions like Update, LateUpdate, or FixedUpdate, can significantly impact performance. It is advisable to disable these log statements before creating a build of your application to ensure optimal performance.
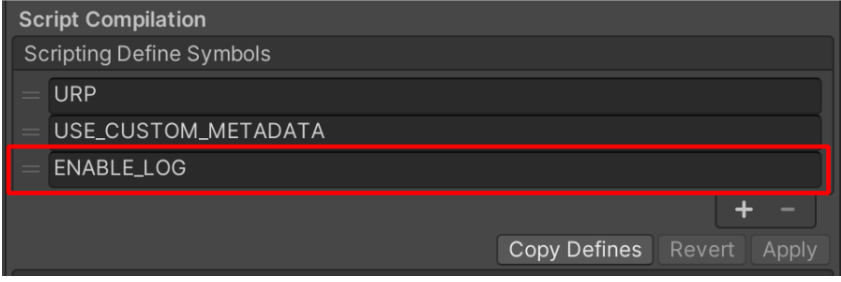
To simplify the process of disabling log statements, you can create a custom class with a Conditional attribute and a preprocessing directive. This allows you to easily control the inclusion or exclusion of log statements based on compile-time conditions. For instance, you can define a custom class like the following:
| public static class Logging{ [System.Diagnostics.Conditional(“ENABLE_LOG”)] static public void Log(object message) { UnityEngine.Debug.Log(message); }} |
By using the Conditional attribute and defining a preprocessing directive such as ENABLE_LOG, you can enable or disable log statements simply by toggling this directive during compilation. When the ENABLE_LOG directive is not defined, the log statements within the Log method will be completely removed from the compiled code, ensuring they do not impact the performance of your application.
Cache GameObjects
It’s important to be mindful of the potential performance impact when using GameObject.Find, GameObject.GetComponent, and Camera.main (in versions prior to 2020.2), especially within Update methods. To optimize performance, it’s advisable to avoid calling these methods repeatedly and instead invoke them in the Start method and cache the results.
The following example demonstrates an inefficient use of a repeated GetComponent call within the Update method:
| void Update(){ Renderer myRenderer = GetComponent<Renderer>(); ExampleFunction(myRenderer);} |
A more efficient approach would be to call GetComponent only once and cache the result for later use within the Update method. This way, the cached result can be reused without the need for further calls to GetComponent:
| private Renderer myRenderer; void Start(){ myRenderer = GetComponent<Renderer>();} void Update(){ ExampleFunction(myRenderer);} |
By invoking GetComponent in the Start method and storing the result in a variable, you eliminate the need to repeatedly call GetComponent within the Update method. This optimization reduces the overhead associated with these expensive calls, resulting in improved performance.
Remember, by caching the result and reusing it as needed, you can efficiently access the required component without incurring unnecessary performance costs.
Object pool
The process of using Instantiate and Destroy methods in Unity can generate garbage and lead to spikes in garbage collection (GC). It is generally a slow process that can impact performance. To mitigate these issues, I recommended avoiding frequent instantiation and destruction of GameObjects, especially in scenarios such as shooting bullets from a gun. Instead, you can utilize object pools consisting of preallocated objects that can be reused and recycled.
To implement this approach, you can create the reusable instances at a suitable point in the game, such as during a menu screen, where any potential CPU spikes are less noticeable to players. You can keep track of this pool of objects using a collection data structure. During gameplay, rather than instantiating and destroying objects, you can enable the next available instance from the pool when needed. When an object is no longer required, disable it rather than destroy it, allowing it to be returned to the pool for future use.
How to implement Unity Engine Pool system
Object pooling is widely recognized as a highly effective technique for optimization within Unity. In recognition of its importance, Unity has thoughtfully incorporated its own system to assist developers in implementing this clever method with greater ease.
To get started, we’ll create a script specifically designed for object pooling. Begin by generating a new script and naming it “Object Pool.” Next, attach this script to your game controller. Now, open the script and write the following class:
public static ObjectPool SharedInstance;
public List<GameObject> pooledObjects;
public GameObject objectToPool;
public int amountToPool;

void Awake()
{
  SharedInstance = this;
}

void Start()
{
  pooledObjects = new List<GameObject>();
  GameObject tmp; for(int i = 0; i < amountToPool; i++)
  {
    tmp = Instantiate(objectToPool);
    tmp.SetActive(false);
    pooledObjects.Add(tmp);
  }
}
With this straightforward setup, you have the flexibility to designate a specific GameObject to be pooled and determine the initial number of instances to pre-instantiate. Within the For Loop, the objectToPool will be instantiated the specified number of times, as defined by the amountToPool variable. Subsequently, these GameObjects will be deactivated and added to the pooledObjects list.
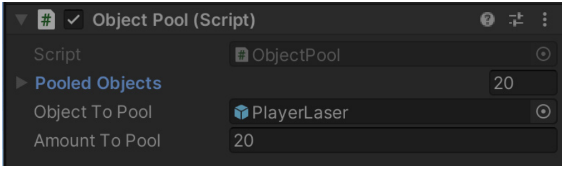
First, locate the game controller that contains the recently created script. Within this controller, you’ll find the Object to Pool and Amount To Pool fields, allowing you to respectively specify the desired object for pooling. By dragging and dropping the bullet prefab into the Object to Pool field, the script will be informed about the object that should compose the pool.
Consider setting the Amount To Pool to a sufficiently large number, such as 20, ensuring an ample supply of GameObjects for your needs. This approach guarantees that 20 PlayerBullets will be created beforehand, even before the game commences. Consequently, a collection of pre-instantiated bullets will always be available for utilization. However, in order to take full advantage of this functionality, there are a couple more essential steps to follow.
Open the Object Pool script that you previously created, allowing for the creation of a new function to be called from other scripts. This new function will enable the utilization of the Object Pool, eliminating the need for redundant object instantiation and destruction during runtime. Additionally, it empowers other scripts to activate the objects as needed, aligning with the elegant design principles of Object Pooling.
public GameObject GetPooledObject()
{
  for(int i = 0; i < amountToPool; i++)
  {
    if(!pooledObjects[i].activeInHierarchy)
    {
      return pooledObjects[i];
    }
   }
  return null;
}
Navigate to the scripts responsible for bullet instantiation. Within these scripts, locate any lines of code that currently involve instantiating bullets, for example: Instantiate(playerBullet, turret.transform.position, turret.transform.rotation);
To replace these Instantiate calls, utilize the following code snippet:
GameObject bullet = ObjectPool.SharedInstance.GetPooledObject();

if (bullet != null)
{
  bullet.transform.position = turret.transform.position;
  bullet.transform.rotation = turret.transform.rotation;
  bullet.SetActive(true);
}
This updated code will request the activation of a specific GameObject and configure its properties. By doing so, it eliminates the necessity of instantiating a new object and intelligently retrieves a pre-instantiated GameObject. As a result, the CPU is alleviated from the burden of creating and destroying new objects repeatedly.
Moving forward, locate any code responsible for destroying bullets, for example:
Destroy(gameObject);Rather than opting for the destruction of the GameObject, a more efficient approach is to deactivate it, effectively returning it to the pool.
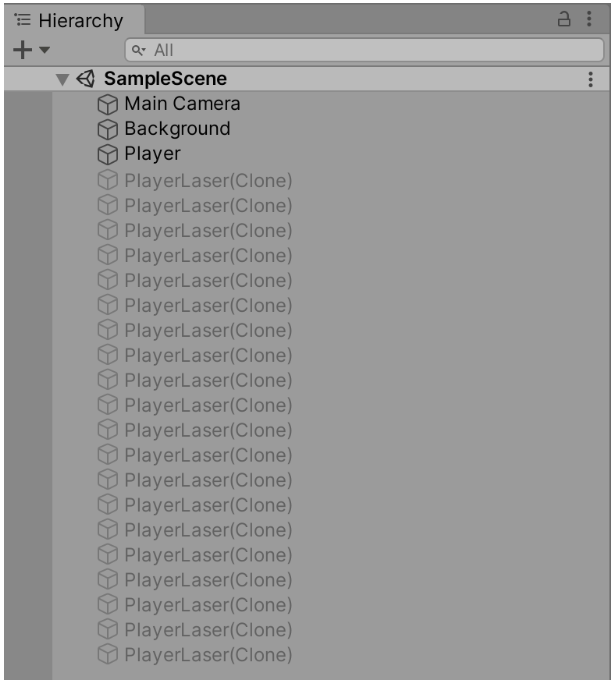
gameobject.SetActive(false);Now when you run the game, you will have the objects pre-instantiated and set to an inactive state. You can see this in the Hierarchy while the game is playing!
ScriptableObjects
When dealing with unchanging values or settings in Unity, it’s recommended to store them in a ScriptableObject instead of a MonoBehaviour. A ScriptableObject is an asset that resides within your project and only needs to be set up once. Unlike MonoBehaviours, it cannot be directly attached to a GameObject.
To utilize a ScriptableObject effectively, create fields within it to store your desired values or settings. These fields serve as containers for the data you want to store. Once you have set up your ScriptableObject, you can easily reference it in your MonoBehaviours.
By referencing the ScriptableObject in your MonoBehaviours, you can access the stored values or settings without the need for duplication or attaching the ScriptableObject to individual GameObjects. This approach promotes better organization and efficiency, as changes made to the ScriptableObject will be automatically reflected across all the MonoBehaviours referencing it.
Using a ScriptableObject to store unchanging values or settings provides a centralized and reusable solution within your Unity project. It simplifies the management of data and enhances modularity, making it easier to maintain and update your application over time.
User interface

When working with Unity UI (UGUI), it’s important to be aware that it can often be a source of performance issues in your project. The Canvas component, which is responsible for generating and updating meshes for UI elements, as well as issuing draw calls to the GPU, can incur significant performance costs.
Multiple Canvases
When dealing with a large Canvas that contains thousands of UI elements, it’s crucial to be mindful of the performance implications. Updating even a single UI element can trigger the entire Canvas to update, potentially causing a significant CPU spike. To optimize performance, take advantage of UGUI’s capability to support multiple Canvases.
By dividing your UI elements based on their refresh frequency, you can strategically distribute them across multiple Canvases. Static UI elements that do not require frequent updates can be placed on a separate Canvas. On the other hand, dynamic elements that update simultaneously should be grouped together on smaller sub-canvases.
Furthermore, it’s important to ensure that all UI elements within each Canvas share the same Z value, materials, and textures. This helps minimize the rendering overhead and ensures consistent rendering performance across the elements within a single Canvas.
Hide UI elements
In certain cases, you may have UI elements in your game that only appear intermittently, such as a health bar that is visible only when a character takes damage. It’s important to be aware that even if an invisible UI element is active, it may still contribute to draw calls and impact performance.
To optimize performance, it is recommended to explicitly disable any UI components that are currently invisible and enable them only when they need to be displayed. By disabling these components when they are not needed, you can minimize unnecessary draw calls and alleviate the performance impact.
If you only require the visibility of the entire Canvas to be toggled, it is preferable to disable the Canvas component itself rather than disabling the entire GameObject. This approach helps to avoid the rebuilding of meshes and vertices, resulting in performance savings.
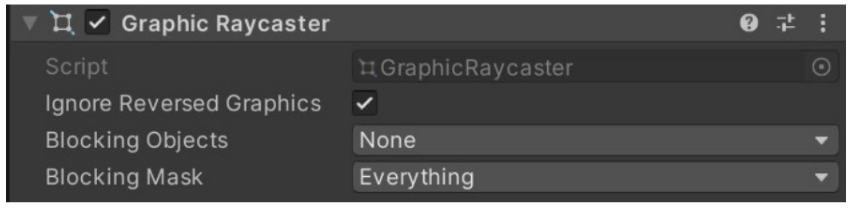
Limit GraphicRaycasters and disable Raycast Target
To enable input events such as on-screen touches or clicks within your UI, the GraphicRaycaster component plays a crucial role. It loops through each input point on the screen and determines if it falls within a UI’s RectTransform, enabling interaction with the UI elements.
To optimize performance, it is recommended to remove the default GraphicRaycaster from the top-level Canvas in your hierarchy. Instead, add the GraphicRaycaster component selectively to the specific UI elements that require interaction, such as buttons, scroll rects, or any other interactive elements.
By removing the default GraphicRaycaster from the top-level Canvas and adding it only to the necessary UI elements, you can minimize unnecessary computations and improve performance. This targeted approach ensures that the raycast checks are performed only on the required UI elements, reducing the overall processing overhead.
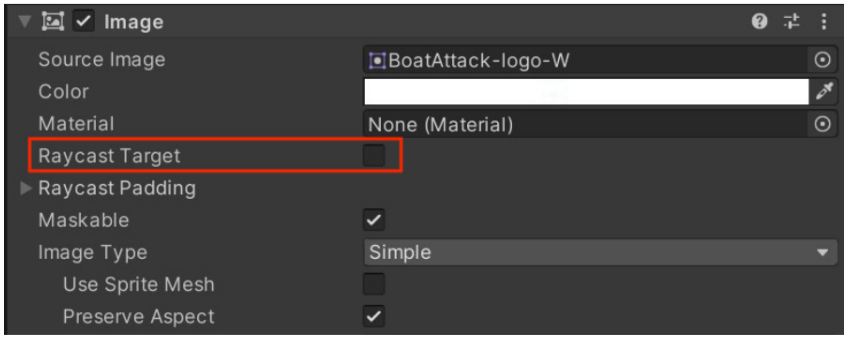
Also, disable Raycast Target on all UI text and images that don’t need it. If the UI is complex with many elements, all of these small changes can reduce unnecessary computation.
Physics

Using complex mesh colliders can have a significant impact on performance. To optimize performance, it’s recommended to replace complex mesh colliders with simpler alternatives such as primitive colliders or simplified mesh colliders that approximate the original shape.
Alternatively, if the precise shape of the mesh collider is not critical for collision interactions, you can simplify the mesh collider by reducing the level of detail or using a simplified mesh approximation that closely represents the original shape. This approach strikes a balance between accuracy and performance.
Physics methods
When manipulating Rigidbody objects in Unity, it’s recommended to use class methods like MovePosition or AddForce instead of directly translating their Transform components. Directly translating Transform components can trigger physics world recalculations, which can be computationally expensive, particularly in complex scenes.
Furthermore, it’s best to perform physics-related operations, including moving physics bodies, within the FixedUpdate method rather than the Update method. FixedUpdate is specifically designed for physics calculations and runs at a fixed time step, ensuring consistent physics simulation across different frame rates. This helps to maintain stable and accurate physics interactions in your Unity project.
Fixed Timestep
The Fixed Timestep in the Project Settings of Unity is set to 0.02, equivalent to a frame rate of 50 Hz. It is important to adjust this value to match your target frame rate to ensure optimal performance. For instance, if your target frame rate is 30 fps, you should set the Fixed Timestep to 0.03.
Failing to adjust the Fixed Timestep accordingly can lead to issues when the frame rate drops at runtime. In such cases, Unity may call FixedUpdate multiple times per frame, which can result in significant CPU performance problems, especially when dealing with physics-intensive content.
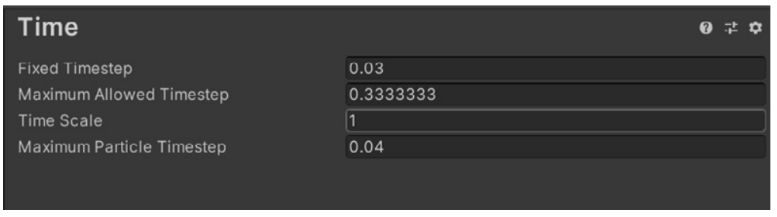
Additionally, the Maximum Allowed Timestep setting sets a limit on the amount of time that physics calculations and FixedUpdate events can use when the frame rate drops. Lowering this value means that during a performance hitch, physics and animation may slow down. However, it also reduces their impact on the overall frame rate.
Physics Debugger
To aid in troubleshooting collider-related issues or discrepancies, you can utilize the Physics Debug window in Unity. You can access this window by navigating to Window > Analysis > Physics Debugger.
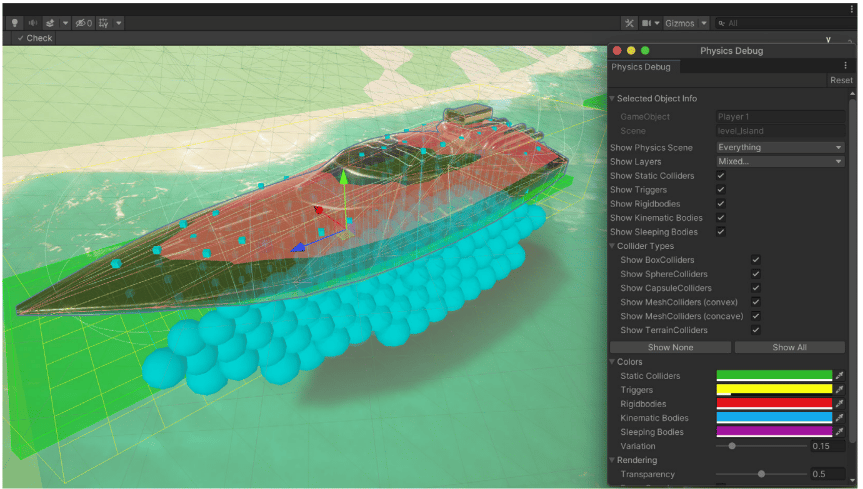
The Physics Debug window provides a valuable tool for visualizing and understanding the collision behavior within your scene. It presents a color-coded indicator that highlights which GameObjects should be able to collide with each other based on their respective colliders.
Make use of this helpful feature to streamline the debugging process and ensure accurate collision interactions in your Unity project. The Physics Debug window serves as a visual aid to enhance your troubleshooting efforts and optimize the collision system within your game.
Conclusion
Optimizing performance is a multifaceted subject that requires a comprehensive understanding of your mobile hardware’s capabilities and limitations. To find efficient solutions that align with your design requirements, it is essential to master Unity’s classes and components, delve into algorithms and data structures, and leverage the profiling tools specific to your platform. Profiling tools enable you to analyze and identify performance bottlenecks, allowing you to make informed optimization decisions.
While technical knowledge and proficiency are crucial, a touch of creativity can also be advantageous when optimizing performance. It allows you to think outside the box, explore alternative approaches, and find innovative solutions to improve performance and deliver a captivating user experience.
Hope you enjoyed and learned new things. See you in the next article!