Payment Processing Statistics 2026: Market Size, Data & Trends (Comprehensive Report)
The global payment processing industry is experiencing unprecedented growth, driven by the explosive rise of e-commerce, real-time payment adoption, and embedded finance innovations. In 2026, the payment processing solutions market is projected to reach $208.57 billion, marking a significant milestone in the industry’s evolution from traditional card-based systems to omnichannel digital payment ecosystems.
This comprehensive report aggregates the latest data from Precedence Research, Mordor Intelligence, Grand View Research, and other authoritative sources to provide you with 35+ verified statistics covering market size, regional breakdowns, competitive landscape, industry benchmarks, and emerging trends. Whether you’re a merchant evaluating payment providers, an investor analyzing market opportunities, or a fintech professional tracking industry developments, this data-driven analysis delivers the insights you need.
Key Statistics at a Glance
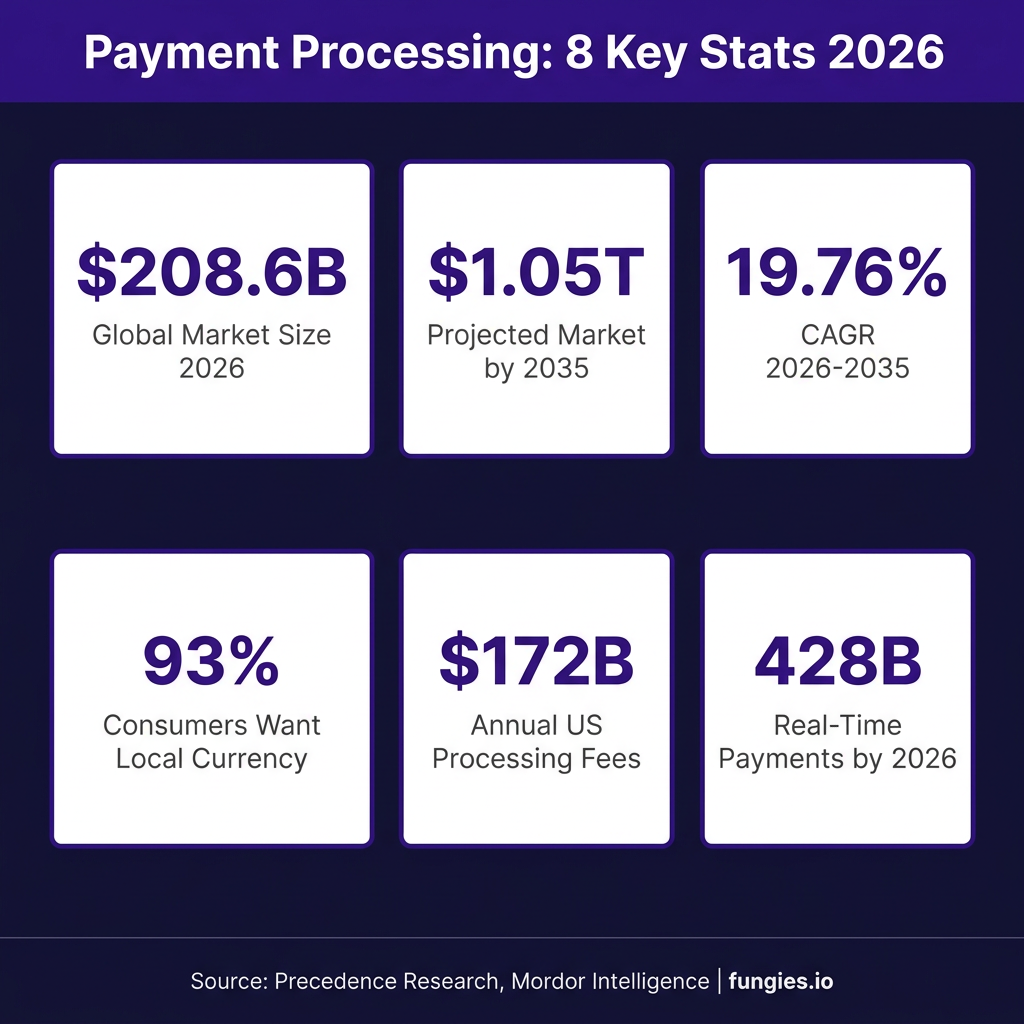
- The global payment processing solutions market will reach $208.57 billion in 2026, up from $173.38 billion in 2025 (Precedence Research)
- The market is projected to grow to $1.05 trillion by 2035 at a CAGR of 19.76%
- 93% of global consumers say pricing in their local currency affects their purchase decision (Airwallex)
- U.S. merchants pay the world’s highest processing fees, with interchange ranging from 1.8% to 8% per transaction
- Real-time payments are expected to reach 428 billion transactions annually by 2026 (RedCompass Labs)
- The payment processor market will grow from $71.15 billion in 2026 to $122.08 billion by 2031 at 11.4% CAGR
- 72% of small businesses believe payment processing companies are the best system for financial services needs
- Credit card processing fees typically range from 1.5% to 3.5% per transaction globally
Market Size & Growth Analysis
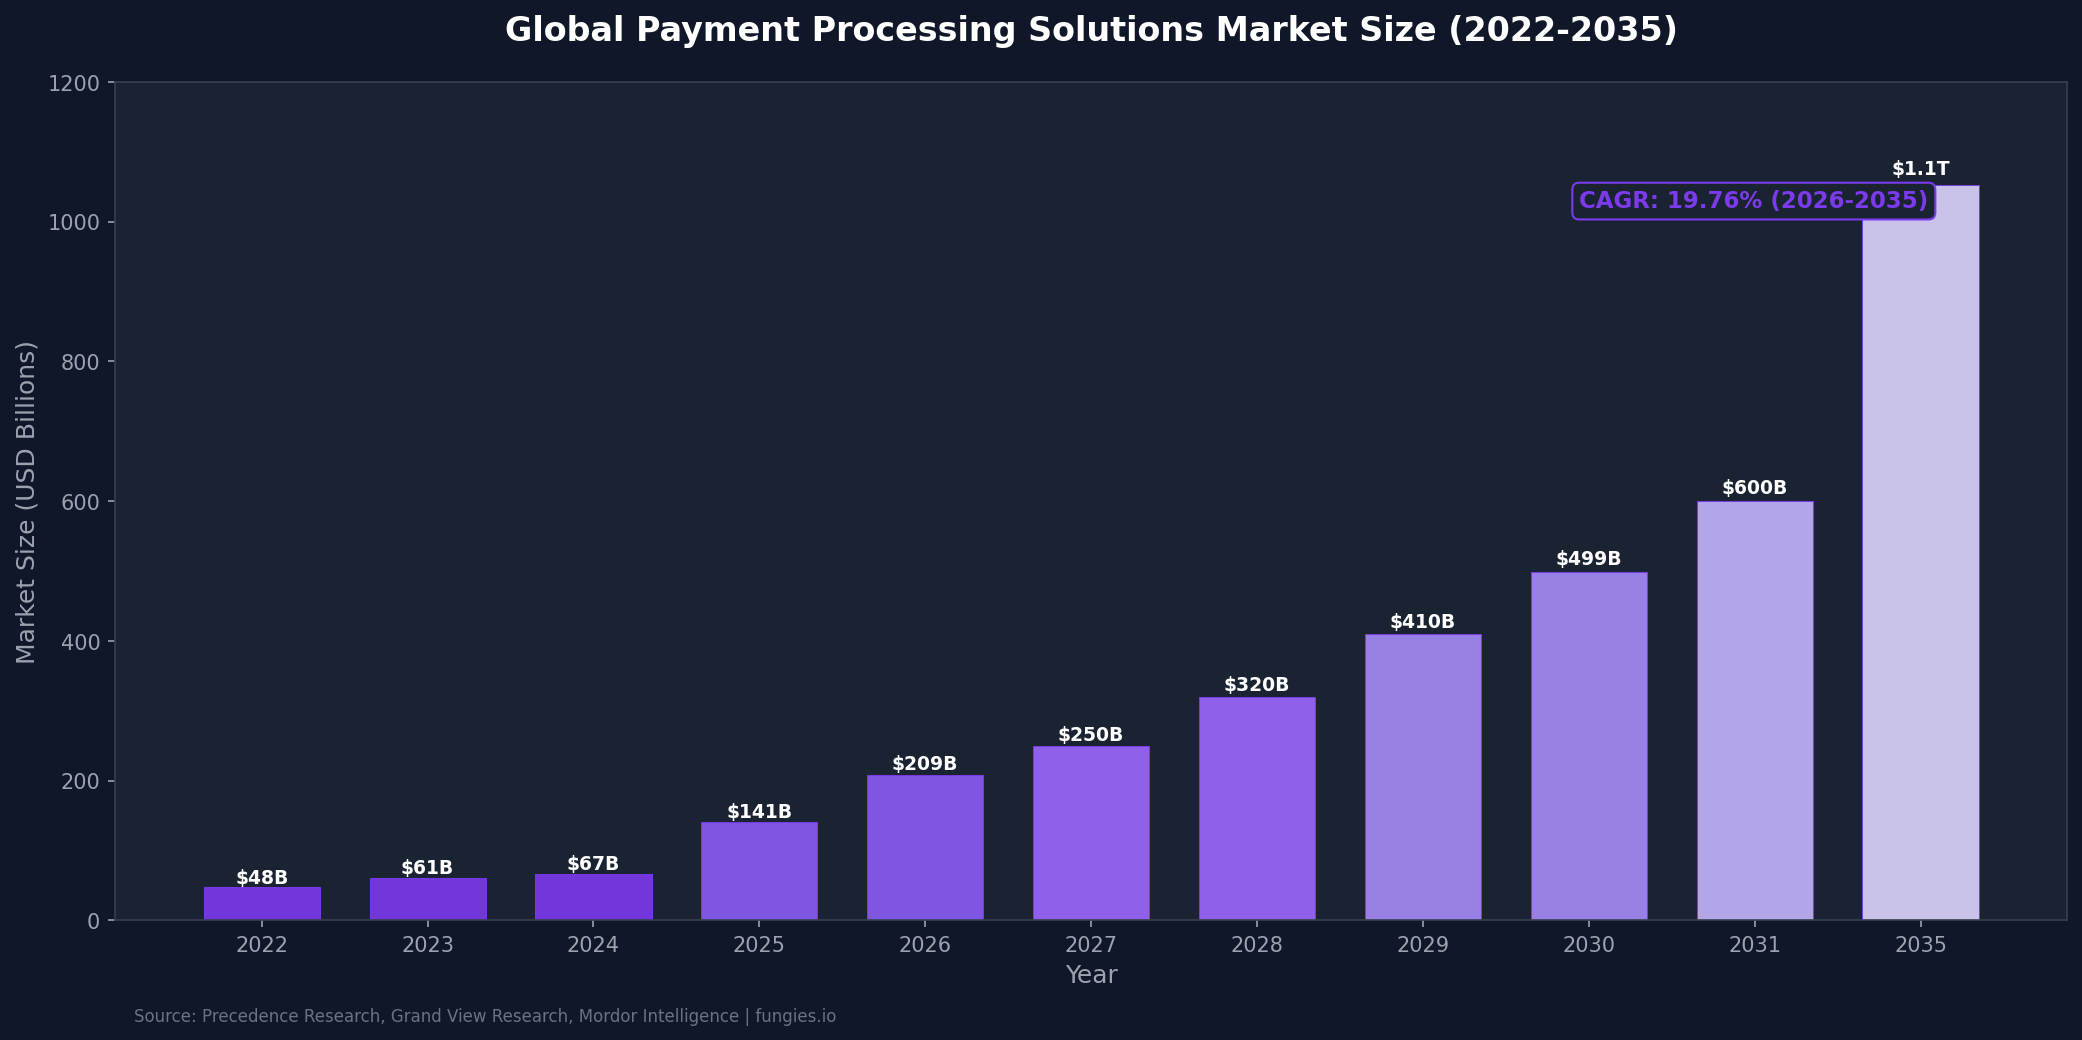
The payment processing industry has demonstrated remarkable resilience and growth trajectory over the past decade. According to Precedence Research, the global payment processing solutions market was valued at $173.38 billion in 2025 and is projected to reach $208.57 billion by 2026. This represents a year-over-year growth rate that significantly outpaces many other fintech sectors.
Looking further ahead, the market is anticipated to expand to approximately $1.05 trillion by 2035, reflecting a compound annual growth rate (CAGR) of 19.76% from 2026 to 2035. This extraordinary growth is fueled by several converging factors: the continued digitization of commerce, the proliferation of mobile payment solutions, the expansion of real-time payment networks, and the increasing adoption of embedded finance across non-financial platforms.
The Business Research Company provides slightly different but equally bullish figures, estimating the market at $140.63 billion in 2025 with projections to reach $314.26 billion by 2030 at a 17.5% CAGR. Meanwhile, Grand View Research valued the market at $47.61 billion in 2022 with forecasts reaching $139.90 billion by 2030 at a 14.5% CAGR. These variations reflect different market definitions and scope, but all sources agree on the fundamental growth trajectory.
| Year | Market Size (USD Billions) | Growth Rate | Source |
|---|---|---|---|
| 2022 | $47.61B | Baseline | Grand View Research |
| 2023 | $61.10B | +28.3% | Airwallex |
| 2024 | $66.80B | +9.3% | GM Insights |
| 2025 | $140.63B – $173.38B | +110% to +160% | Precedence Research |
| 2026 | $208.57B | +20.3% | Precedence Research |
| 2030 | $314.26B – $498.99B | CAGR 14.5% – 17.5% | Multiple Sources |
| 2035 | $1,051.93B | CAGR 19.76% | Precedence Research |
Regional Market Breakdown
The payment processing landscape varies significantly by geography, with distinct growth patterns, regulatory environments, and consumer preferences shaping each region. According to The Business Research Company, Asia-Pacific was the largest regional market in 2025, accounting for approximately 42% of global payment processing revenue. This dominance is driven by massive populations, rapid smartphone adoption, and the proliferation of mobile wallet solutions in countries like China, India, and Southeast Asian markets.
North America represents the second-largest market, with Grand View Research projecting the region to reach $43.93 billion by 2030. The United States, in particular, leads in payment innovation, real-time payment adoption through The Clearing House’s RTP network, and merchant services technology. However, U.S. merchants also face the highest processing fees globally, with total merchant card processing fees estimated at up to $172 billion annually according to IntelliPay.
Europe maintains a strong position with approximately 18% of global market share, characterized by robust regulatory frameworks including PSD2 and increasing cross-border payment integration. The European Central Bank reports that e-money payment transactions within the euro area reached 4.7 billion in the first half of 2025, representing a 10.7% increase compared to the same period in the previous year.
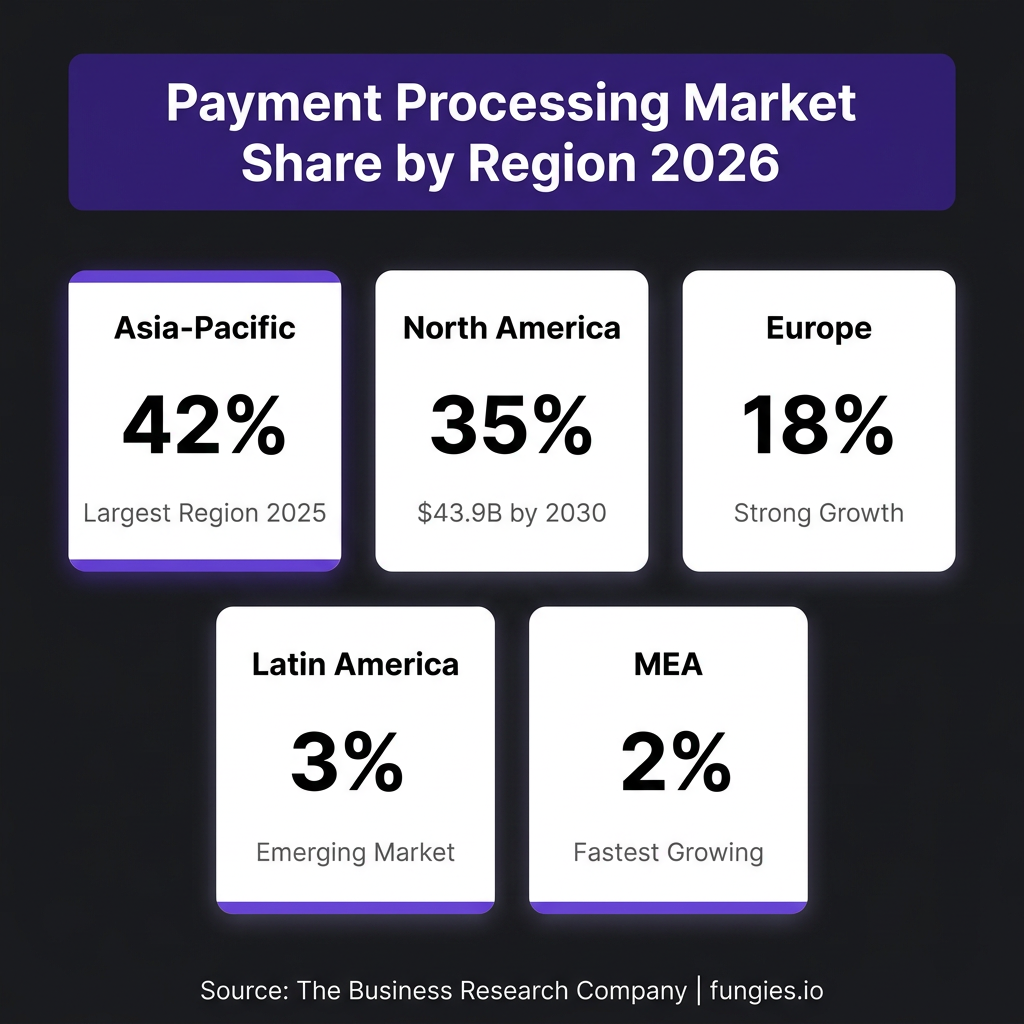
| Region | Market Share (2025) | Key Characteristics | Projected CAGR |
|---|---|---|---|
| Asia-Pacific | ~42% | Largest market, mobile-first adoption | 18-22% |
| North America | ~35% | $43.9B by 2030, highest fees globally | 11-14% |
| Europe | ~18% | Strong regulation, cross-border focus | 12-15% |
| Latin America | ~3% | Emerging market, high growth potential | 20-25% |
| MEA | ~2% | Fastest growing, financial inclusion focus | 25-30% |
Key Players & Market Share
The payment processing industry features a competitive landscape dominated by several major players, each with distinct strengths and market positions. According to Forrester’s latest evaluation, Stripe, Adyen, and Fiserv lead the merchant payment provider space, while each vendor offers competitive solutions with specific strengths tailored to different merchant segments.
Stripe has emerged as a dominant force in online payment processing, commanding between 20.8% and 29% of the global online payment processing market according to industry studies. In the U.S. market specifically, Stripe’s share reaches approximately 45%, making it the preferred choice for technology companies and developers. The company processed approximately $1.9 trillion in total payment volume in 2025, representing 34% year-over-year growth.
PayPal maintains a strong global position with approximately 43.4% market share in online payments, serving over 36 million merchants across 200 markets. The company’s total payment volume reached $437.8 billion in Q4 2024, up 7% year-over-year. PayPal’s ecosystem includes Venmo, Xoom, and Zettle, providing comprehensive coverage across consumer and merchant segments.
Adyen, the Dutch payment company, reported processing volume growth of 8% to $1.6 trillion in 2025. While smaller than Stripe in absolute terms, Adyen maintains strong positions among enterprise merchants and has built a reputation for unified commerce solutions across online, in-store, and mobile channels.
| Company | 2025 TPV/Volume | Market Position | Key Strength |
|---|---|---|---|
| Stripe | $1.9 trillion | 20.8-29% global online | Developer experience, tech companies |
| PayPal | $437.8B (Q4 TPV) | 43.4% global online | Consumer trust, merchant scale |
| Adyen | $1.6 trillion | Enterprise leader | Unified commerce, global coverage |
| Visa | $15.6 trillion | 65% of global card transactions | Network scale, cross-border |
| Mastercard | Growing share | Nearing Visa in Europe | Innovation, partnerships |
At the card network level, Visa maintains its position as the world’s largest credit card processor with 4.48 billion cards active worldwide and processing approximately 65% of global retail card transactions by volume. However, Mastercard has been gaining ground, particularly in Europe where it processed marginally more transactions than Visa in Q2 2025 for the first time.
Industry Benchmarks & KPIs
Understanding payment processing benchmarks is essential for merchants optimizing their payment operations and for providers evaluating their competitive position. According to WalletHub, credit card processing fees generally ranged from 1.15% to 3.30% of each transaction amount in 2025, with significant variation based on transaction type, card brand, and merchant category.
Retail businesses typically pay the lowest processing fees (1.3-2.7%) due to lower fraud risk in card-present transactions. E-commerce merchants face higher rates, generally ranging from 1.5% to 3.5% per transaction, reflecting the increased risk profile of card-not-present transactions. U.S. merchants specifically face the highest acceptance costs globally, with interchange fees ranging from 1.8% to 8% per transaction according to IntelliPay.
Authorization rates represent another critical benchmark, indicating the percentage of payment attempts that are successfully approved. Industry averages vary by sector and payment method, but top-performing merchants achieve authorization rates above 90%. According to CatalystPay, monitoring authorization rates helps merchants identify technical issues, fraud problems, or customer experience friction that may be causing legitimate transactions to fail.
| Benchmark | Industry Average | Range | Notes |
|---|---|---|---|
| Processing Fees (Retail) | 1.8-2.5% | 1.3-2.7% | Card-present transactions |
| Processing Fees (E-commerce) | 2.2-2.9% | 1.5-3.5% | Card-not-present transactions |
| U.S. Interchange Fees | 2.2% | 1.8-8% | Highest globally |
| Authorization Rate | 85-90% | 80-95% | Varies by industry |
| Chargeback Ratio | 0.6-0.9% | 0.5-1.0% | Above 1% is high risk |
| Payment Conversion Rate | 65-75% | 50-85% | Completed vs. attempted |
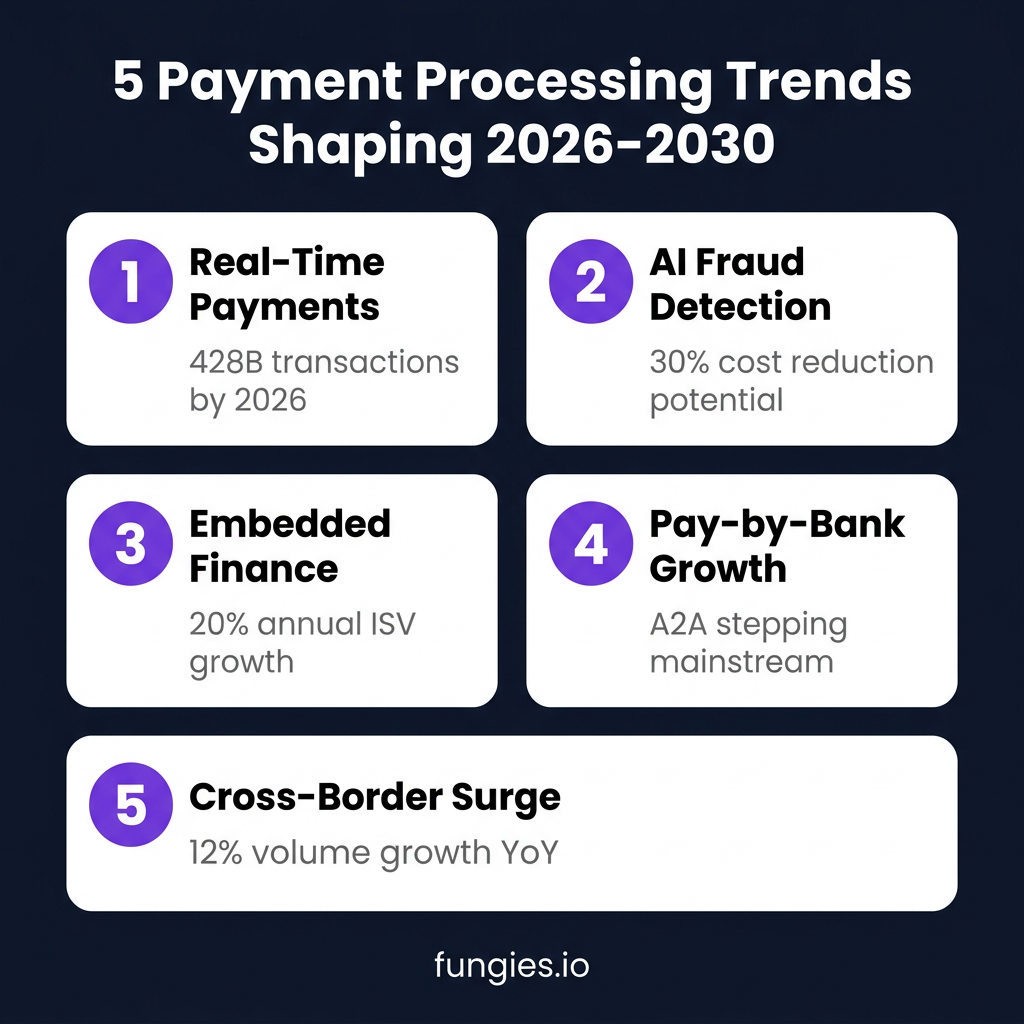
Trends & Predictions: 2026-2030
The payment processing industry is undergoing rapid transformation, with several key trends shaping the landscape through 2030. Based on research from J.P. Morgan, Mastercard, and industry analysts, here are the five most significant developments to watch:
1. Real-Time Payments Go Global
Real-time payment (RTP) systems are expanding rapidly across markets. According to RedCompass Labs, almost 428 billion real-time payment transactions are expected annually by 2026, representing over 25% of all global electronic payments. The U.S. real-time payments market is estimated at $0.46 billion in 2026, growing from $0.33 billion in 2025. The Clearing House’s RTP network continues to expand its participating financial institutions and use cases, while the Federal Reserve’s FedNow service is accelerating adoption among smaller banks and credit unions.
2. AI-Powered Fraud Detection
Artificial intelligence is transforming fraud prevention in payment processing. According to Airwallex, AI applications in automation and fraud detection can potentially reduce costs by 30%. Mastercard processes nearly 160 billion transactions annually and leverages these insights to deliver personalized content and tailored fraud prevention measures. Machine learning models can now identify suspicious patterns in real-time, reducing false declines while catching more fraudulent transactions.
3. Embedded Finance Expansion
Embedded finance—integrating financial services into non-financial platforms—is becoming mainstream. According to McKinsey, payment-processing revenue through Independent Software Vendors (ISVs) in the United States has grown at 20% annually for the last five years. This trend allows SaaS companies, marketplaces, and platforms to offer payment services directly to their customers, creating new revenue streams and improving user experience. Fungies.io exemplifies this trend by providing embedded payment and tax compliance solutions for game developers and SaaS companies.
4. Pay-by-Bank and A2A Payments
Account-to-account (A2A) payments are stepping into the mainstream as an alternative to card-based transactions. According to Zimpler, pay-by-bank delivers on speed, cost efficiency, and security, positioning it as one of the most important payment trends for 2026. Open banking regulations in Europe and similar frameworks emerging in other regions are enabling direct bank transfers that bypass traditional card networks, potentially reducing processing costs for merchants.
5. Cross-Border Payment Innovation
Cross-border payment volumes continue to surge, with Visa reporting 12% growth in cross-border volumes in Q4 2025 in constant currency terms, and 13% growth for the full financial year. Growth in cross-border e-commerce and sustained post-pandemic travel are propelling demand. While 75% of international payments now reach the beneficiary bank within 10 minutes, the final leg—crediting the end customer—still accounts for over 80% of total transaction time, representing an opportunity for further innovation.
Methodology & Data Sources
This report was compiled using a comprehensive research methodology combining primary and secondary sources. Market size figures were cross-referenced across multiple research firms including Precedence Research, Grand View Research, Mordor Intelligence, The Business Research Company, and GM Insights to establish consensus ranges and identify outliers.
Company-specific data was sourced from official earnings reports, press releases, and verified industry publications. Regional breakdowns incorporate data from central banks, including the European Central Bank and Federal Reserve, alongside commercial research. All statistics are current as of June 2026 and reflect the most recently available data from each source.
Limitations include variations in market definition across research firms—some focusing narrowly on payment processing software while others include broader payment services. Readers should consider these definitional differences when comparing figures across sources. Projections are based on analyst models and should be treated as informed estimates rather than certainties.
Frequently Asked Questions
What is the size of the payment processing market in 2026?
The global payment processing solutions market is projected to reach $208.57 billion in 2026, according to Precedence Research. Alternative estimates from The Business Research Company place the market at $140.63 billion in 2025, with variations reflecting different market definitions and scope boundaries.
What is the average credit card processing fee in 2026?
Credit card processing fees typically range from 1.5% to 3.5% per transaction, with retail businesses paying lower rates (1.3-2.7%) and e-commerce merchants paying higher rates (1.5-3.5%) due to increased fraud risk. U.S. merchants face the highest fees globally, with interchange ranging from 1.8% to 8%.
Which region has the largest payment processing market?
Asia-Pacific holds the largest share of the global payment processing market at approximately 42%, driven by massive populations, rapid smartphone adoption, and mobile wallet proliferation in China, India, and Southeast Asia. North America follows with approximately 35% market share.
Who are the leading payment processing companies?
The leading payment processing companies include Stripe (20.8-29% global online market share), PayPal (43.4% global online market share), Adyen (enterprise leader), Visa (65% of global card transactions), and Mastercard (growing share, particularly in Europe). Fiserv, Square/Block, and Worldpay also hold significant positions.
What is driving growth in the payment processing industry?
Key growth drivers include: (1) continued e-commerce expansion, (2) real-time payment adoption, (3) embedded finance integration, (4) mobile wallet proliferation, (5) cross-border commerce growth, and (6) AI-powered fraud prevention. The market is projected to grow at a 19.76% CAGR from 2026 to 2035, reaching over $1 trillion.
Sources & Citations
- Precedence Research – Payment Processing Solutions Market Report 2026: https://www.precedenceresearch.com/payment-processing-solutions-market
- Mordor Intelligence – Payment Processor Market Size & Share Analysis: https://www.mordorintelligence.com/industry-reports/payment-processor-market
- The Business Research Company – Payment Processing Solutions Global Market Report: https://www.thebusinessresearchcompany.com/report/payment-processing-solutions-global-market-report
- Grand View Research – Payment Processing Solutions Market Size Report: https://www.grandviewresearch.com/industry-analysis/payment-processing-solutions-market
- Airwallex – 32 Payment Processing Industry Statistics 2025: https://www.airwallex.com/us/blog/payment-processing-industry-statistics
- Research and Markets – Payment Processors Market Analysis 2026-2031: https://finance.yahoo.com/news/payment-processors-market-analysis-growth-105900845.html
- IntelliPay – U.S. Merchants Pay Highest Acceptance Costs 2025: https://intellipay.com/u-s-merchants-pay-highest-acceptance-costs
- WalletHub – Average Credit Card Processing Fees 2026: https://wallethub.com/edu/cc/average-credit-card-processing-fees/138461
- RedCompass Labs – Real-Time Payments Insights: https://www.redcompasslabs.com/insights/real-time-payments
- Capital One Shopping – Stripe Market Share 2026: https://redstagfulfillment.com/what-is-the-market-share-of-stripe
- Chargeflow – PayPal Statistics 2025: https://www.chargeflow.io/blog/paypal-statistics-facts
- European Central Bank – Payments Statistics H1 2025: https://www.ecb.europa.eu/press/stats/paysec/html/ecb.pis2025h1~36edd636c8.en.html
- J.P. Morgan – Payments Outlook: Five Trends Powering Payments in 2026: https://www.jpmorgan.com/insights/payments/trends-innovation/payments-outlook-trends-2026
- Mastercard – The Future of Payments: Six Industry Trends Shaping 2026: https://www.mastercard.com/us/en/news-and-trends/stories/2025/2026-payment-trends.html
- Gr4vy – Global Payment Trends for 2026 and 2027: https://gr4vy.com/posts/global-payment-trends-for-2026-and-2027-whats-changing-next
- Forrester – Merchant Payment Processing Evaluation: https://www.forrester.com/blogs/merchant-payment-processing-champion-challenger-models-make-vendors-earn-their-volume
- McKinsey – Decoding ISV Maturity: A Global Playbook for Payments Growth: https://www.mckinsey.com/industries/financial-services/our-insights/decoding-isv-maturity-a-global-playbook-for-payments-growth