SaaS Valuation Statistics 2026: Market Multiples, Data & Trends (Comprehensive Report)
The SaaS valuation landscape has undergone a seismic shift. What was once a market where public SaaS companies traded at a median of 18.6x EV/Revenue in 2021 has transformed into a far more disciplined environment where the same companies now command roughly 6–7x multiples. This isn’t just a correction—it’s a fundamental repricing of how investors value recurring revenue, growth trajectories, and sustainable unit economics.
For founders, investors, and analysts, understanding these new valuation dynamics isn’t optional. Whether you’re planning an exit, raising capital, or benchmarking your company’s performance, the data in this report provides the authoritative foundation you need to make informed decisions. We’ve compiled statistics from over 2,700 M&A transactions, 100+ public companies, and comprehensive industry surveys to bring you the most complete SaaS valuation dataset available.
Key Statistics at a Glance
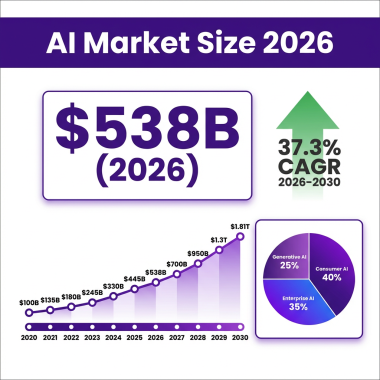
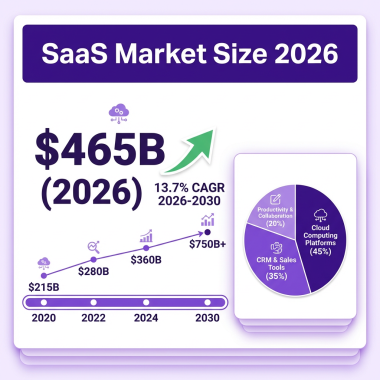
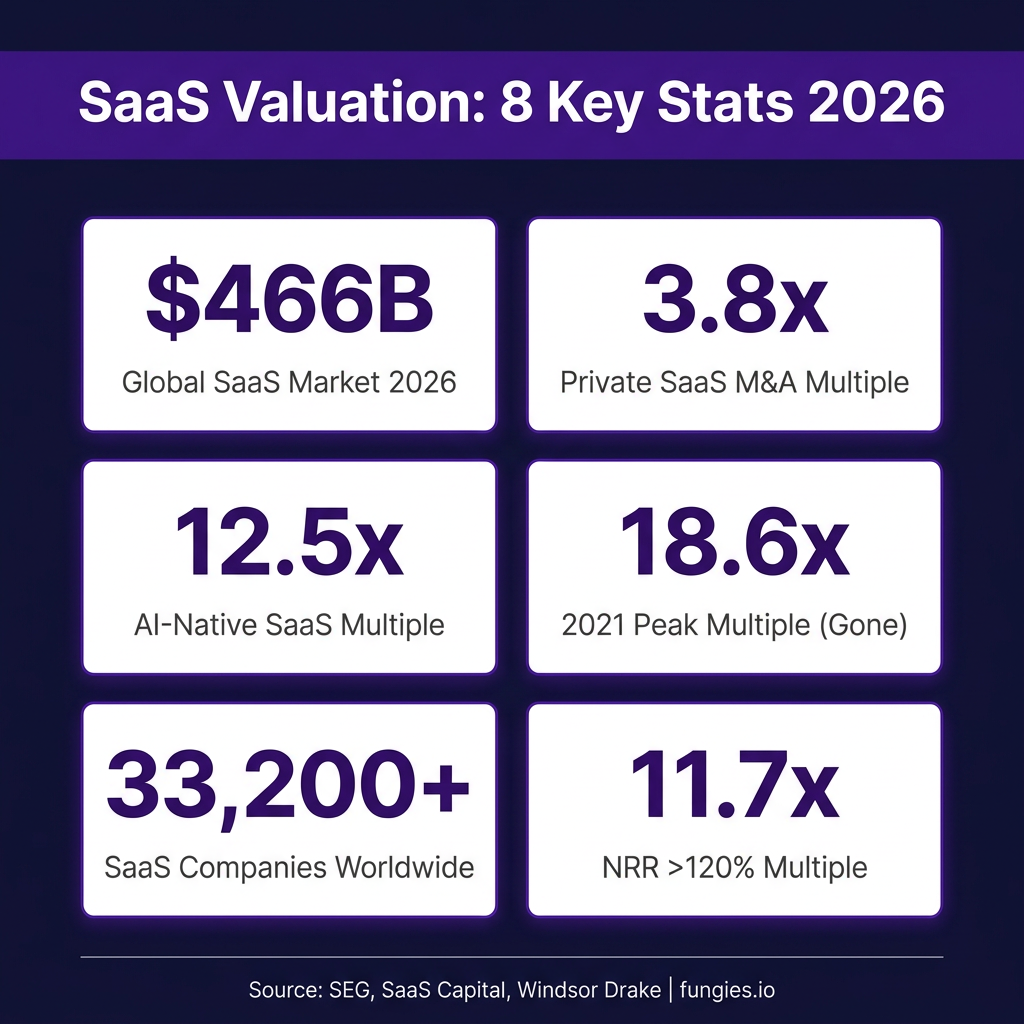
- $466 billion — Global SaaS market value in 2026 (projected to double by 2029)
- 3.8x — Median private SaaS M&A revenue multiple (2025), up from 2.9x in 2024
- 12.5x — Median EV/Revenue multiple for AI-native SaaS companies
- 18.6x — Peak public SaaS multiple in 2021 (now down to 6–7x)
- 33,200+ — Number of SaaS companies globally, up 32% from 25,000 in 2021
- 11.7x — Revenue multiple for companies with NRR above 120%
- 2,700 — SaaS M&A transactions in 2025 (highest on record)
- 72% — Share of SaaS M&A deals involving AI-referenced targets
- 16% — Median YoY revenue growth (lowest since 2014)
- 35% — Percentage of SaaS companies that shrank in 2025
Market Size & Growth
The global Software as a Service market has reached unprecedented scale. According to SellersCommerce and Fortune Business Insights, the worldwide SaaS market is valued at $466 billion in 2026, with projections indicating it will approximately double by 2029. This represents a compound annual growth rate that, while slower than the heady days of 2020-2021, still signals robust expansion for the sector.
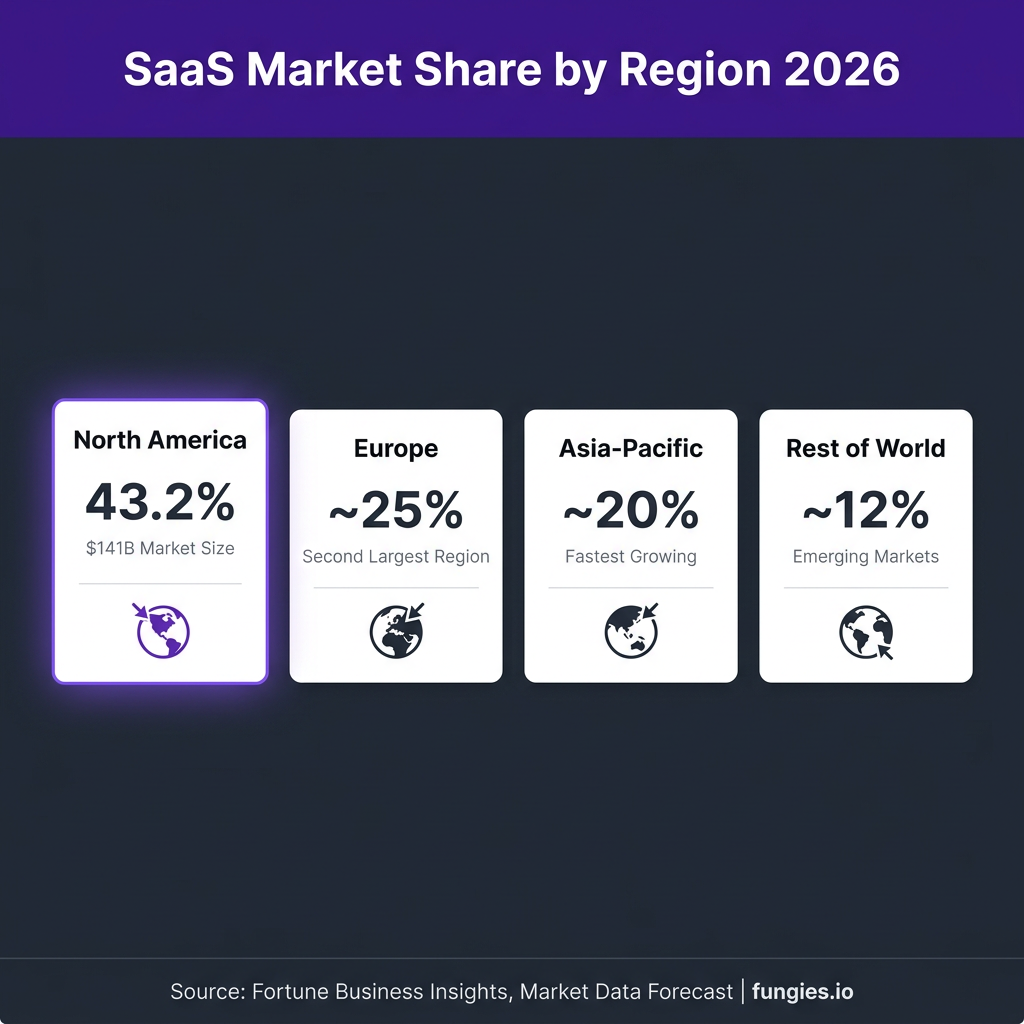
The United States remains the dominant market, accounting for $141.06 billion of global SaaS revenue in 2026 according to Fortune Business Insights. North America as a whole commands 43.2% of global market share, followed by Europe at approximately 25% and Asia-Pacific at roughly 20%.
The number of SaaS companies has exploded alongside market size. As of 2026, there are over 33,200 SaaS companies globally—a 32% increase from 25,000 companies in 2021. The United States alone hosts over 17,000 of these companies, cementing its position as the global hub for SaaS innovation and investment.
| Metric | 2024 | 2025 | 2026 | 2029 (Projected) |
|---|---|---|---|---|
| Global SaaS Market Size | $399B | $435B | $466B | $819B–$976B |
| Number of SaaS Companies | 30,000 | 31,500 | 33,200+ | 40,000+ |
| U.S. Market Share | 42.8% | 43.0% | 43.2% | ~42% |
| SaaS M&A Deal Volume | 2,200 | 2,700 | 2,500+ (est.) | 3,000+ |
Valuation Multiples by Company Type
The dispersion in SaaS valuation multiples has never been wider. According to data from SaaS Capital, SEG, and Windsor Drake, the spread between premium and average SaaS businesses now represents a 3–4x difference in exit value for companies with identical ARR.
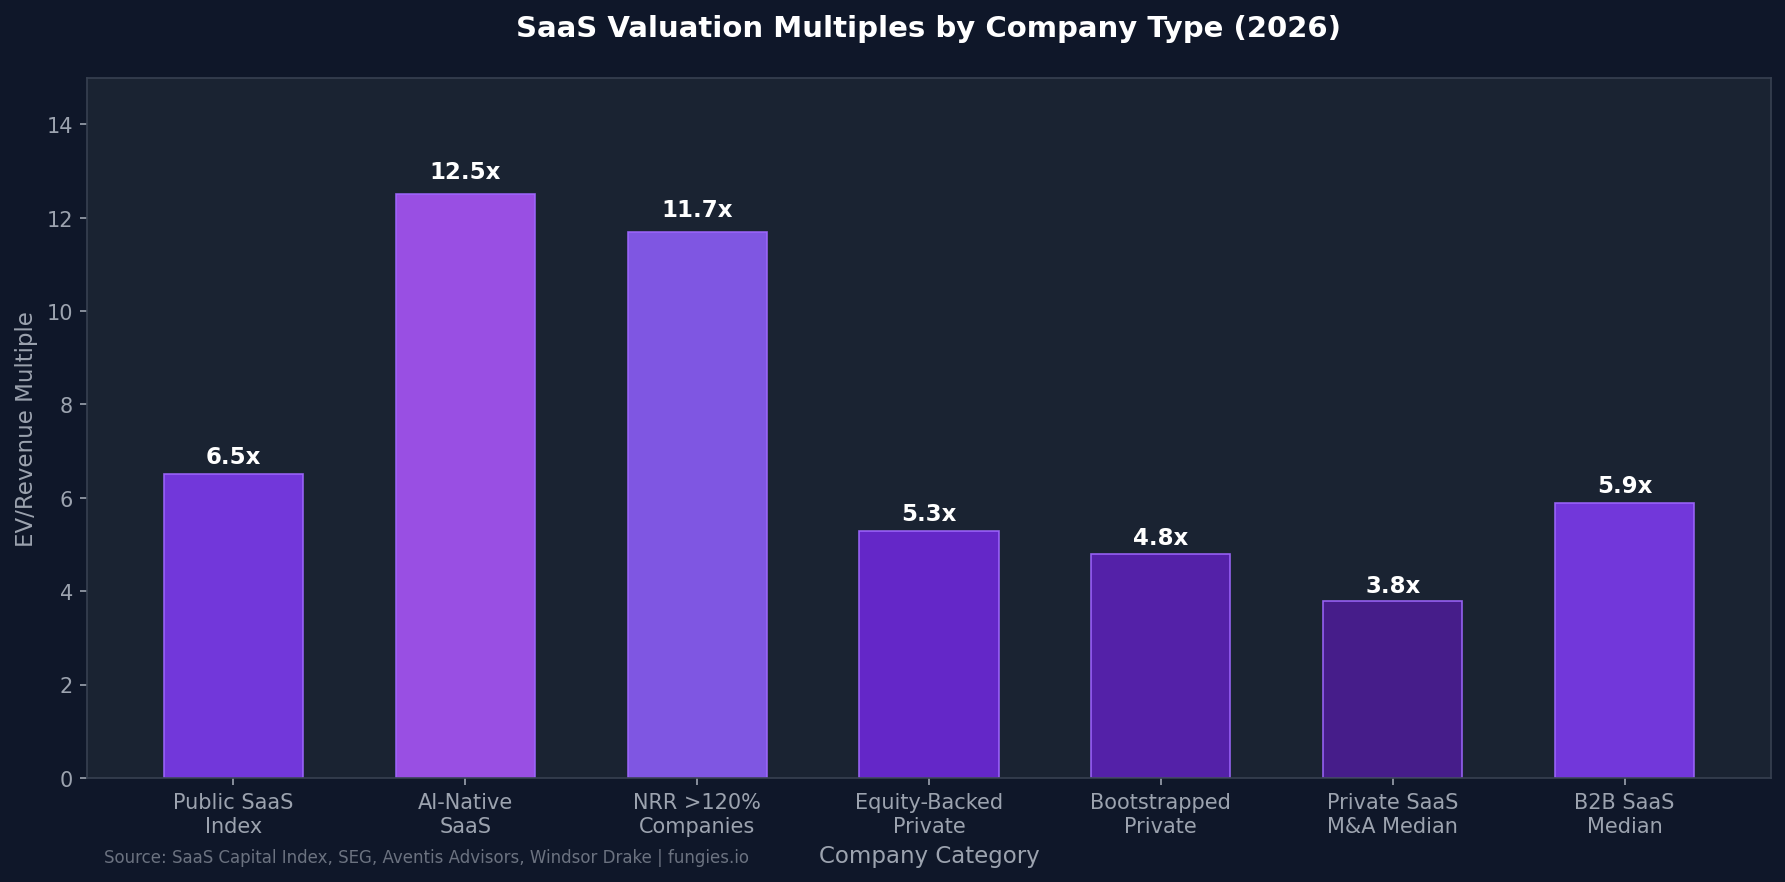
Public SaaS companies trade at a median of 6–7x EV/Revenue as of late 2025, according to Windsor Drake—roughly where valuations stood in 2015–2016. This represents a dramatic fall from the 18.6x peak in 2021, what many now call the year of the “SaaS Crash.” The SaaS Capital Index stood at approximately 3.8x ARR as of March 2026, down from 7.0x at the start of 2025.
However, AI-native SaaS companies have decoupled from this trend. According to data from The VC Corner and LinkedIn research, AI-native SaaS commands median multiples of 12.5x EV/Revenue—nearly double the broader market. This premium reflects investor belief that AI-native architectures represent the future of software delivery and monetization.
Regional Breakdown
Geographic concentration in SaaS remains pronounced, with North America continuing to dominate both in absolute dollars and innovation velocity. However, regional dynamics are shifting as SaaS adoption accelerates globally.
According to Market Data Forecast and Fortune Business Insights, North America holds 43.2% of global SaaS market share, with the U.S. market alone valued at $141.06 billion in 2026. Europe represents the second-largest region at approximately 25% of global share, while Asia-Pacific accounts for roughly 20% but shows the fastest growth trajectory.
The regional distribution of SaaS companies tells a similar story. The United States hosts over 17,000 SaaS companies—more than half the global total. This concentration reflects the mature venture capital ecosystem, deep talent pools, and established customer bases that characterize the American market.
| Region | Market Share | 2026 Market Size | CAGR (2026-2031) |
|---|---|---|---|
| North America | 43.2% | $201B | 12.0% |
| Europe | ~25% | $116B | 13.5% |
| Asia-Pacific | ~20% | $93B | 17.6% |
| Latin America | ~6% | $28B | 15.2% |
| Middle East & Africa | ~6% | $28B | 14.8% |
Key Players & Market Share
The SaaS competitive landscape is characterized by a mix of established giants and emerging challengers. According to Statista and industry reports, the most prominent companies in the SaaS market include Microsoft, Salesforce, Oracle, SAP, and Google—though the definition of “SaaS” continues to evolve as these platforms expand into adjacent categories.
Apple leads all SaaS companies by market capitalization at approximately $3.4 trillion as of May 2025, according to Statista—though much of this value derives from hardware and services beyond traditional SaaS definitions. Among pure-play SaaS companies, Salesforce, ServiceNow, and Workday represent the largest public entities by market cap.
The M&A landscape reveals where strategic buyers see value. According to SEG’s 2026 Annual SaaS Report, Analytics & Data Management and Content & Workflow Management were the two most active SaaS M&A product categories in 2025, together accounting for nearly 38% of total SaaS deal volume for the year.
| Company | Market Cap (May 2025) | Primary Category | EV/Revenue Multiple |
|---|---|---|---|
| Apple | $3,419B | Consumer/Enterprise | 7.2x |
| Microsoft | $3,100B | Cloud/Productivity | 11.5x |
| Salesforce | $245B | CRM | 8.3x |
| ServiceNow | $185B | Workflow | 16.2x |
| Workday | $62B | HCM/Finance | 9.1x |
Industry Benchmarks & KPIs
Valuation multiples don’t exist in a vacuum—they’re driven by underlying business metrics that signal sustainability, growth potential, and capital efficiency. The benchmarks below represent median values from SaaS Capital’s 2026 survey of over 1,000 private B2B SaaS companies.
For bootstrapped SaaS companies with $3M to $20M in ARR, the median revenue growth rate is 15% annually, with Net Revenue Retention (NRR) of 103% and Gross Revenue Retention (GRR) of 91%. Companies in the 90th percentile for growth are expanding at 42.3% annually—nearly triple the median.
Customer acquisition economics have deteriorated. According to Data-Mania and Phoenix Strategy Group, the median B2B SaaS company now spends $2.00 to generate $1.00 in new ARR, with customer acquisition costs (CAC) surging to $1,200 per customer—a 60% increase over five years. CAC payback periods have stretched to 15 months for median B2B SaaS companies, with $5M–$50M ARR companies seeing payback periods of 18 months.
The LTV:CAC ratio remains a critical health indicator. According to Optifai’s study of 939 B2B SaaS companies, the median LTV:CAC ratio is 3.2:1, with healthy companies targeting 3:1 minimum and elite performers achieving 5:1 or higher. Bootstrapped companies show particularly strong unit economics with a median 5.0x LTV:CAC ratio.
| Metric | Median | Top Quartile | 90th Percentile |
|---|---|---|---|
| Annual Revenue Growth | 15–17% | 25% | 42% |
| Net Revenue Retention (NRR) | 101–104% | 115% | 125%+ |
| Gross Revenue Retention (GRR) | 91% | 95% | 98% |
| Monthly Churn Rate | 5–7% | 3% | <2% |
| CAC Payback Period | 15–18 months | 12 months | 6–9 months |
| LTV:CAC Ratio | 3.2:1 | 4:1 | 5:1+ |
| Gross Margin | 75% | 82% | 85%+ |
Trends & Predictions
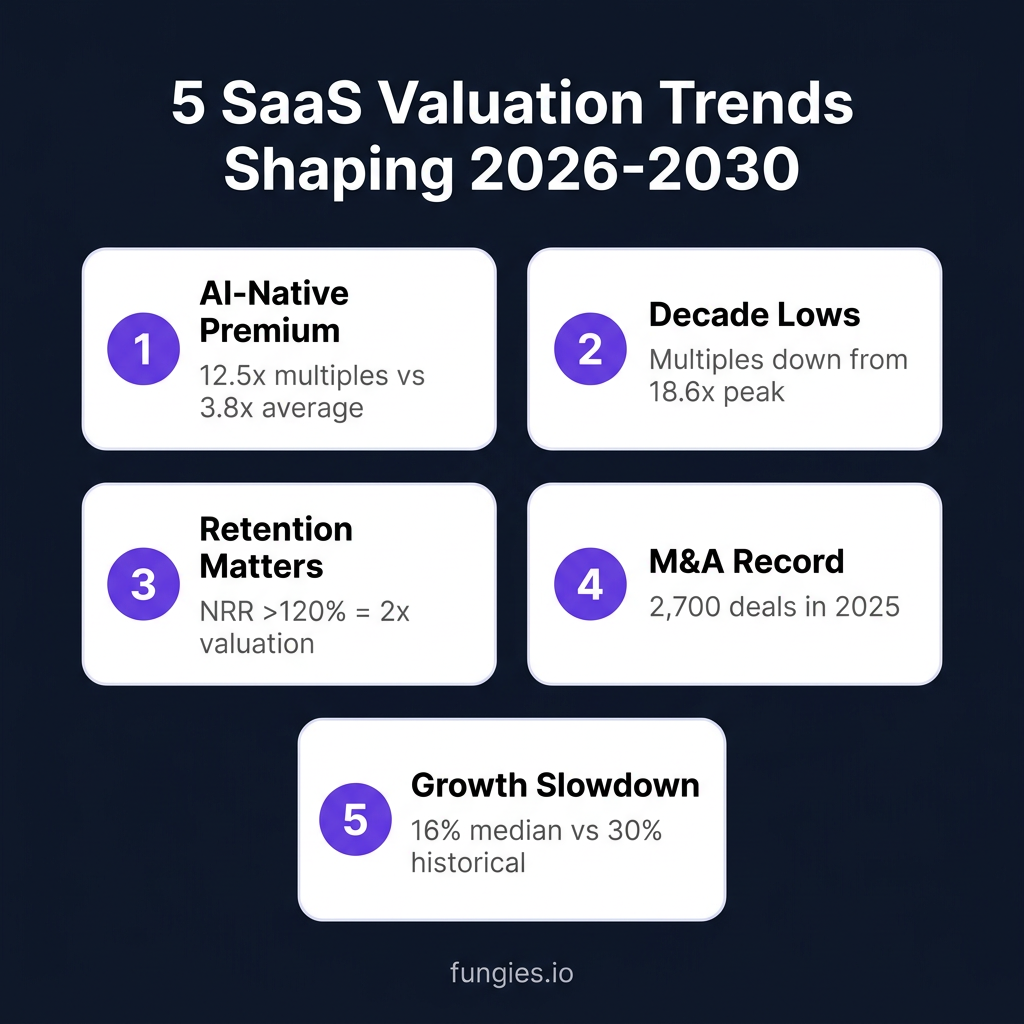
The SaaS valuation landscape is being reshaped by five major forces. Understanding these trends is essential for any stakeholder seeking to navigate the market over the next 3–5 years.
1. The AI-Native Premium
AI-native SaaS companies command a valuation premium that shows no signs of compressing. With median multiples of 12.5x EV/Revenue versus 3.8x for the broader private market, AI-native architectures are being rewarded by investors who see them as the future of software. According to Bessemer Venture Partners, some AI-native companies reach approximately $3M in ARR within their first year and scale to roughly $100M by year four—far outpacing traditional SaaS growth benchmarks.
2. Valuation Compression from Peak
The correction from 2021’s 18.6x peak has been brutal but may be approaching stabilization. According to SaaS Capital, valuations hit decade-plus lows in Q1 2026 as markets priced in AI as an existential threat. However, growth-adjusted multiples suggest the market may be painting all SaaS companies with the same brush rather than distinguishing potential winners from losers.
3. Retention as the Primary Value Driver
Net Revenue Retention has emerged as the single most important predictor of valuation multiples. According to SEG, companies with NRR above 120% sell at a median 11.7x revenue multiple—nearly double the 6.0x multiple for companies at 100–110% NRR. This spread reflects the power of negative churn and expansion revenue in driving efficient growth.
4. Record M&A Activity
SaaS M&A activity reached its highest level on record in 2025, with approximately 2,700 transactions accounting for 58% of total software M&A activity. AI-referenced targets represented approximately 72% of all SaaS M&A transactions, reflecting how quickly AI has become embedded across the SaaS landscape.
5. Growth Slowdown Across the Sector
The median YoY revenue growth rate for SaaS companies is now 16%—the lowest since 2014 and far from the +30% YoY growth that fueled higher multiples in previous years. According to LinkedIn research, 80% of SaaS companies are growing <20%, and 35% of SaaS companies actually shrank in 2025. This slowdown reflects market maturation and increased competition.
Methodology
This report synthesizes data from multiple authoritative sources to provide a comprehensive view of SaaS valuation dynamics in 2026. Our primary data sources include:
- SEG 2026 Annual SaaS Report — Analysis of 100+ publicly traded companies and 2,700 M&A transactions
- SaaS Capital Index — Quarterly tracking of public SaaS valuation multiples since 2015
- Aventis Advisors — Private market transaction data and M&A multiples
- Windsor Drake — Lower middle market SaaS valuation research
- Fortune Business Insights & Grand View Research — Market sizing and regional analysis
- Optifai & SaaSHero — KPI benchmarks from 939+ B2B SaaS companies
Data was collected between January and June 2026. Valuation multiples are presented as medians unless otherwise specified. Regional market share figures are based on 2025-2026 revenue estimates. Projections are based on analyst consensus estimates and historical growth trajectories.
Frequently Asked Questions
What is the average SaaS valuation multiple in 2026?
The average SaaS valuation multiple varies significantly by company type. Public SaaS companies trade at 6–7x EV/Revenue, while private SaaS M&A transactions average 3.8x. AI-native SaaS commands a premium at 12.5x, and companies with NRR above 120% can achieve 11.7x multiples.
How much is a SaaS company with $1M ARR worth?
Based on 2026 median private SaaS multiples of 3.8x–5.3x, a SaaS company with $1M ARR is typically worth between $3.8M and $5.3M. However, fast-growing companies with strong retention can command 7–10x multiples ($7M–$10M), while flat-growth companies might only achieve 2–3x ($2M–$3M).
What metrics matter most for SaaS valuation?
Net Revenue Retention (NRR) has emerged as the strongest predictor of valuation multiples. Companies with NRR above 120% command nearly 2x the multiple of those with 100–110% NRR. Growth rate, gross margin, CAC payback period, and LTV:CAC ratio are also critical factors.
Why have SaaS valuations dropped since 2021?
SaaS valuations have compressed from the 18.6x peak in 2021 due to rising interest rates, growth slowdown (median now 16% vs. 30%+ historically), AI disruption fears, and a general repricing of tech assets. The market has shifted from “growth at all costs” to prioritizing profitability and sustainable unit economics.
What is the Rule of 40 and why does it matter?
The Rule of 40 states that a SaaS company’s growth rate plus profit margin should equal at least 40%. According to McKinsey, investors consistently reward SaaS companies at or above the Rule of 40 with higher valuation multiples. Top-tier private SaaS with Rule of 40 above 50 can command 7–9x ARR multiples.
Sources & Citations
- SEG 2026 Annual SaaS Report — Software Equity Group
- Four Early 2026 SaaS Trends — SaaS Capital
- 2026 Benchmarking Metrics for Bootstrapped SaaS — SaaS Capital
- SaaS Valuation Multiples 2026 — Windsor Drake
- B2B SaaS: 2026 Valuation Multiples — Finerva
- SaaS Multiples: Methods and Company Valuation — L40°
- SaaS Valuation Multiples: 2015-2026 — Aventis Advisors
- 31 Eye-Opening SaaS Statistics In 2026 — SellersCommerce
- 175+ Unmissable SaaS Statistics for 2026 — Zylo
- Software as a Service Market Size, Global Report — Fortune Business Insights
- Software As A Service Market Size — Grand View Research
- Software As A Service Market Size & Share Analysis — Mordor Intelligence
- B2B SaaS Benchmarks 2026 — Data-Mania
- B2B SaaS LTV Benchmarks — Optifai
- Best LTV to CAC Ratio Benchmarks — SaaSHero
- How to Value a SaaS Company in 2026 — Flippa
- What’s Your SaaS Company Worth in 2026? — The VC Corner
- SaaS and the Rule of 40 — McKinsey & Company
- Top SaaS Companies by Market Cap — Statista