Fraud Management Statistics 2026: Market Size, Data & Trends (Comprehensive Report)
Global fraud losses reached an estimated $1 trillion in 2025, with businesses losing an average of 7.7% of their annual revenue to fraudulent activities. As digital commerce accelerates and payment methods diversify, fraud management has evolved from a back-office compliance function to a strategic business imperative. This comprehensive report examines the fraud management landscape through verified data, market analysis, and emerging trends that will shape the industry through 2030.
Key Statistics at a Glance
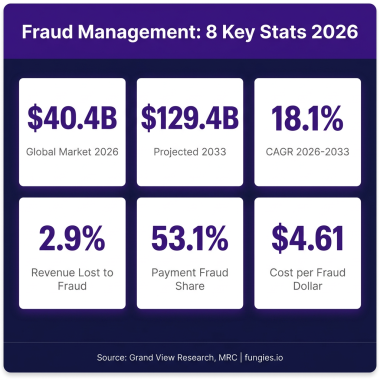
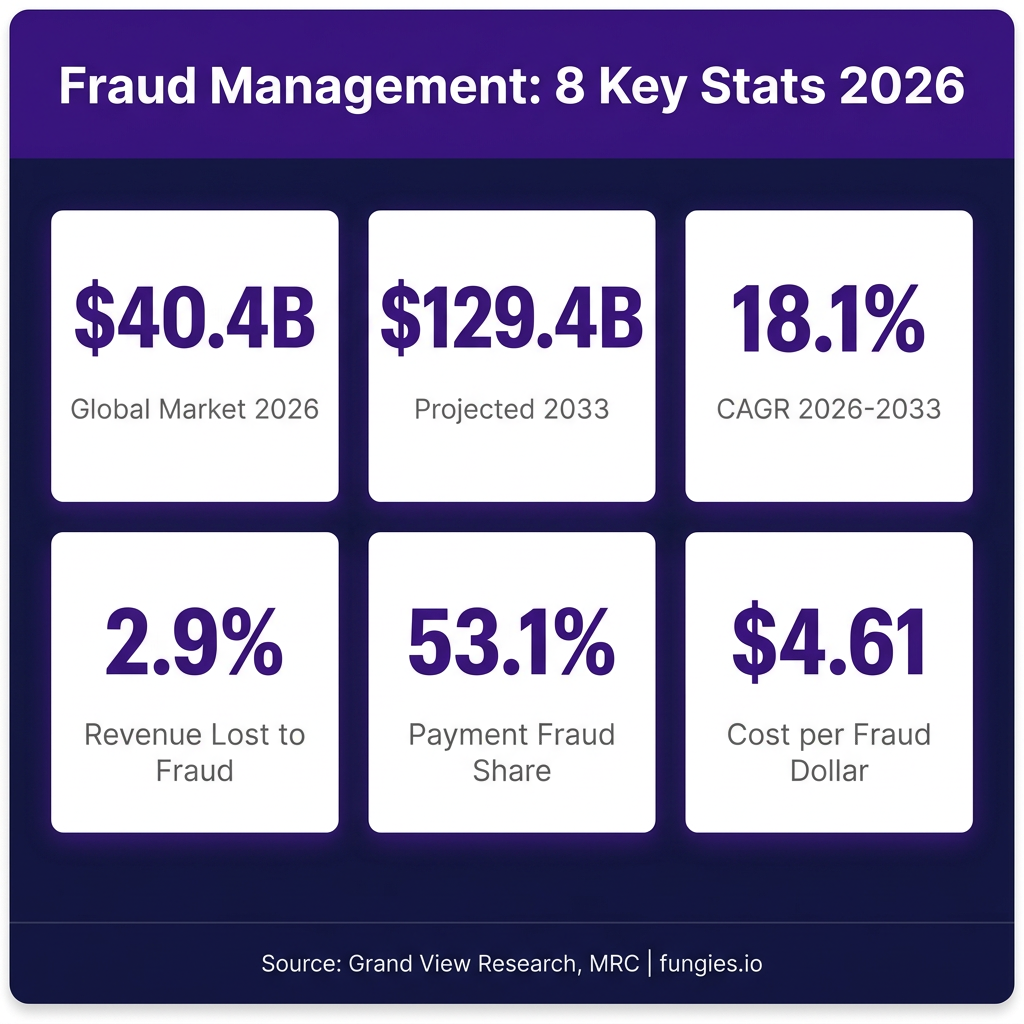
- The global fraud detection and prevention market reached $35.3 billion in 2025 and is projected to hit $40.4 billion in 2026
- By 2033, the market will reach $129.4 billion, growing at a CAGR of 18.1%
- Payment fraud accounts for 53.1% of all fraud detection market revenue
- E-commerce merchants globally lose 2.9% of revenue to payment fraud (down from 3.6% in 2022)
- U.S. merchants face 10% of global chargeback volume, losing $4.61 for every dollar of fraud
- The average merchant now faces 3.7 distinct fraud attack types (down from 4.2 in 2024)
- Refund and policy abuse has overtaken payment fraud as the #1 ranked fraud threat in e-commerce
- Fraud rates by order dropped from 3.4% to 3.0% in 2025 according to MRC data
Market Size & Growth Analysis
The fraud detection and prevention market demonstrates robust growth driven by escalating cybercrime sophistication, regulatory pressure, and the continued expansion of digital payments. According to Grand View Research, the market stood at $35.3 billion in 2025 and will expand to $40.4 billion in 2026—a year-over-year increase of 14.4%.
Looking ahead, the trajectory remains steep. By 2033, industry analysts project the market will reach $129.4 billion, representing a compound annual growth rate (CAGR) of 18.1% from 2026 to 2033. This growth significantly outpaces many other enterprise software categories, reflecting the critical nature of fraud prevention infrastructure.
Alternative market sizing from Coherent Market Insights presents an even more aggressive forecast, estimating the fraud detection market at $52.06 billion in 2026, growing to $146.25 billion by 2033 at a 15.9% CAGR. Mordor Intelligence positions their 2025 estimate at $55.98 billion, projecting $171.84 billion by 2031 with a 19.61% CAGR. These variations reflect different segment definitions and geographic scopes, but all confirm explosive market expansion.
Global Fraud Detection Market Size Forecast
| Year | Market Size (USD Billion) | Growth Rate |
|---|---|---|
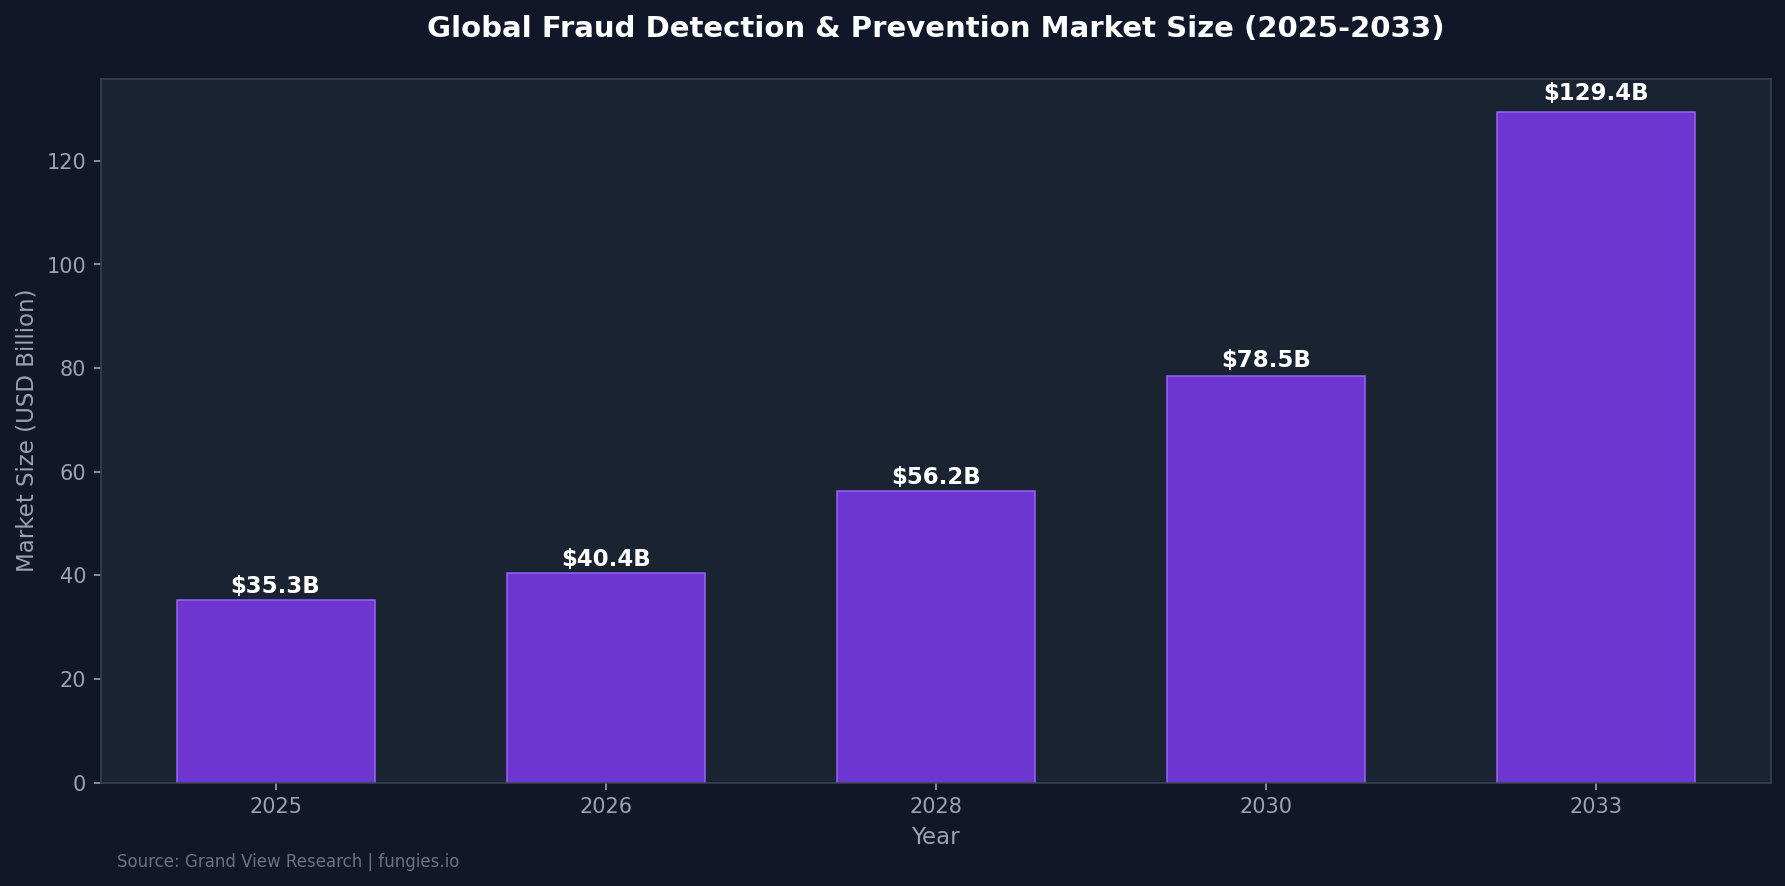
| 2025 | $35.3B | Baseline |
| 2026 | $40.4B | +14.4% |
| 2028 | $56.2B | +19.3% (est.) |
| 2030 | $78.5B | +19.7% (est.) |
| 2033 | $129.4B | +18.1% CAGR |
Regional Breakdown
Fraud patterns and prevention spending vary dramatically by geography. North America leads in absolute market size and technology adoption, while emerging markets in Asia-Pacific show the fastest growth rates.
According to Grand View Research, North America generated $12.37 billion in fraud detection revenue in 2024 and maintains an 18.2% CAGR. The United States alone is projected to reach $40.5 billion by 2033. This dominance reflects the region’s high digital payment penetration, stringent regulatory environment, and concentration of major fraud prevention vendors.
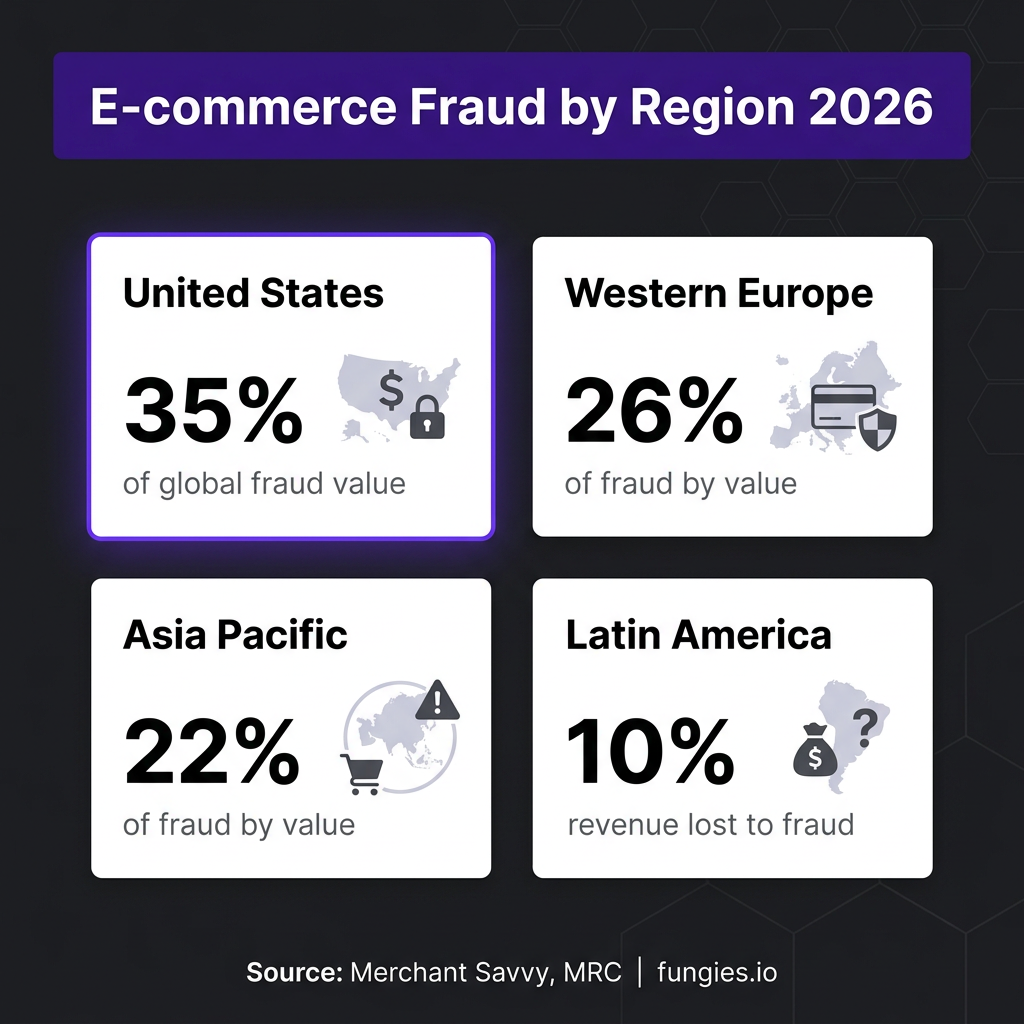
From a fraud loss perspective, the United States accounts for 35% of all e-commerce fraud by value, followed by Western Europe at 26% and Asia-Pacific at 22%. These figures correlate with e-commerce market size but also reflect varying fraud prevention maturity levels across regions.
Latin America presents a unique profile—while representing a smaller share of global fraud value, merchants in the region spend 19% of annual e-commerce revenue managing payment fraud, compared to 10% in Europe and the US. Asia-Pacific merchants fall in between at 15% of revenue dedicated to fraud management.
| Region | Fraud Market Size 2024 | CAGR | % of Global Fraud Value | Fraud Management Spend |
|---|---|---|---|---|
| North America | $12.37B | 18.2% | 35% | 10% of revenue |
| Western Europe | $8.1B (est.) | 16.5% | 26% | 10% of revenue |
| Asia-Pacific | $6.8B (est.) | 19.8% | 22% | 15% of revenue |
| Latin America | $2.4B (est.) | 17.3% | 12% | 19% of revenue |
| Middle East & Africa | $1.9B (est.) | 15.2% | 5% | Data limited |
Key Players & Market Share
The fraud detection and prevention market features a mix of established cybersecurity giants, specialized fraud prevention vendors, and emerging AI-native startups. Market consolidation continues as larger platforms acquire specialized capabilities.
According to MarketsandMarkets analysis, leading vendors include IBM, FICO, SAS Institute, Experian, LexisNexis Risk Solutions, and Fiserv. The competitive landscape is increasingly defined by AI capabilities, with vendors differentiating on real-time processing speed, false positive rates, and integration flexibility.
Statista data from March 2026 indicates Sift Science and MaxMind as technology leaders in the fraud detection space. Juniper Research’s competitor leaderboard assesses 21 major vendors across capability and capacity metrics, with the top tier demonstrating superior machine learning implementations and global data network effects.
| Company | Primary Focus | Key Strength |
|---|---|---|
| IBM | Enterprise fraud management | Watson AI integration |
| FICO | Financial services fraud | Proprietary analytics |
| SAS Institute | Analytics & AI | Advanced machine learning |
| Experian | Identity verification | Global data assets |
| LexisNexis | Risk management | Comprehensive databases |
| Sift Science | Digital fraud prevention | Real-time scoring |
| Signifyd | E-commerce fraud | Chargeback protection |
| Forter | Online retail fraud | Identity intelligence |
Industry Benchmarks & KPIs
Effective fraud management requires tracking the right metrics. Industry benchmarks reveal significant variation in performance across organizations and sectors.
According to Sift’s Fraud Industry Benchmarking Resource (FIBR), businesses across their network average a 0.08% fraudulent chargeback rate—97% lower than the 2.6% average reported by merchants in the MRC Global Payments and Fraud Survey. This disparity highlights the performance gap between organizations with advanced fraud prevention and those with basic or no dedicated solutions.
The Merchant Risk Council’s 2026 survey of 1,200+ merchants across 35+ countries found that fraud rates by order declined from 3.4% in 2024 to 3.0% in 2025—a positive trend indicating improving prevention capabilities across the industry.
Key performance indicators that fraud management teams track include:
- Value Detection Rate (VDR): The proportion of total attempted fraud value successfully detected
- False Positive Rate: Legitimate transactions incorrectly flagged as fraudulent
- Chargeback Rate: Disputed transactions as percentage of total sales
- Manual Review Rate: Transactions requiring human intervention
- Fraud Loss Rate: Revenue lost to fraud as percentage of total revenue
| Metric | Industry Average | Best-in-Class |
|---|---|---|
| Fraud Loss Rate | 2.9% | <0.5% |
| Chargeback Rate | 0.6% | <0.08% |
| False Positive Rate | 15-20% | <5% |
| Manual Review Rate | 10-15% | <3% |
| Fraud Detection Rate | 70-80% | >95% |
Trends & Predictions: 2026-2030
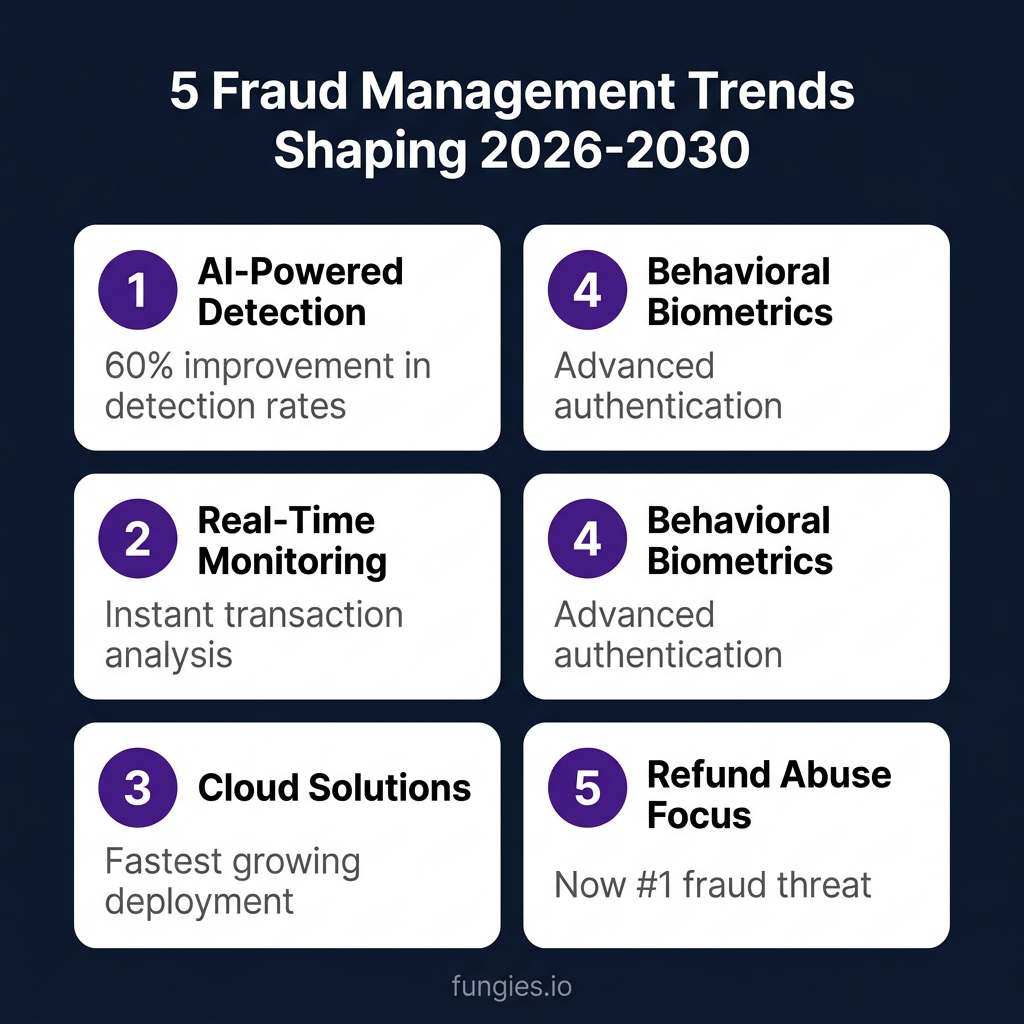
The fraud management landscape is undergoing rapid transformation. Five major trends will define the industry through 2030:
1. AI-Powered Detection Becomes Standard
Machine learning and artificial intelligence are moving from competitive differentiators to table stakes. McKinsey research shows that organizations combining new data sources with sophisticated analytics have increased fraud detection rates by approximately 60% while simultaneously reducing false positives. Predictive models now improve detection by over 31% compared to traditional rule-based systems.
2. Real-Time Transaction Monitoring
The shift to instant payments (FedNow, RTP) and the growth of P2P transactions demand sub-second fraud decisions. Real-time monitoring capabilities are becoming essential, with vendors competing on processing latency measured in milliseconds.
3. Cloud-First Deployment
Cloud-based fraud management solutions are growing faster than on-premise alternatives, offering scalability, faster updates, and lower total cost of ownership. The flexibility to scale during high-traffic events (Black Friday, product launches) makes cloud deployment increasingly attractive.
4. Behavioral Biometrics Expansion
Beyond traditional authentication, behavioral biometrics analyze how users interact with devices—typing patterns, mouse movements, touchscreen pressure. This passive authentication layer adds security without friction, addressing the trade-off between security and user experience.
5. Refund Abuse Takes Center Stage
For the first time, refund and policy abuse has overtaken payment fraud as the #1 ranked fraud threat in e-commerce, according to the MRC 2026 report. This category includes wardrobing, item-not-received claims, and return fraud—challenges that traditional fraud tools weren’t designed to address.
Fraud Types & Threat Landscape
Understanding the specific fraud vectors organizations face is critical for effective prevention. The 2026 threat landscape shows both evolution and persistence of classic attack methods.
Payment fraud dominates by revenue impact, accounting for 53.1% of the fraud detection market. Within this category, Card-Not-Present (CNP) fraud remains the largest component—81% of all UK card fraud in 2022, with 2.21 million cases and £396 million in losses.
Account Takeover (ATO) fraud continues to rise as credential stuffing attacks become more sophisticated. Synthetic identity fraud—combining real and fake data to create new identities—poses particular challenges as these identities can pass traditional verification checks.
Business Email Compromise (BEC) and Authorized Push Payment (APP) fraud are major concerns for 2026, according to Nasdaq Verafin analysis. The European Payments Council’s 2025 Threats and Fraud Trends Report highlights social engineering and phishing as persistent enablers across all fraud categories.
| Fraud Type | Description | Growth Trend |
|---|---|---|
| Payment Fraud | CNP fraud, card testing, stolen cards | Stable/Declining |
| Account Takeover | Credential stuffing, phishing | Increasing |
| Synthetic Identity | Manufactured identities | Increasing |
| Refund Abuse | Wardrobing, INR claims | Rapidly Increasing |
| BEC/APP Fraud | Social engineering, authorized fraud | Increasing |
| First-Party Fraud | Customer-initiated fraud | Increasing |
Methodology
This report synthesizes data from authoritative industry sources including Grand View Research, Coherent Market Insights, Mordor Intelligence, MarketsandMarkets, the Merchant Risk Council (MRC), Juniper Research, and government agencies including the U.S. Government Accountability Office (GAO) and Federal Trade Commission (FTC).
Market size figures represent analyst consensus from multiple research firms, with variations noted where significant. Fraud loss statistics derive from merchant surveys, payment network data, and regulatory filings. Regional breakdowns use the most recent available geographic segmentation from primary research sources.
All figures are current as of June 2026. Historical comparisons use the most recent prior-year data available from identical sources to ensure consistency. Projections reflect analyst consensus estimates and do not represent guaranteed outcomes.
Frequently Asked Questions
What is the size of the fraud detection and prevention market in 2026?
The global fraud detection and prevention market is valued at approximately $40.4 billion in 2026, up from $35.3 billion in 2025. Alternative estimates from Coherent Market Insights place the market at $52.06 billion, reflecting different segment definitions.
How much do businesses lose to fraud annually?
According to 2025 data, businesses globally lose an average of 7.7% of annual revenue to fraud. E-commerce merchants specifically lose 2.9% of revenue to payment fraud, though this varies significantly by region—Latin American merchants face losses requiring 19% of revenue to manage, compared to 10% in the US and Europe.
What is the fastest-growing fraud type?
Refund and policy abuse has emerged as the fastest-growing fraud concern, overtaking payment fraud as the #1 ranked threat for the first time in 2026. This includes wardrobing (returning worn items), item-not-received claims, and exploitation of generous return policies.
Which region has the highest fraud rates?
The United States accounts for 35% of global e-commerce fraud by value, followed by Western Europe (26%) and Asia-Pacific (22%). However, Latin America shows the highest fraud management burden, with merchants spending 19% of revenue on fraud prevention and losses.
How effective are AI-powered fraud detection systems?
Organizations implementing AI-powered fraud detection report approximately 60% improvement in detection rates compared to traditional methods. Machine learning models improve fraud detection by over 31% versus existing rule-based systems, while simultaneously reducing false positives that frustrate legitimate customers.
Sources & Citations
- Grand View Research – Fraud Detection And Prevention Market Report (2026-2033): https://www.grandviewresearch.com/industry-analysis/fraud-detection-prevention-market
- Coherent Market Insights – Fraud Detection Market Size and Share Analysis: https://www.coherentmarketinsights.com/industry-reports/fraud-detection-market
- Mordor Intelligence – Fraud Detection and Prevention (FDP) Market: https://www.mordorintelligence.com/industry-reports/global-fraud-detection-and-prevention-fdp-market-industry
- MarketsandMarkets – Fraud Detection and Prevention Market Report: https://www.marketsandmarkets.com/Market-Reports/fraud-detection-prevention-market-1312.html
- Merchant Risk Council – 2026 Global Payments and Fraud Report: https://merchantriskcouncil.org/learning/mrc-exclusive-reports/global-payments-and-fraud-report
- Merchant Savvy – Payment Fraud Statistics 2026: https://www.merchantsavvy.co.uk/payment-fraud-statistics
- Chargeflow – Chargeback Statistics 2026: https://www.chargeflow.io/blog/chargeback-statistics-trends-costs-solutions
- Alloy – 2025 Financial Fraud Statistics: https://www.alloy.com/blog/2025-financial-fraud-statistics
- Sift – Fraud Industry Benchmarking Resource (FIBR): https://sift.com/blog/introducing-fibr-powered-by-sift
- Custom Market Insights – Enterprise Fraud Management Market: https://www.custommarketinsights.com/report/enterprise-fraud-management-market
- Research and Markets – Financial Crime and Fraud Management Solutions: https://www.researchandmarkets.com/reports/6009312/financial-crime-fraud-management-solutions
- Future Market Insights – Anti-Fraud Management System Market: https://www.futuremarketinsights.com/reports/anti-fraud-management-system-market
- Fortune Business Insights – Fraud Detection and Prevention Market: https://www.fortunebusinessinsights.com/industry-reports/fraud-detection-and-prevention-market-100231
- U.S. GAO – Fraud Risk Management Report: https://www.gao.gov/products/gao-24-105833
- McKinsey – Four Key Capabilities to Strengthen Fraud Management: https://www.mckinsey.com/capabilities/risk-and-resilience/our-insights/four-key-capabilities-to-strengthen-a-fraud-management-system