SaaS Valuation Statistics 2026: Market Multiples, Data & Trends (Comprehensive Report)
The SaaS valuation landscape has undergone a seismic shift. What was once a market where growth-at-all-costs commanded 16.9x revenue multiples has transformed into a disciplined environment where profitability metrics, retention rates, and AI positioning determine whether your company trades at 3x or 9x ARR. According to the SaaS Capital Index, median public SaaS multiples collapsed from 7.0x at the start of 2025 to just 3.8x by March 2026—a decline that erased approximately $1 trillion in aggregate SaaS market capitalization in a single quarter.
This comprehensive report examines the current state of SaaS valuations in 2026, drawing from over 2,700 M&A transactions, 100+ public company comparables, and proprietary data from industry-leading indices. Whether you’re a founder planning an exit, an investor evaluating opportunities, or an executive benchmarking your company’s performance, this data-driven analysis provides the benchmarks you need to make informed decisions.
Key Statistics at a Glance
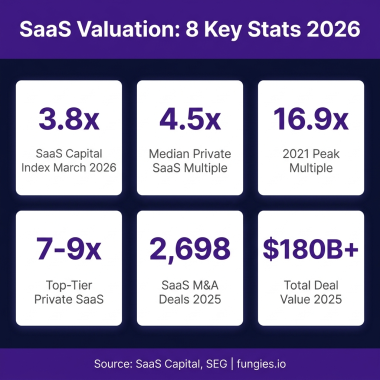
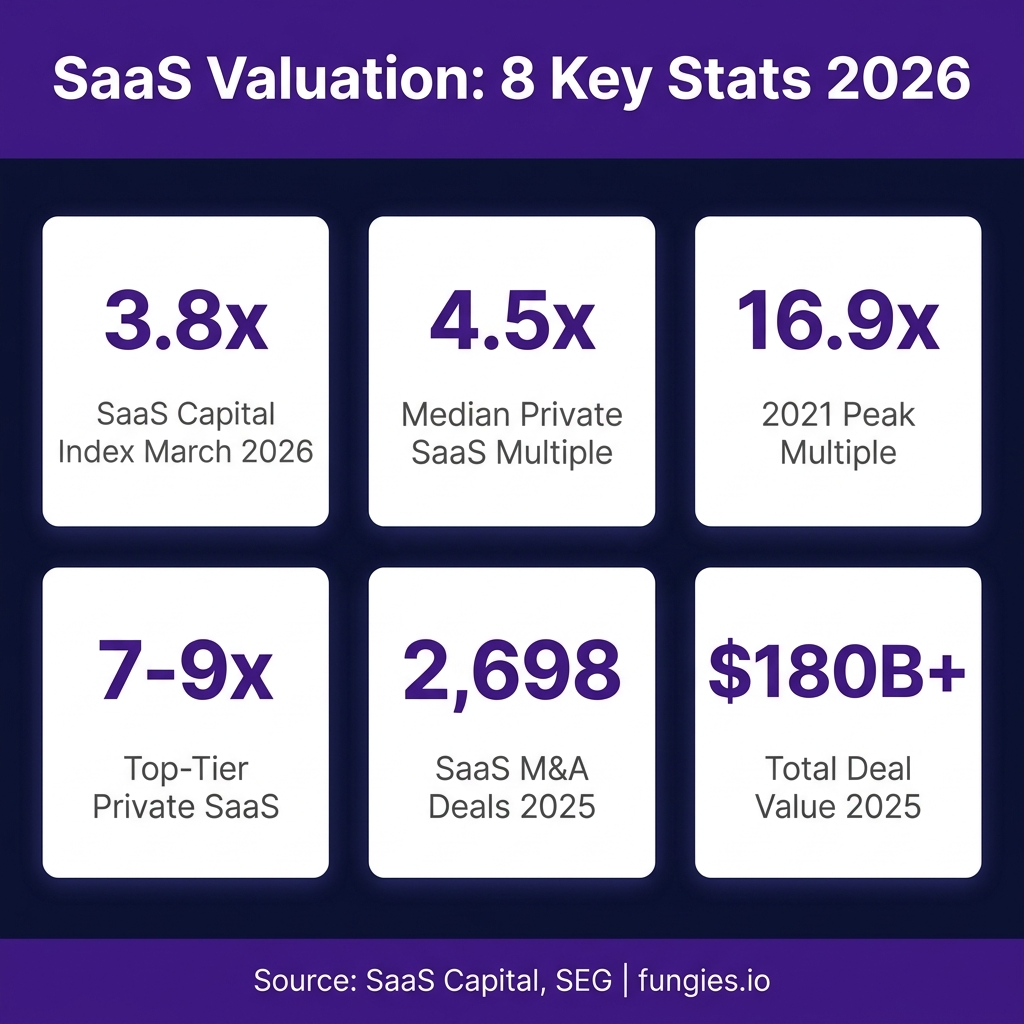
- The SaaS Capital Index sits at 3.8x ARR as of March 2026, down from 7.0x at the start of 2025 and 16.9x at the 2021 peak
- Private SaaS companies in the lower middle market trade at a median of 4.5x ARR, with a range of 3x to 7x
- Top-tier private SaaS companies command 7–9x ARR when they exceed Rule of 40 thresholds and maintain NRR above 120%
- 2,698 SaaS M&A transactions closed in 2025—a 28% increase from 2024 and the highest annual count ever recorded
- Total announced SaaS deal value in 2025 surpassed $180 billion, with 17 mega-deals exceeding $2.5 billion
- AI-native SaaS companies price at 15–30x ARR on growth rounds, compared to 3–7x for legacy SaaS
- Companies clearing the Rule of 40 trade at a 74% premium compared to those that fail (4.8x vs 2.7x EV/Revenue)
- Vertical SaaS commands an average of 8.1x revenue versus 5.2x for horizontal SaaS—a 56% premium
- Bootstrapped SaaS companies trade at a median of 4.8x ARR versus 5.3x for VC-backed peers
- Companies with NRR above 120% achieve 8x+ revenue multiples compared to ~1.2x for those with sub-90% NRR
Market Size & Growth
The global B2B SaaS market reached approximately $390 billion in 2025 and is projected to grow to $492.34 billion in 2026, according to Mordor Intelligence. By 2031, the market is expected to reach $1.58 trillion, representing a compound annual growth rate (CAGR) of 26.24% during the forecast period (2026-2031).
Despite this robust growth trajectory, valuation multiples have compressed significantly. The SEG SaaS Index™ reported median EV/TTM revenue multiples of 3.6x in Q1 2026, down from 6.7x in 2024 and 5.9x in 2025. This compression reflects not deteriorating fundamentals but rather a market recalibration driven by macro uncertainty, interest rate environments, and evolving expectations around AI disruption.
Public market valuations tell a similar story. According to Finerva’s B2B SaaS analysis, revenue multiples saw a slight recovery in 2024 to 6.7x but contracted again in 2025, settling at 5.9x. The 2021 peak—when public SaaS companies traded at a median of 18.6x EV/Revenue—is firmly in the past, and industry observers note that days of double-digit revenue multiples for private companies are unlikely to return.
| Year | Median Public EV/Revenue | SaaS Capital Index | Market Context |
|---|---|---|---|
| 2021 | 16.9x | 16.9x | Peak valuation bubble |
| 2022 | 8.2x | 8.2x | SaaS crash correction |
| 2023 | 7.5x | 7.5x | Stabilization |
| 2024 | 6.7x | 6.7x | Partial recovery |
| 2025 (start) | 5.9x | 7.0x | Pre-correction levels |
| 2026 (March) | 3.6x | 3.8x | SaaSpocalypse low |
Valuation Multiples by Company Size
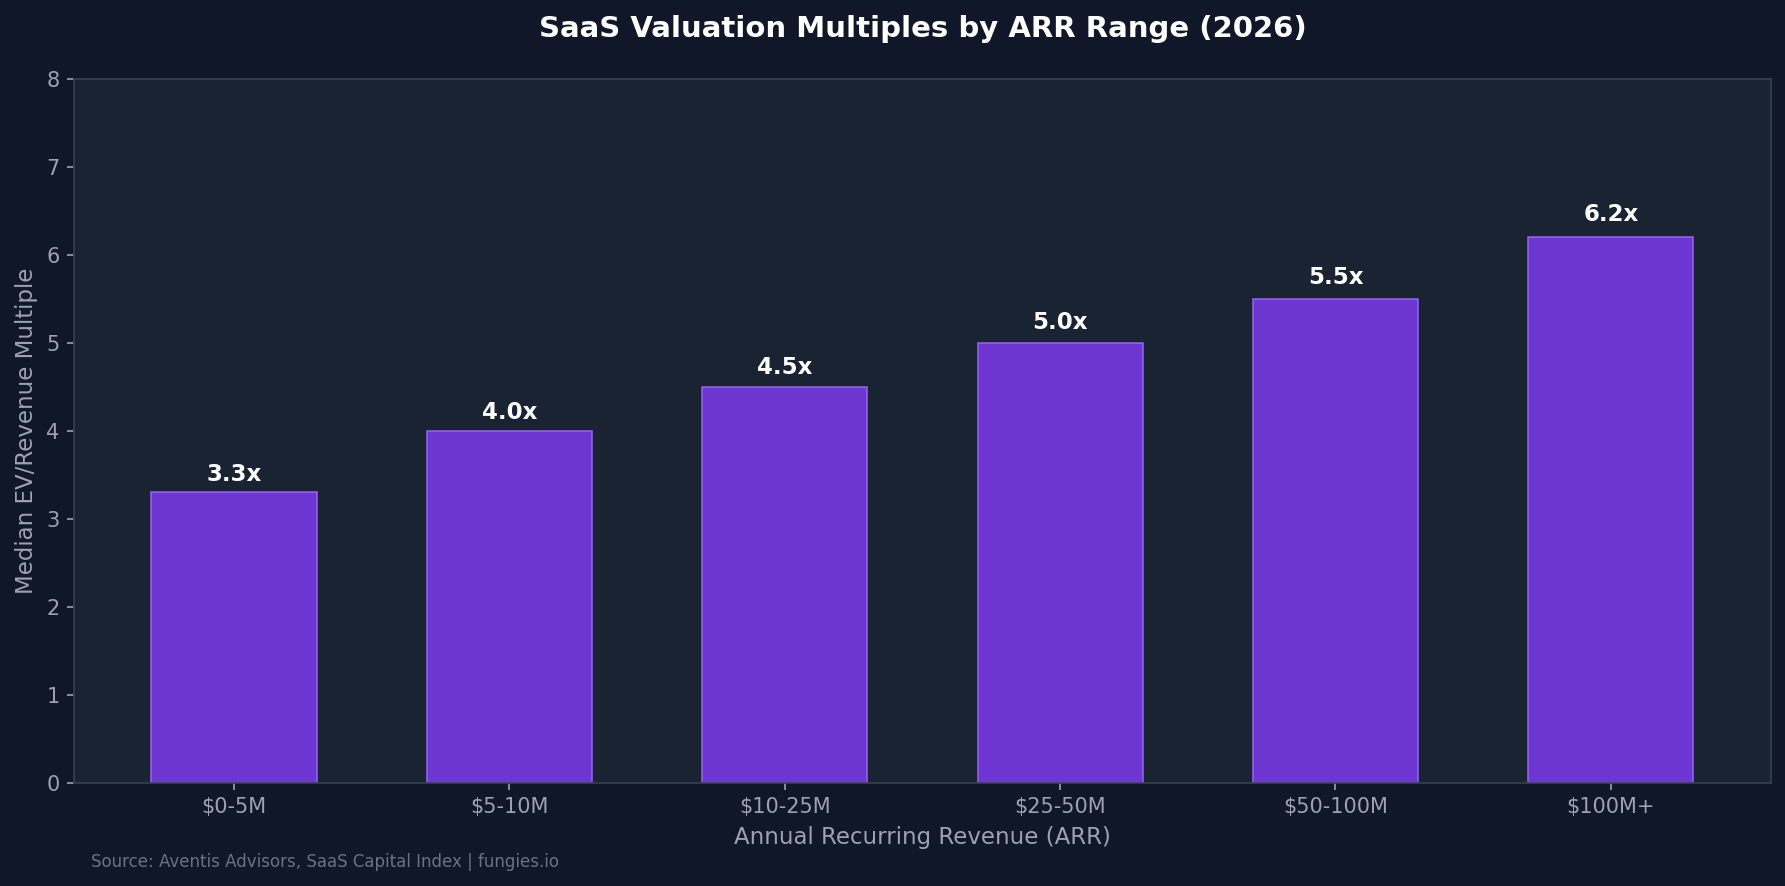
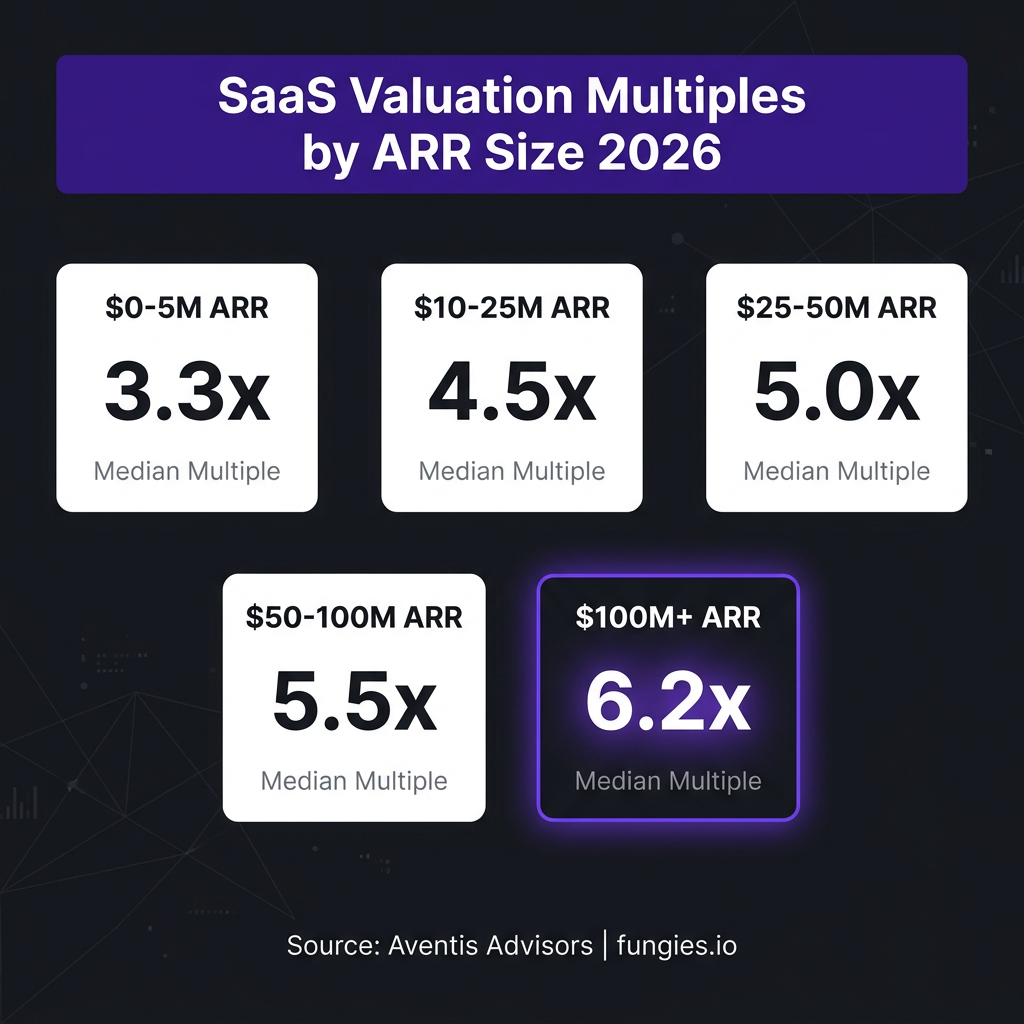
Company size, measured by Annual Recurring Revenue (ARR), is one of the strongest determinants of valuation multiples. According to Aventis Advisors’ analysis of private SaaS transactions, median multiples increase consistently with ARR scale, reflecting reduced risk and proven scalability at higher revenue levels.
For companies with $0–5M ARR, the median valuation multiple sits at 3.3x. This segment represents the highest risk profile, with many companies still searching for product-market fit. As companies scale to $5–10M ARR, median multiples rise to 4.0x, reflecting improved operational maturity and customer validation.
The $10–25M ARR band—described by SaaS Capital as its most active segment in lower-middle-market M&A—commands a median of 4.5x ARR. Companies in the $25–50M ARR range achieve 5.0x, while those at $50–100M ARR reach 5.5x. At the top end, companies with $100M+ ARR command median multiples of 6.2x.
| ARR Range | Median Multiple | Typical Buyer Profile | Key Value Drivers |
|---|---|---|---|
| $0–5M | 3.3x | Micro-PE, strategics | Growth rate, market opportunity |
| $5–10M | 4.0x | PE rollups, strategics | Retention, unit economics |
| $10–25M | 4.5x | Lower-middle-market PE | Rule of 40, NRR |
| $25–50M | 5.0x | Mid-market PE | Market position, efficiency |
| $50–100M | 5.5x | Large PE, strategics | Scale, profitability |
| $100M+ | 6.2x | Strategics, public markets | Market leadership, margins |
Bootstrapped vs. VC-Backed Valuation Gap
The funding path a SaaS company takes creates measurable valuation differences in the M&A market. According to SaaS Capital’s 2025 dataset, bootstrapped companies trade at a median of 4.8x ARR, while equity-backed (VC-funded) peers command 5.3x ARR—a modest 10% premium.
This gap reflects fundamental differences in buyer expectations. Bootstrapped SaaS companies typically optimize for profitability, with median EBITDA margins of 25% versus aggressive growth investments by VC-backed counterparts. The buyer pool for bootstrapped companies consists primarily of PE rollups, micro-PE holdcos, and strategic acquirers seeking cash-flowing assets. VC-backed companies attract financial buyers comfortable with growth-stage risk profiles.
However, the gap narrows significantly when bootstrapped companies demonstrate strong metrics. Bootstrapped companies in the 90th percentile for growth achieve 42.3% annual growth rates—comparable to VC-backed peers—and can command multiples at the upper end of the range. The median Net Revenue Retention for bootstrapped SaaS companies with $3M–$20M ARR is 103%, while top performers reach 117.9% NRR.
| Metric | Bootstrapped (Median) | VC-Backed (Median) | Top Quartile |
|---|---|---|---|
| Valuation Multiple | 4.8x ARR | 5.3x ARR | 7–9x ARR |
| Revenue Growth | 15% | 26% | 42%+ |
| Net Revenue Retention | 103% | 101% | 117%+ |
| Gross Revenue Retention | 91% | 88% | 95%+ |
| Median EBITDA Margin | 25% | -10% | 30%+ |
Vertical vs. Horizontal SaaS Premium
Industry specialization has emerged as a significant valuation driver. According to Aventis Advisors, vertical SaaS companies command 8.1x revenue multiples on average, compared to 5.2x for horizontal SaaS—a consistent 56% premium.
This premium reflects the inherent advantages of vertical SaaS models: deeper workflow integration, higher switching costs, industry-specific data moats, and clearer pricing power. Vertical SaaS platforms that own customer workflows, payments, compliance, or industry-specific data demonstrate stickiness that broad horizontal tools struggle to match.
Public market data confirms this trend. In Forbes’ analysis of AI and SaaS valuation multiples, vertical SaaS companies came closer to AI valuation multiples than any other SaaS category. While LLMs and generative AI startups trade at median EV/revenue ranges of 14.5x, vertical SaaS commands premiums that horizontal productivity platforms (4x) and finance/ERP solutions (5x) cannot match.
Notable vertical SaaS leaders include Veeva Systems (life sciences), Toast (restaurants), and Procore (construction)—each demonstrating how industry focus creates durable competitive advantages and corresponding valuation premiums.
The Rule of 40: Valuation Impact
The Rule of 40—calculated as revenue growth rate (%) plus profit margin (%)—has become the definitive benchmark for SaaS health. According to Aventis Advisors’ analysis, companies that clear the Rule of 40 on a Free Cash Flow basis trade at a median of 4.8x EV/Revenue, compared to 2.7x for those that fail—a 74% valuation premium.
The correlation between Rule of 40 scores and valuation multiples is remarkably consistent. Each 10-point improvement in Rule of 40 score translates to approximately 1.0–2.2x additional EV/Revenue multiple. Companies scoring above 50 on the Rule of 40 while maintaining NRR above 120% consistently close transactions at 7x to 9x ARR.
This represents a fundamental shift from the growth-at-all-costs era. The market has moved from prioritizing top-line growth above all else to rewarding balanced performance. As Aventis Advisors notes, this evolution from “growth at all costs to profitable scale” has redefined what constitutes a premium SaaS business in 2026.
| Rule of 40 Score | Median EV/Revenue | Premium vs. Failing | Typical Profile |
|---|---|---|---|
| Below 20 | 2.0x | Baseline | Early-stage, unprofitable |
| 20–40 | 3.0x | +50% | Growth-focused, scaling |
| 40 (Threshold) | 4.0x | +100% | Balanced growth/profit |
| 40–60 | 5.5x | +175% | Strong performers |
| Above 60 | 7.0x+ | +250% | Elite SaaS companies |
Net Revenue Retention: The Retention Premium
Net Revenue Retention (NRR) has emerged as perhaps the single most important metric for SaaS valuations. According to m3ter’s 2026 analysis, a 10-point improvement in NRR translates to a 20–30% valuation uplift. For an $8M ARR business, that difference can mean millions in exit value.
The data is stark: companies with NRR above 120% achieve 8x+ revenue multiples, while those with sub-90% NRR trade at approximately 1.2x. This 6.5x difference in valuation multiple based on a single metric demonstrates why retention has become the obsession of SaaS operators and investors alike.
Across all private B2B SaaS companies, median Annual NRR has compressed to 101% in 2026. However, enterprise companies with ACVs above $100K retain at 118% Annual NRR—demonstrating the value of upmarket focus. Bootstrapped companies maintain a median NRR of 103%, while top performers reach 117.9%.
For SaaS companies using platforms like Fungies.io to handle payments and billing, accurate NRR calculation becomes simpler. Automated revenue recognition and cohort tracking enable real-time visibility into this critical metric—visibility that directly impacts valuation conversations with potential acquirers.
| NRR Range | Median EV/Revenue | Valuation Impact | Typical Profile |
|---|---|---|---|
| Below 90% | 1.2x | Severe discount | High churn, struggling |
| 90–100% | 2.5x | Below market | Churn challenges |
| 100–110% | 4.0x | Market rate | Stable growth |
| 110–120% | 6.0x | Premium | Strong expansion |
| Above 120% | 8.0x+ | Elite premium | Best-in-class |
AI-Native SaaS: The New Valuation Frontier
Artificial intelligence has created a two-tier valuation market. According to SEG Research, 80% of PE and strategic buyers are paying more for AI-native SaaS. Private AI-native SaaS companies price at 15–30x ARR on growth rounds, with foundation models and breakout enterprise AI commanding 35–45x ARR.
This compares to 3–7x ARR for legacy SaaS in the lower-middle market—a valuation gap that has profound implications for the industry. Public AI pure-plays span an even wider range, with EV/Revenue multiples between 10x and 78x depending on growth rates and market positioning.
However, the AI premium comes with caveats. According to L40’s analysis, AI is now both a value driver and a deal-risk variable—one in five strategic buyers walked from a 2025 deal over AI exposure concerns on the target’s business model. Buyers are scrutinizing whether AI capabilities represent sustainable competitive advantage or vulnerability to disruption.
High-performing AI-native companies are achieving unprecedented growth velocity. According to Bessemer Venture Partners’ State of AI 2025 report, some AI-native software companies reach approximately $3M ARR within their first year and scale to roughly $100M by year four. A subset of elite performers achieves approximately $40M ARR within the first year and exceeds $120M by year two—growth rates that dwarf traditional SaaS benchmarks.
2025 M&A Market: Record Activity
Despite valuation compression, SaaS M&A activity reached unprecedented levels in 2025. According to Software Equity Group’s 2026 Annual SaaS Report, 2,698 SaaS M&A transactions closed in 2025—a 28% jump from 2024 and the highest annual count ever recorded.
Total announced deal value surpassed $180 billion, with 17 mega-deals exceeding $2.5 billion. Software M&A accounted for 65% of total tech deal volume in 2025, demonstrating the sector’s continued attractiveness to strategic and financial buyers.
AI-referenced targets accounted for approximately 72% of all SaaS M&A transactions in 2025, reflecting how quickly AI has become embedded across the SaaS landscape. Analytics & Data Management and Content & Workflow Management were the two most active product categories, together accounting for nearly 38% of total SaaS deal volume.
The median private SaaS company in the lower middle market now trades at approximately 4.5x ARR, though companies with growth above 30%, NRR above 110%, and Rule of 40 scores above 50 can command 6x to 8x ARR. This dispersion—the gap between average and premium outcomes—has never been wider.
| M&A Metric | 2024 | 2025 | Change |
|---|---|---|---|
| Total SaaS Deals | 2,108 | 2,698 | +28% |
| Total Deal Value | $145B | $180B+ | +24% |
| Mega-Deals ($2.5B+) | 12 | 17 | +42% |
| AI-Referenced Deals | 45% | 72% | +60% |
| Software % of Tech M&A | 58% | 65% | +12% |
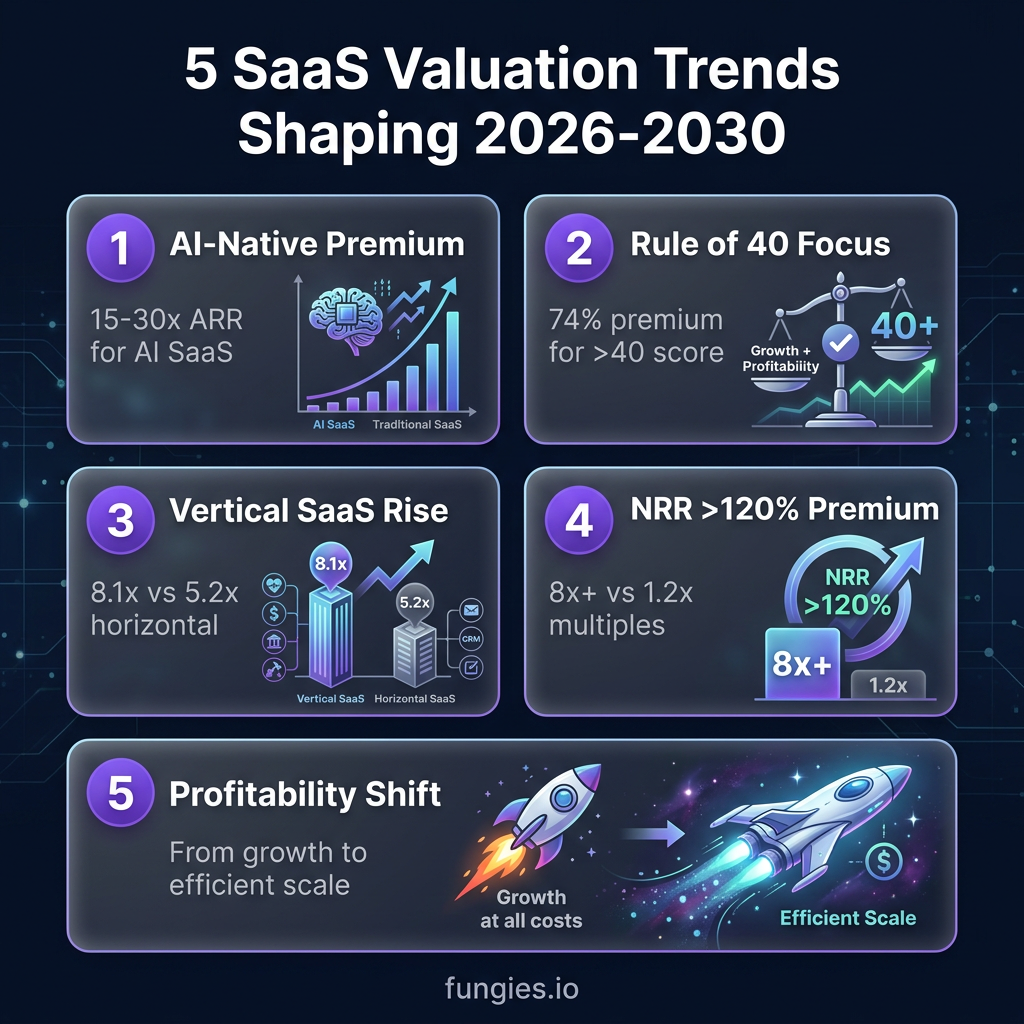
5 Trends Shaping SaaS Valuations Through 2030
1. The AI-Native Premium Widens
The valuation gap between AI-native and traditional SaaS will persist and potentially widen. Companies with genuine AI differentiation—foundation models, proprietary training data, or AI-embedded workflows—will continue commanding 15–30x ARR multiples. Legacy SaaS without clear AI strategies face ongoing multiple compression as markets price in disruption risk.
2. Rule of 40 Becomes Table Stakes
What was once a “nice to have” metric has become essential for premium valuations. The 74% valuation premium for companies clearing the Rule of 40 threshold means that growth-at-all-costs strategies without profitability pathways face severe multiple discounts. Expect this benchmark to tighten further, with top-quartile companies targeting Rule of 50 or higher.
3. Vertical SaaS Consolidation Accelerates
The 56% valuation premium for vertical SaaS over horizontal alternatives will drive continued investment in industry-specific solutions. As horizontal platforms face AI disruption, vertical SaaS companies with deep workflow integration and industry data moats will become increasingly attractive acquisition targets.
4. NRR Becomes the Primary Valuation Driver
The 6.5x multiple difference between companies with 120%+ NRR versus sub-90% NRR demonstrates retention’s primacy. Companies will invest heavily in customer success, expansion revenue, and churn reduction—not just for growth, but for valuation protection. Net Revenue Retention will increasingly be viewed as the purest indicator of product-market fit.
5. Profitability Over Growth
The market has definitively shifted from prioritizing growth rates to rewarding efficient growth. Companies demonstrating clear paths to profitability while maintaining growth will outperform pure growth stories. This trend favors bootstrapped companies with established unit economics and challenges VC-backed companies still burning capital for growth.
Methodology
This report synthesizes data from multiple authoritative sources to provide a comprehensive view of SaaS valuations in 2026. Primary data sources include:
- SaaS Capital Index™: Monthly updated index of 100+ public B2B SaaS companies, providing median EV/Revenue multiples and trend analysis
- Software Equity Group (SEG) Annual SaaS Report 2026: Analysis of 2,700+ SaaS M&A transactions and 100+ public companies
- Aventis Advisors SaaS Valuation Research: Proprietary analysis of private SaaS transaction multiples and valuation drivers
- Mordor Intelligence B2B SaaS Market Report: Market sizing and growth projections through 2031
- Bessemer Venture Partners State of AI 2025: AI-native SaaS growth benchmarks and valuation data
- SaaS Capital Bootstrapped SaaS Benchmarks 2026: Survey of 1,000+ private B2B SaaS companies
Valuation multiples cited represent median or mean figures from transaction data where available. Public company multiples reflect EV/Revenue calculations based on enterprise value and trailing twelve-month revenue. Private company multiples represent reported transaction values divided by ARR at time of sale.
Limitations include: private transaction data relies on self-reported figures which may not capture all deal terms; public market multiples fluctuate daily; AI-native SaaS valuations represent a rapidly evolving subset with limited historical data; and regional variations in valuation multiples are not fully captured in this global analysis.
Frequently Asked Questions
What is a good valuation multiple for a SaaS company in 2026?
In 2026, a “good” SaaS valuation multiple depends heavily on company profile. For private B2B SaaS companies with $3M–$20M ARR, the median is 4.5x ARR. Companies with strong metrics (30%+ growth, 110%+ NRR, Rule of 40 above 40) can command 6–8x ARR. Top-tier companies with NRR above 120% and Rule of 40 above 50 achieve 7–9x ARR. AI-native SaaS companies with breakout growth can reach 15–30x ARR.
How has the SaaS Capital Index changed in 2026?
The SaaS Capital Index experienced a dramatic decline in early 2026, dropping from 7.0x at the start of January to 3.8x by March—a 46% decrease. This “SaaSpocalypse” erased approximately $1 trillion in aggregate SaaS market cap, including ~$285 billion in a single 48-hour window in early February. The decline reflects market concerns about AI disruption, macro uncertainty, and a recalibration of growth expectations.
What is the Rule of 40 and why does it matter for valuations?
The Rule of 40 is calculated as revenue growth rate (%) plus profit margin (%). Companies achieving a combined score of 40% or higher are considered healthy. In 2026, the Rule of 40 has become the primary valuation driver—companies clearing this threshold on a Free Cash Flow basis trade at 4.8x EV/Revenue versus 2.7x for those that fail, representing a 74% valuation premium. Each 10-point improvement adds approximately 1.0–2.2x to the EV/Revenue multiple.
How do bootstrapped and VC-backed SaaS valuations compare?
Bootstrapped SaaS companies trade at a median of 4.8x ARR versus 5.3x for VC-backed peers—a modest 10% discount. However, bootstrapped companies typically demonstrate stronger profitability (25% median EBITDA margins versus -10% for VC-backed) and comparable retention (103% vs 101% NRR). The gap narrows significantly for bootstrapped companies with top-quartile growth rates (42%+).
What impact does Net Revenue Retention have on SaaS valuations?
Net Revenue Retention (NRR) has an outsized impact on valuations. Companies with NRR above 120% achieve 8x+ revenue multiples, while those with sub-90% NRR trade at ~1.2x—a 6.5x difference. A 10-point improvement in NRR translates to a 20–30% valuation uplift. For an $8M ARR company, improving NRR from 100% to 110% could add $1.6–$2.4M in exit value.
Sources & Citations
- SaaS Capital Index™ – https://www.saas-capital.com/the-saas-capital-index
- SaaS Capital, “What’s Your SaaS Company Worth? 2026” – https://www.saas-capital.com/research/whats-your-saas-company-worth
- SaaS Capital, “2026 Benchmarking Metrics for Bootstrapped SaaS Companies” – https://www.saas-capital.com/blog-posts/benchmarking-metrics-for-bootstrapped-saas-companies
- Software Equity Group, “2026 Annual SaaS Report” – https://softwareequity.com/research/annual-saas-report
- Software Equity Group, “SaaS M&A and Public Market Report Q1 2026” – https://softwareequity.com/research/quarterly-saas-report
- Aventis Advisors, “SaaS Valuation Multiples: 2015-2026” – https://aventis-advisors.com/saas-valuation-multiples
- Aventis Advisors, “Rule of 40 in SaaS: 2026 Data, Benchmarks and Valuation Impact” – https://aventis-advisors.com/rule-of-40-in-saas-2026
- Mordor Intelligence, “B2B SaaS Market Size, Share Analysis, Growth Report 2026-2031” – https://www.mordorintelligence.com/industry-reports/b2b-saas-market
- Finerva, “B2B SaaS: 2026 Valuation Multiples” – https://finerva.com/report/b2b-saas-2026-valuation-multiples
- L40°, “SaaS Multiples: Methods and Company Valuation in 2026” – https://www.l40.com/insights/saas-multiples
- Livmo, “SaaS Valuation Multiples 2026: 3x to 12x ARR Data” – https://livmo.com/blog/saas-valuation-multiples-2026
- Forbes Finance Council, “Vertical SaaS: An Overlooked Winner In The AI Valuation Race” – https://www.forbes.com/councils/forbesfinancecouncil/2026/03/30/vertical-saas-an-overlooked-winner-in-the-ai-valuation-race
- Bessemer Venture Partners, “State of AI 2025” – https://www.bvp.com/atlas/the-state-of-ai-2025
- FE International, “SaaS Valuations: How to Value a SaaS Business in 2025” – https://feinternational.com/saas-valuation/
- Data-Mania, “B2B SaaS Benchmarks 2026: CAC, NRR, Churn & Growth Rates” – https://www.data-mania.com/blog/b2b-saas-benchmarks-2026-annual-report
- m3ter, “Net Revenue Retention (NRR) Explained | SaaS Valuation Guide” – https://www.feinternational.com/blog/net-revenue-retention-saas-valuation