Here’s a statistic that should terrify every SaaS founder: 67% of SaaS companies say they’re drowning in data but starving for insights. You have Stripe sending payment events, your CRM logging deals, Google Analytics tracking traffic, and ad platforms burning through budget. Yet when an investor asks a simple question like “What’s your net revenue retention?” — you find yourself scrambling through five different tabs.
The difference between SaaS companies that scale efficiently and those that burn cash isn’t the amount of data they collect. It’s whether they can see the metrics that actually matter in one place. After testing dozens of platforms and talking to founders at every stage, I’ve narrowed down the 10 best SaaS metrics dashboard tools that turn data chaos into actionable intelligence.
What Is a SaaS Metrics Dashboard (And Why You Need One)
A SaaS metrics dashboard is a centralized interface that pulls data from your billing system, CRM, marketing tools, and product analytics into a single view. Think of it as the cockpit for your subscription business — without it, you’re flying blind.
Here’s what most founders don’t realize: companies lose an average of 9% of MRR monthly due to failed payments alone — and that’s before voluntary churn even enters the picture. A proper dashboard doesn’t just show you these numbers. It alerts you when something’s wrong before it becomes a crisis.
The best SaaS metrics dashboards in 2026 do three things exceptionally well:
- Native SaaS metrics: They calculate MRR, ARR, churn, LTV, and CAC correctly (not generic business metrics)
- Real-time integrations: They connect to Stripe, Chargebee, Recurly, HubSpot, and your other tools without engineering work
- Actionable insights: They tell you why numbers are moving, not just that they moved
The 10 Best SaaS Metrics Dashboard Tools for 2026
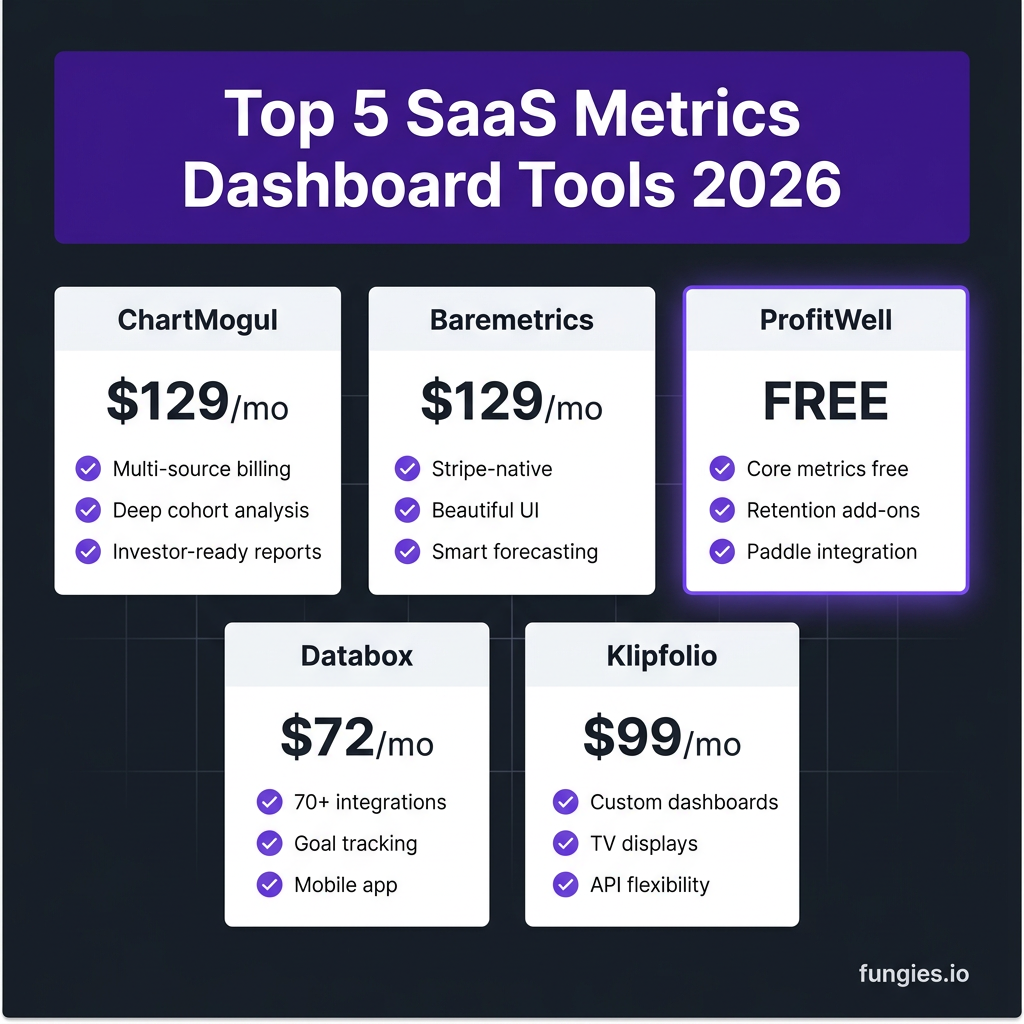
1. ChartMogul — Best for Scaling SaaS Companies
ChartMogul has been the gold standard for SaaS metrics since 2014, and it remains the most powerful option for companies with complex billing needs. If you’re processing revenue through multiple systems or need investor-grade reporting, this is your tool.
Key features:
- Multi-source billing integration (Stripe, Chargebee, Recurly, PayPal, and 10+ others)
- Deep cohort analysis and segmentation by plan, region, or custom attributes
- Net Revenue Retention (NRR) and Gross Revenue Retention (GRR) calculated automatically
- Investor-ready reports and forecasting models
- Team access controls and audit logs for compliance
Pricing: Starts at $129/month for up to $50K MRR. Scales based on revenue volume.
Best for: SaaS companies doing $500K+ ARR with multiple billing sources or complex pricing models. If your investors ask for cohort-level analysis, ChartMogul delivers.
2. Baremetrics — Best for Stripe-Native SaaS
Baremetrics built its reputation as the most beautiful Stripe analytics dashboard on the market. In 2026, it remains the best choice for founders who want polished, intuitive metrics without a steep learning curve.
Key features:
- One-click Stripe integration — live metrics in under 5 minutes
- Stunning visualizations that make board presentations effortless
- Smart forecasting based on historical trends and seasonality
- Recover (failed payment recovery) and Cancellation Insights built-in
- Benchmarks against similar companies in your revenue range
Pricing: Starts at $129/month. Recover and Cancellation Insights are add-ons at $50/month each.
Best for: Stripe-based SaaS companies from $10K to $2M MRR that prioritize UX and want founder-friendly dashboards without technical setup.
3. ProfitWell (Paddle Retain) — Best Free Option
ProfitWell changed the game by offering core SaaS metrics completely free. After being acquired by Paddle, it’s now Paddle Retain — but the free metrics product remains, making it the obvious choice for early-stage founders.
Key features:
- Completely free MRR, ARR, churn, and LTV tracking
- Retention audit and pricing optimization (paid add-ons)
- Deep Paddle integration for Merchant of Record businesses
- Industry benchmarks from 30,000+ SaaS companies
- Easy setup with Stripe, Chargebee, or Recurly
Pricing: Core metrics are FREE. Retention and pricing features start at $1,000/month for larger companies.
Best for: Pre-revenue to $50K MRR startups that need professional metrics without the price tag. Honestly, there’s no reason not to start here.
4. Databox — Best for Multi-Source Business Dashboards
Databox takes a different approach than pure SaaS metrics tools. It connects to 70+ data sources — from Google Analytics to Facebook Ads to your SQL database — and lets you build custom dashboards that span your entire business.
Key features:
- 70+ native integrations including Stripe, HubSpot, Salesforce, and Google Ads
- Goal tracking with automated alerts when metrics drift
- Mobile app for checking metrics on the go
- Scorecards delivered to Slack or email daily/weekly
- Custom calculations and data blending across sources
Pricing: Starts at $72/month for 3 data sources and 3 users. Professional plan at $135/month unlocks unlimited sources.
Best for: SaaS companies that want to track marketing, sales, and product metrics alongside financials — not just pure subscription analytics.
5. Klipfolio — Best for Custom Dashboards and TV Displays
Klipfolio (now Klipfolio PowerMetrics) has evolved from a simple dashboard tool into a full business intelligence platform. Its strength is flexibility — if you can dream a dashboard, you can probably build it in Klipfolio.
Key features:
- Highly customizable dashboards with drag-and-drop builder
- TV mode for office displays and team visibility
- PowerMetrics catalog with pre-built KPIs for common use cases
- REST API and SQL connectors for custom data sources
- White-label options for agencies and consultants
Pricing: Starts at $99/month for 5 users and 10 dashboards. White-label starts at $199/month.
Best for: Teams that need highly customized dashboards or want to display metrics on office TVs for transparency.
6. Geckoboard — Best for Real-Time Operational Dashboards
Geckoboard focuses on one thing and does it exceptionally well: real-time dashboards for operational teams. If you need a dashboard that updates every few seconds and displays beautifully on a TV, this is your tool.
Key features:
- Lightning-fast real-time updates (as fast as your data source allows)
- 60+ integrations with focus on support, sales, and infrastructure tools
- Optimized for large-screen TV displays in offices
- Simple setup — most dashboards live in under 30 minutes
- Slack alerts when metrics cross thresholds
Pricing: Starts at $49/month for 1 dashboard and 3 users. Pro plan at $99/month unlocks unlimited dashboards.
Best for: Support and ops teams that need to see real-time metrics like ticket volume, response times, and system status at a glance.
7. Mixpanel — Best for Product Analytics Integration
Mixpanel isn’t a pure SaaS metrics dashboard — it’s a product analytics powerhouse. But for SaaS companies that want to connect user behavior to revenue, it’s unbeatable.
Key features:
- Deep product analytics: funnels, retention, and user flows
- Revenue analytics that connect product usage to MRR
- Cohort analysis by feature adoption or user behavior
- AI-powered insights that surface trends automatically
- Real-time event tracking with sub-second latency
Pricing: Free up to 1 million events/month. Growth plan starts at $20/month for 10K events, scaling with volume.
Best for: Product-led growth (PLG) companies that need to understand how user behavior drives revenue.
8. Amplitude — Best for Enterprise Product Analytics
Amplitude is the enterprise alternative to Mixpanel. It offers deeper analytics, better governance, and more powerful segmentation — at a higher price point and with more complexity.
Key features:
- Advanced behavioral cohorting and user segmentation
- Experimentation platform built-in for A/B testing
- Data governance and compliance features for enterprise
- Predictive analytics using machine learning
- Robust data warehouse integrations
Pricing: Free plan available. Growth plan starts at $2,000/year. Enterprise pricing custom.
Best for: Mid-market to enterprise SaaS with dedicated data teams and complex product analytics needs.
9. Metabase — Best Open-Source Option
Metabase is the go-to open-source business intelligence tool for technical teams. If you have SQL skills and want full control over your metrics without paying per-user fees, Metabase is hard to beat.
Key features:
- Completely free self-hosted option
- Visual query builder for non-technical users
- SQL editor for complex custom queries
- Dashboards with auto-refresh and alerts
- Active open-source community with 30,000+ GitHub stars
Pricing: Self-hosted is FREE. Cloud hosting starts at $85/month for 5 users.
Best for: Technical founders and teams with SQL expertise who want full control and zero per-user costs.
10. Google Looker Studio — Best Free Business Intelligence
Formerly Google Data Studio, Looker Studio is Google’s free BI tool. It’s not SaaS-specific, but with the right connectors, you can build powerful dashboards at zero cost.
Key features:
- Completely free with no usage limits
- Native Google ecosystem integration (Analytics, Ads, Sheets)
- Community connectors for Stripe, HubSpot, and 100+ other sources
- Easy sharing and embedding in reports
- Custom calculations and data blending
Pricing: FREE. (Looker Studio Pro at $9/user/month adds enterprise features)
Best for: Bootstrapped SaaS on a tight budget that already uses Google tools and needs basic dashboards without complexity.

How to Choose the Right SaaS Metrics Dashboard
With 10 solid options, how do you pick the right one? Here’s my decision framework based on working with dozens of SaaS companies:
Step 1: Identify Your Stage
Pre-revenue to $10K MRR? Start with ProfitWell (free) or Google Looker Studio. $10K to $100K MRR? Baremetrics or ChartMogul depending on your billing complexity. $100K+ MRR? You probably need ChartMogul’s advanced features or a custom BI setup with Metabase.
Step 2: List Your Data Sources
If you’re Stripe-only, Baremetrics is perfect. Using Chargebee, Recurly, or multiple processors? ChartMogul handles this better. Need marketing and sales data alongside revenue? Databox or Klipfolio are stronger choices.
Step 3: Define Your Key Metrics
Every SaaS should track MRR, ARR, churn, LTV, and CAC. But do you also need product analytics? Support metrics? Marketing attribution? The more diverse your metric needs, the more you should lean toward general BI tools like Databox or Metabase.
Step 4: Check Integration Quality
Not all integrations are equal. ChartMogul and Baremetrics have deep, native Stripe integrations. Databox has breadth (70+ sources) but sometimes lacks depth. Test the specific integrations you need before committing.
Step 5: Start Small and Scale
Most of these tools have free tiers or trials. Don’t overthink it — pick one, connect your data, and start tracking. You can always migrate later. The cost of not having visibility into your metrics far exceeds the cost of switching tools.
SaaS Metrics Dashboard Comparison Table
| Tool | Starting Price | Best For | Stripe Integration | Free Tier |
|---|---|---|---|---|
| ChartMogul | $129/mo | Scaling SaaS, multi-source | Excellent | No |
| Baremetrics | $129/mo | Stripe-native SaaS | Native | No |
| ProfitWell | FREE | Early-stage startups | Good | Yes |
| Databox | $72/mo | Multi-source business dashboards | Good | Limited |
| Klipfolio | $99/mo | Custom dashboards, TV displays | Via API | No |
| Geckoboard | $49/mo | Real-time ops dashboards | Via Zapier | Trial |
| Mixpanel | $20/mo | Product analytics + revenue | Good | Yes |
| Amplitude | $2,000/yr | Enterprise product analytics | Good | Yes |
| Metabase | FREE (self-hosted) | Technical teams, SQL users | Via SQL | Yes |
| Looker Studio | FREE | Budget-conscious startups | Via connector | Yes |
FAQ: SaaS Metrics Dashboards
What’s the difference between a SaaS metrics dashboard and a BI tool?
SaaS metrics dashboards like ChartMogul and Baremetrics calculate subscription-specific metrics (MRR, churn, LTV) automatically. General BI tools like Looker Studio or Metabase can display any data but require you to define and calculate SaaS metrics yourself. If you’re serious about SaaS, use a tool that understands subscription businesses.
Can I build my own SaaS metrics dashboard?
Absolutely — and many technical teams do. But here’s what I’ve learned: building accurate MRR calculations that handle prorations, plan changes, and refunds correctly is surprisingly complex. Most DIY dashboards I’ve seen have subtle bugs that mislead founders. Unless you have dedicated data engineering resources, buying is usually smarter than building.
How often should I check my SaaS metrics dashboard?
Daily for operational metrics (MRR, churn, failed payments). Weekly for growth metrics (CAC, LTV, payback period). Monthly for strategic metrics (NRR, cohort retention). Set up alerts so the dashboard tells you when something needs attention — don’t just stare at it.
What’s the most important SaaS metric to track?
Net Revenue Retention (NRR). It tells you whether your existing customers are growing or shrinking. An NRR above 100% means you’re growing even without new customers — the hallmark of a healthy SaaS business. Top-quartile SaaS companies have NRR of 120% or higher.
Do I need multiple dashboard tools?
Most SaaS companies end up with 2-3 tools: one for revenue metrics (ChartMogul/Baremetrics), one for product analytics (Mixpanel/Amplitude), and sometimes one for marketing attribution. The key is having a single source of truth for each metric category, not necessarily a single tool for everything.
Conclusion: Start Tracking What Matters
The SaaS companies that win aren’t the ones with the most data — they’re the ones with the clearest view of what matters. A good metrics dashboard doesn’t just display numbers; it tells you whether your business is healthy, where you’re leaking revenue, and what to fix next.
If you’re just starting out, grab ProfitWell (it’s free) and get visibility today. If you’re scaling and need investor-grade reporting, ChartMogul or Baremetrics will serve you well. And if you’re building a product-led growth machine, Mixpanel or Amplitude will connect user behavior to revenue in ways pure financial tools can’t.
Whatever you choose, the worst decision is continuing to fly blind. Your metrics are the vital signs of your business — start tracking them properly today.
Ready to monetize your SaaS? Create your free Fungies account and launch your store in minutes — we’ll handle payments, tax compliance, and global checkout so you can focus on growing your metrics.