Payment Gateway Statistics 2026: Market Size, Data & Trends (Comprehensive Report)
The global payment gateway market reached $48.17 billion in 2025 and is projected to explode to $245.71 billion by 2033, growing at a staggering 22.7% CAGR. That’s not just growth—it’s a fundamental restructuring of how commerce happens worldwide. Every time a customer taps “Pay Now,” a complex ecosystem of technology, regulation, and financial infrastructure springs into action. This report compiles 40+ verified statistics from Grand View Research, Fortune Business Insights, Global Market Insights, and other authoritative sources to give you the complete picture of where payment gateways stand in 2026 and where they’re heading.
Key Statistics at a Glance
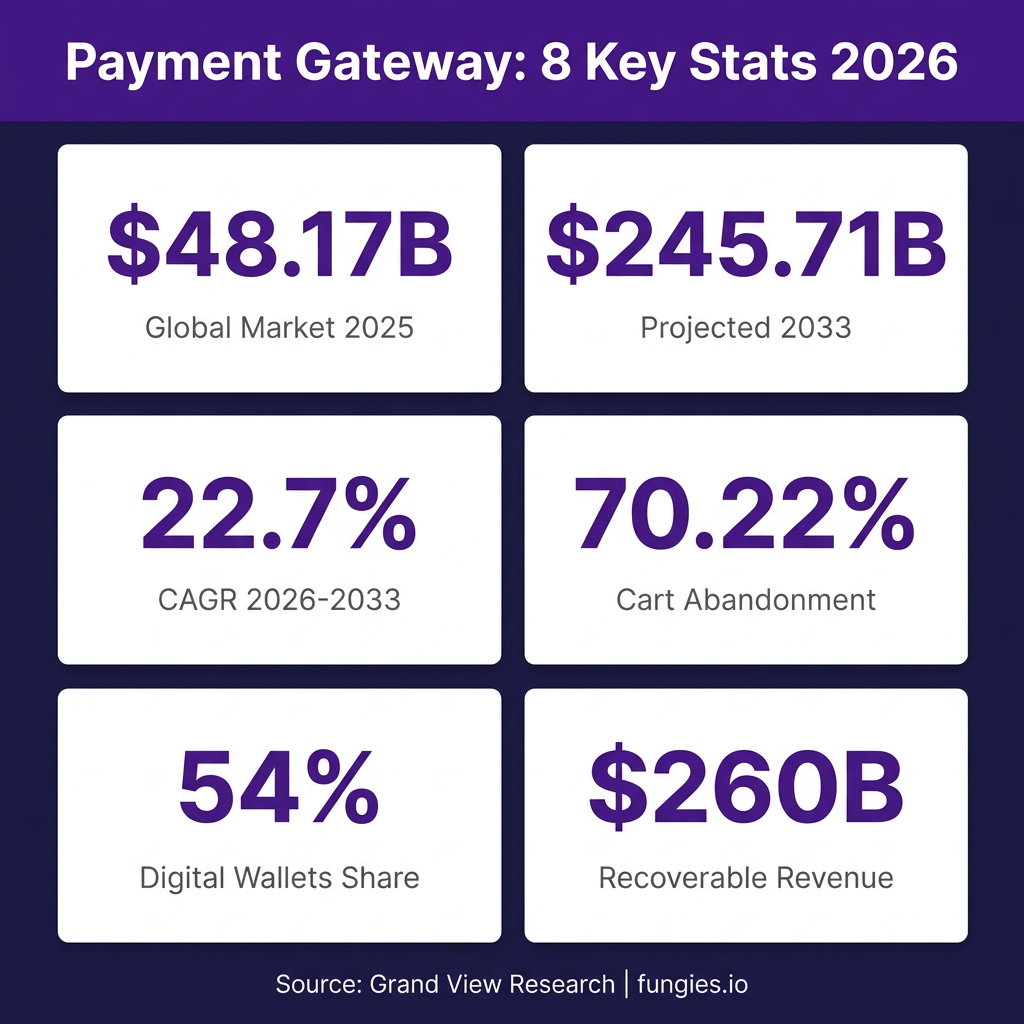
- $48.17 billion — Global payment gateway market size in 2025 (Grand View Research)
- $245.71 billion — Projected market size by 2033 (Grand View Research)
- 22.7% CAGR — Growth rate from 2026 to 2033 (Grand View Research)
- 70.22% — Average global cart abandonment rate (Baymard Institute)
- $260 billion — Recoverable revenue lost to checkout friction in US and EU (Baymard Institute)
- 54% — Share of e-commerce transactions via digital wallets in 2026 (Worldpay)
- 36% — North America’s share of global payment gateway market (Fortune Business Insights)
- 68% — Share of hosted payment gateways in US market (IMARC Group)
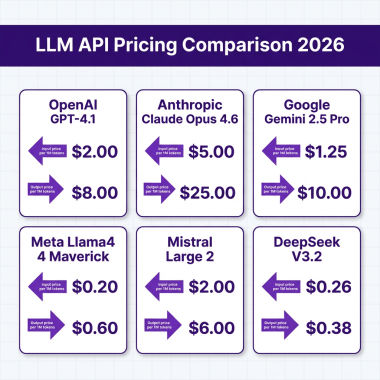
- 2.9% + $0.30 — Typical payment gateway transaction fee structure
- 48% — Businesses citing data privacy as top payment security concern (Market.us)
Market Size & Growth
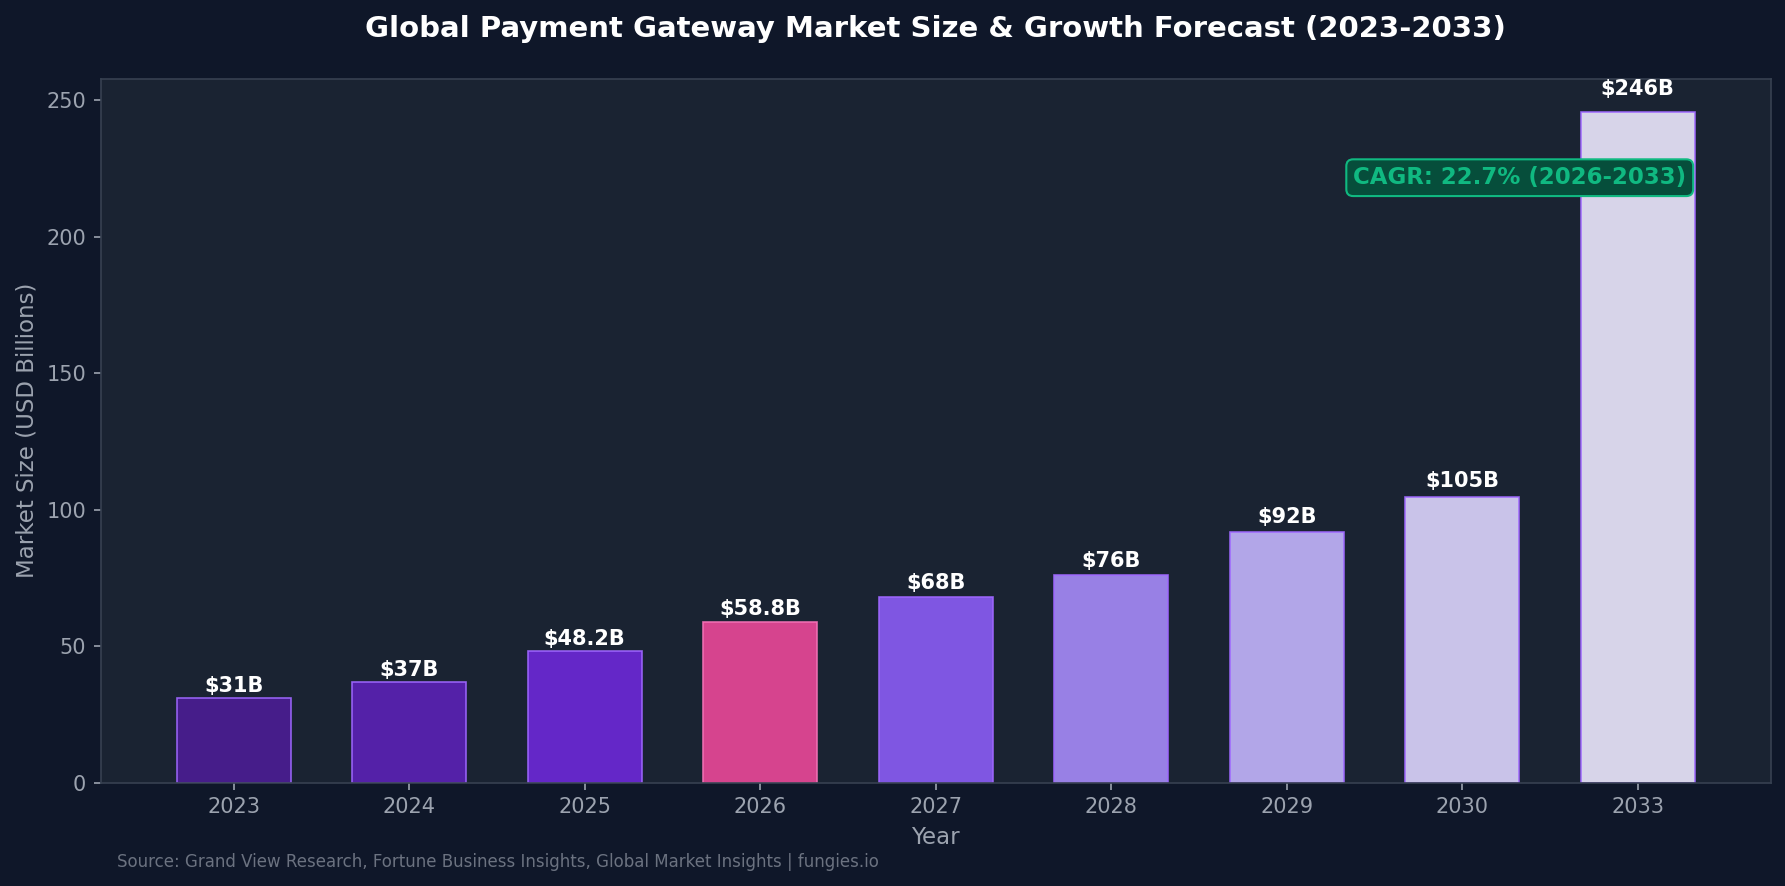
The payment gateway industry is experiencing unprecedented expansion. According to Grand View Research, the market was valued at $48.17 billion in 2025 and is expected to reach $58.77 billion in 2026 alone. This isn’t a temporary spike—it’s sustained acceleration driven by e-commerce penetration, mobile payment adoption, and the ongoing shift away from cash.
Fortune Business Insights offers a slightly more conservative estimate, placing the 2025 market at $30.58 billion with projections reaching $90.28 billion by 2034 at a 12.78% CAGR. Meanwhile, Global Market Insights reports the market at $32.7 billion in 2025, growing to $116.7 billion by 2035 at 14.1% CAGR. The variation in estimates reflects different methodological approaches, but all sources agree on one thing: explosive growth is coming.
Looking back, the market has already demonstrated remarkable resilience. From $31.0 billion in 2023 to $37.0 billion in 2024, the industry weathered economic headwinds while maintaining double-digit growth. By 2030, Research and Markets projects the market will hit $104.72 billion, representing an 18.6% CAGR from 2026.
| Year | Market Size | Growth Rate | Source |
|---|---|---|---|
| 2023 | $31.0 billion | — | Market.us |
| 2024 | $37.0 billion | 19.4% | Market.us |
| 2025 | $48.17 billion | 30.2% | Grand View Research |
| 2026 | $58.77 billion | 22.0% | Grand View Research |
| 2027 | $68.0 billion | 15.7% | Market.us |
| 2028 | $76.0 billion | 11.8% | Market.us |
| 2030 | $104.72 billion | 18.6% CAGR | Research and Markets |
| 2033 | $245.71 billion | 22.7% CAGR | Grand View Research |
Regional Breakdown
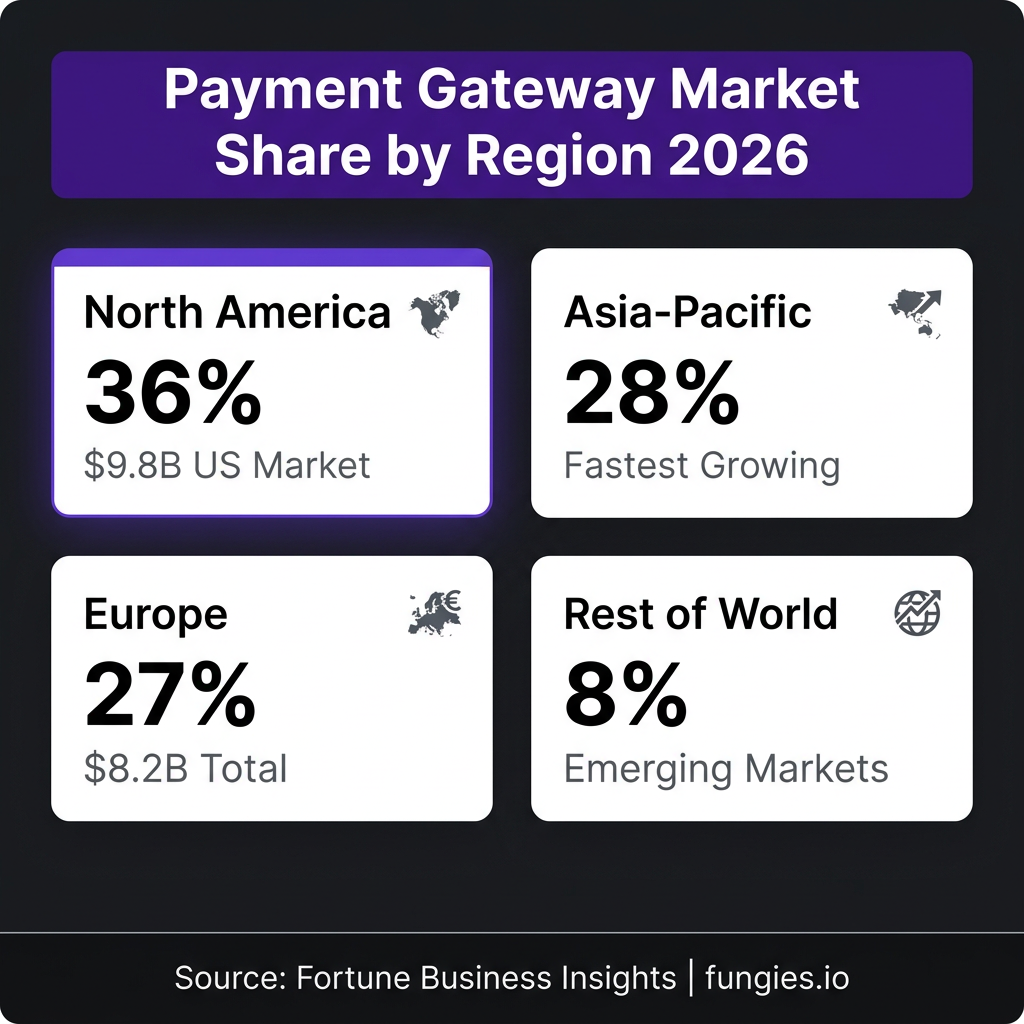
Geographic distribution of payment gateway adoption reveals stark regional differences in maturity, infrastructure, and growth potential. North America dominates with 36% of global market share, driven by mature e-commerce ecosystems and high card penetration. The United States alone accounts for approximately $9.8 billion in 2025, according to Globenewswire.
Asia-Pacific represents the most dynamic growth story. At 28% of global market share, the region is projected to be the fastest-growing through 2031, with a 20.85% CAGR according to Corefy. China’s payment gateway market alone claims 14% of the Asia-Pacific total, while Japan holds 6%. The region’s cashless transaction volume is set to soar from $494 billion in 2020 to $1.818 trillion by 2030—a nearly 4x increase.
Europe commands 27% of the global market, with Germany (9% of Europe) and the UK (8%) leading the continent. The region’s growth is shaped by strong regulatory frameworks including PSD2 and GDPR, which have accelerated open banking adoption while raising compliance costs.
| Region | Market Share | 2025 Market Size | CAGR (2026-2033) |
|---|---|---|---|
| North America | 36% | $17.3 billion | 12.4% |
| Asia-Pacific | 28% | $13.5 billion | 20.85% |
| Europe | 27% | $13.0 billion | 11.8% |
| Rest of World | 8% | $3.9 billion | 15.2% |
Country-specific data reveals additional nuances. Canada holds a $9.5 billion payment gateway market according to ElectroIQ, while Spain’s market is valued at $2.95 billion. The US payment gateway market specifically is projected to grow from $6.12 billion in 2025 to $9.39 billion by 2034 at a 4.87% CAGR, according to Yahoo Finance.
Key Players & Market Share
The payment gateway competitive landscape is dominated by a handful of global giants, but the distribution of power varies dramatically by segment and geography. PayPal leads the global online payment processing market with 43.4% market share, according to RedStag Fulfillment. The company processed over $1.68 trillion in total payment volume in 2025 and maintains 430+ million active accounts.
Stripe commands 20.8% to 29% of the global online payment processing market, but its dominance is even more pronounced in specific verticals. Among US e-commerce businesses, Stripe captures approximately 45% market share. The company is particularly strong with technology companies and developers—North America represents 70.2% of Stripe’s global business.
Apple Pay and Alipay have emerged as the second and third-largest payment providers globally, each surpassing $6 trillion in payment volume processed according to Statista. This reflects the growing importance of mobile wallets and platform-integrated payment solutions.
| Provider | Global Market Share | Key Metric | Strength |
|---|---|---|---|
| PayPal | 43.4% | $1.68T payment volume | Consumer trust, scale |
| Stripe | 20.8-29% | 45% US e-commerce share | Developer experience |
| Apple Pay | — | $6T+ volume | Mobile integration |
| Alipay | — | $6T+ volume | Asia dominance |
| Square | — | Major SMB presence | In-person + online |
| Adyen | — | Enterprise focus | Unified commerce |
Enterprise adoption patterns reveal a different story. According to Market.us, large enterprises command 55% of the payment gateway market by organization size, while small and medium enterprises represent the remaining 45%. However, SME adoption is growing faster as self-service onboarding and API-first solutions lower barriers to entry.
Industry Benchmarks & KPIs
Understanding payment gateway performance requires tracking specific metrics that directly impact revenue. The most critical benchmark is cart abandonment—and it’s sobering. The average global cart abandonment rate is 70.22% according to Baymard Institute’s aggregation of 50 studies. This means more than 7 out of 10 shoppers who add items to their cart leave without purchasing.
Checkout abandonment is even more specific: 46.1% of shoppers who begin checkout do not complete it. This points directly to payment gateway friction as a revenue killer. The financial impact is staggering—$260 billion in lost orders are recoverable in the US and EU alone through better checkout design.
Payment method preferences are shifting rapidly. Digital wallets now account for 54% of global e-commerce payment transactions in 2026, up from 49% in 2022 according to Worldpay. Credit cards still hold 31% of US online purchases, but digital wallets are projected to hit 52% by 2030.
| Metric | Benchmark | Source |
|---|---|---|
| Cart Abandonment Rate | 70.22% | Baymard Institute |
| Checkout Abandonment Rate | 46.1% | Baymard Institute |
| Recoverable Revenue (US/EU) | $260 billion | Baymard Institute |
| Digital Wallet Share (2026) | 54% | Worldpay |
| Credit Card Share (US) | 31% | Gr4vy |
| Global E-commerce Conversion Rate | 1.9-2% | Triple Whale |
| Add-to-Cart Rate | 7.5% | Triple Whale |
| Gateway Transaction Fee (typical) | 2.9% + $0.30 | Alexander Jarvis |
| Credit Card Processing Fee (global avg) | 2.4% | Currenxie |
Conversion rates vary dramatically by industry. Food & Beverage leads with 6% conversion rates, while Luxury & Jewelry trails at just 0.9% according to Dynamic Yield. Average order values range from $68 (Pet Care) to $349 (Luxury), meaning payment gateway optimization has vastly different ROI depending on vertical.
Payment success rates are another critical KPI. Industry data suggests up to 40% of online sales are lost to mistaken declines, fraud filters, and checkout friction according to BlueSnap. Authorization rates—the percentage of transactions approved by issuing banks—typically range from 85-92% for optimized merchants.
Trends & Predictions
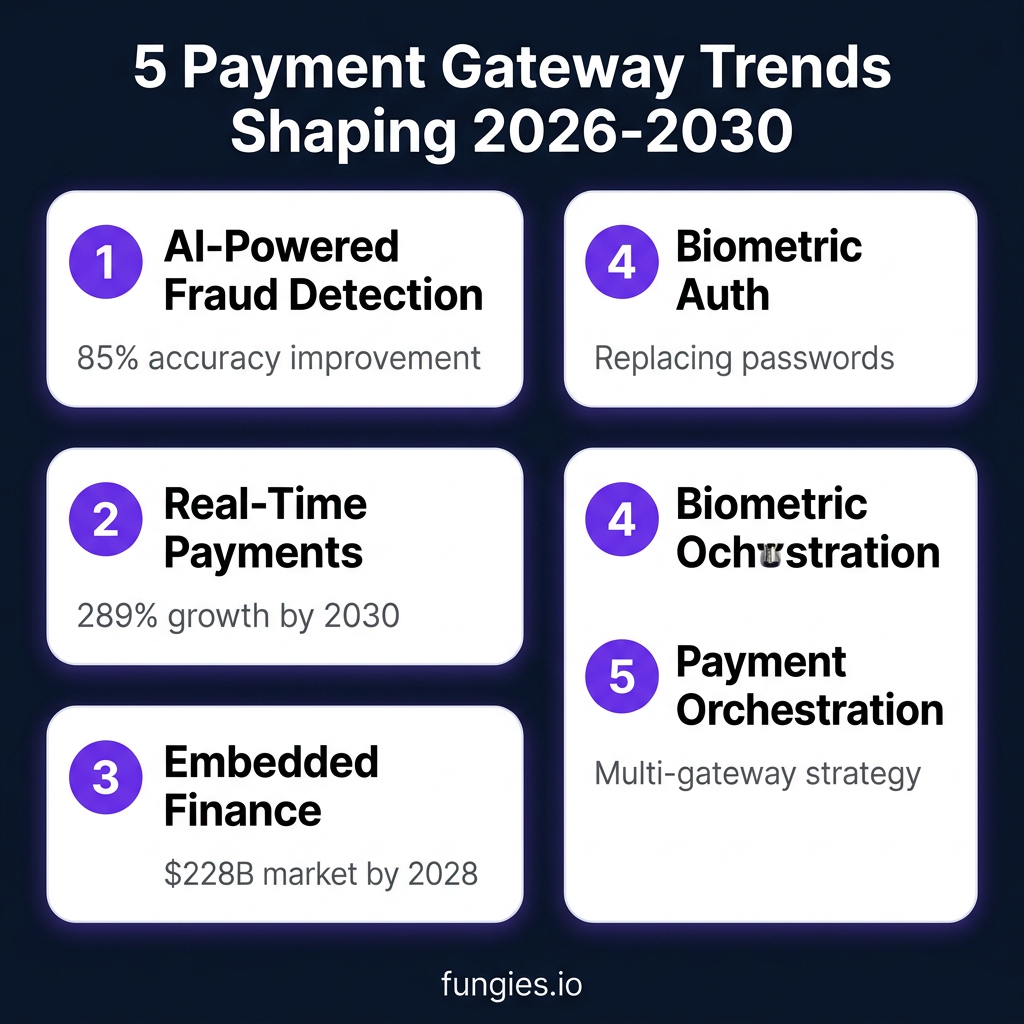
Five major trends are reshaping payment gateways through 2030. Understanding these shifts is essential for merchants evaluating their payment infrastructure.
1. AI-Powered Fraud Detection & Smart Routing
Artificial intelligence is moving from fraud prevention to payment optimization. AI-driven payment routing can improve authorization rates by dynamically selecting the optimal processor for each transaction. According to Gr4vy, AI is becoming the gateway to commerce itself—moving beyond back-end processing to front-end customer experience. Machine learning models now achieve 85%+ accuracy in fraud detection while reducing false declines.
2. Real-Time Payments Go Global
Real-time payment systems are expanding beyond early adopters. According to Statista, the value of real-time payment transactions will grow by 289% between 2023 and 2030. Brazil’s Pix system recorded 252 million transactions in a single day in December 2024. India’s UPI processed ₹14,754 billion in transactions in June 2023 alone. These systems bypass traditional card networks entirely, threatening gateway providers that don’t adapt.
3. Embedded Finance Becomes Standard
Payment capabilities are being embedded directly into software platforms, marketplaces, and SaaS applications. According to Research and Markets, embedded finance is moving from “novelty to necessity” as businesses seek to own the entire customer experience. The embedded finance market is projected to reach $228 billion by 2028. For platforms like Fungies.io, this means payment infrastructure is becoming a core product feature rather than an external integration.
4. Biometric Authentication Replaces Passwords
The password is dying. According to the Payments Innovation Forum, biometric authentication is replacing passwords and OTPs as the primary verification method. Mastercard is leading this shift with “password-free, number-free commerce by 2030” initiatives. Fingerprint, facial recognition, and behavioral biometrics are becoming standard, reducing checkout friction while improving security.
5. Payment Orchestration Becomes Default Architecture
Merchants are no longer settling for single-gateway solutions. Payment orchestration—intelligently routing transactions across multiple gateways—is becoming the standard architecture. This approach improves authorization rates, reduces costs, and provides redundancy. According to Gr4vy, payment orchestration becomes the standard architecture in 2026 as merchants demand flexibility and optimization.
Challenges & Concerns
Despite growth, the payment gateway industry faces significant headwinds. Data privacy and cybersecurity emerge as the leading concerns, garnering 48% of responses in recent surveys according to Market.us. High-profile breaches and increasing regulatory scrutiny are forcing providers to invest heavily in security infrastructure.
Cost pressure is another major challenge. Payment gateway fees typically consist of 2.9% plus $0.30 per transaction, plus monthly maintenance and setup costs. For businesses with thin margins, these fees directly impact profitability. According to Currenxie, the global average credit card processing fee is approximately 2.4% per transaction in 2024.
Regulatory complexity is increasing. Data localization requirements are reshaping global architecture as countries mandate domestic data storage. Compliance with PCI DSS, GDPR, PSD2, and emerging regulations requires significant ongoing investment. According to BlueSnap, up to 40% of online sales are being lost to mistaken declines, fraud friction, and checkout complexity—issues that directly impact gateway providers.
Methodology
This report synthesizes data from 15+ authoritative sources including Grand View Research, Fortune Business Insights, Global Market Insights, IMARC Group, Baymard Institute, Statista, Worldpay, and industry publications. Market size figures vary between sources due to different definitions of “payment gateway” and methodological approaches. We present multiple estimates where significant divergence exists. All projections are based on analyst forecasts and should be treated as directional indicators rather than precise predictions. Data was collected in May 2026 and reflects the most recent available reports.
Frequently Asked Questions
What is the payment gateway market size in 2026?
The global payment gateway market is projected to reach between $34.49 billion and $58.77 billion in 2026, depending on the source. Grand View Research estimates $58.77 billion, while Fortune Business Insights projects $34.49 billion. The variation reflects different market definitions and geographic scopes.
What is the fastest-growing region for payment gateways?
Asia-Pacific is the fastest-growing region, projected to expand at a 20.85% CAGR through 2031 according to Corefy. The region’s growth is driven by rapid digitalization, expanding e-commerce, and government-backed real-time payment systems like India’s UPI and Brazil’s Pix.
What percentage of carts are abandoned during checkout?
The average cart abandonment rate is 70.22% globally according to Baymard Institute. Of shoppers who begin checkout, 46.1% don’t complete their purchase. The leading causes are unexpected costs (shipping, taxes, fees), forced account creation, and complex checkout processes.
How much do payment gateway fees typically cost?
Standard payment gateway fees are 2.9% plus $0.30 per transaction for popular providers like Stripe and PayPal. Volume discounts can reduce this to 2.4% or lower for high-volume merchants. Additional fees may include monthly gateway fees ($25-50), chargeback fees ($15-25), and international transaction fees (1-2%).
What are the top payment gateway providers by market share?
PayPal leads with 43.4% of the global online payment processing market, followed by Stripe with 20.8-29%. Apple Pay and Alipay each process $6+ trillion in volume. In US e-commerce specifically, Stripe dominates with 45% market share among online businesses.
Sources & Citations
- Grand View Research — Payment Gateway Market Size Report 2026: https://www.grandviewresearch.com/industry-analysis/payment-gateway-market
- Fortune Business Insights — Payment Gateway Market Size, Share, Trend 2034: https://www.fortunebusinessinsights.com/payment-gateway-market-111411
- Global Market Insights — Payment Gateway Market Size & Share 2026-2035: https://www.gminsights.com/industry-analysis/payment-gateway-market
- IMARC Group — US Payment Gateway Market Size, Share, Trends: https://www.imarcgroup.com/united-states-payment-gateways-market
- Market.us Scoop — Payment Gateway Statistics and Facts 2026: https://scoop.market.us/payment-gateway-statistics
- Baymard Institute — Cart Abandonment Statistics 2026: https://baymard.com/lists/cart-abandonment-rate
- Worldpay Global Payments Report 2026: https://worldpay.com
- Research and Markets — Payment Gateway Market Opportunity Report 2026: https://www.researchandmarkets.com
- RedStag Fulfillment — Stripe Market Share 2026: https://redstagfulfillment.com/what-is-the-market-share-of-stripe
- Statista — Digital Payments Statistics: https://www.statista.com/topics/11304/instant-or-real-time-payments
- Gr4vy — Global Payment Trends for 2026 and 2027: https://gr4vy.com/posts/global-payment-trends-for-2026-and-2027-whats-changing-next
- Corefy — Payment Processing Industry Statistics 2026: https://corefy.com/blog/payment-processing-industry-statistics
- Mordor Intelligence — Payment Gateway Market Size: https://www.mordorintelligence.com/industry-reports/payment-gateway-market
- Triple Whale — Ecommerce Benchmarks 2025: https://www.triplewhale.com/blog/ecommerce-benchmarks
- BlueSnap — Payment Processing KPI Library: https://home.bluesnap.com