Payment Processing Statistics 2026: Market Size, Data & Trends (Comprehensive Report)
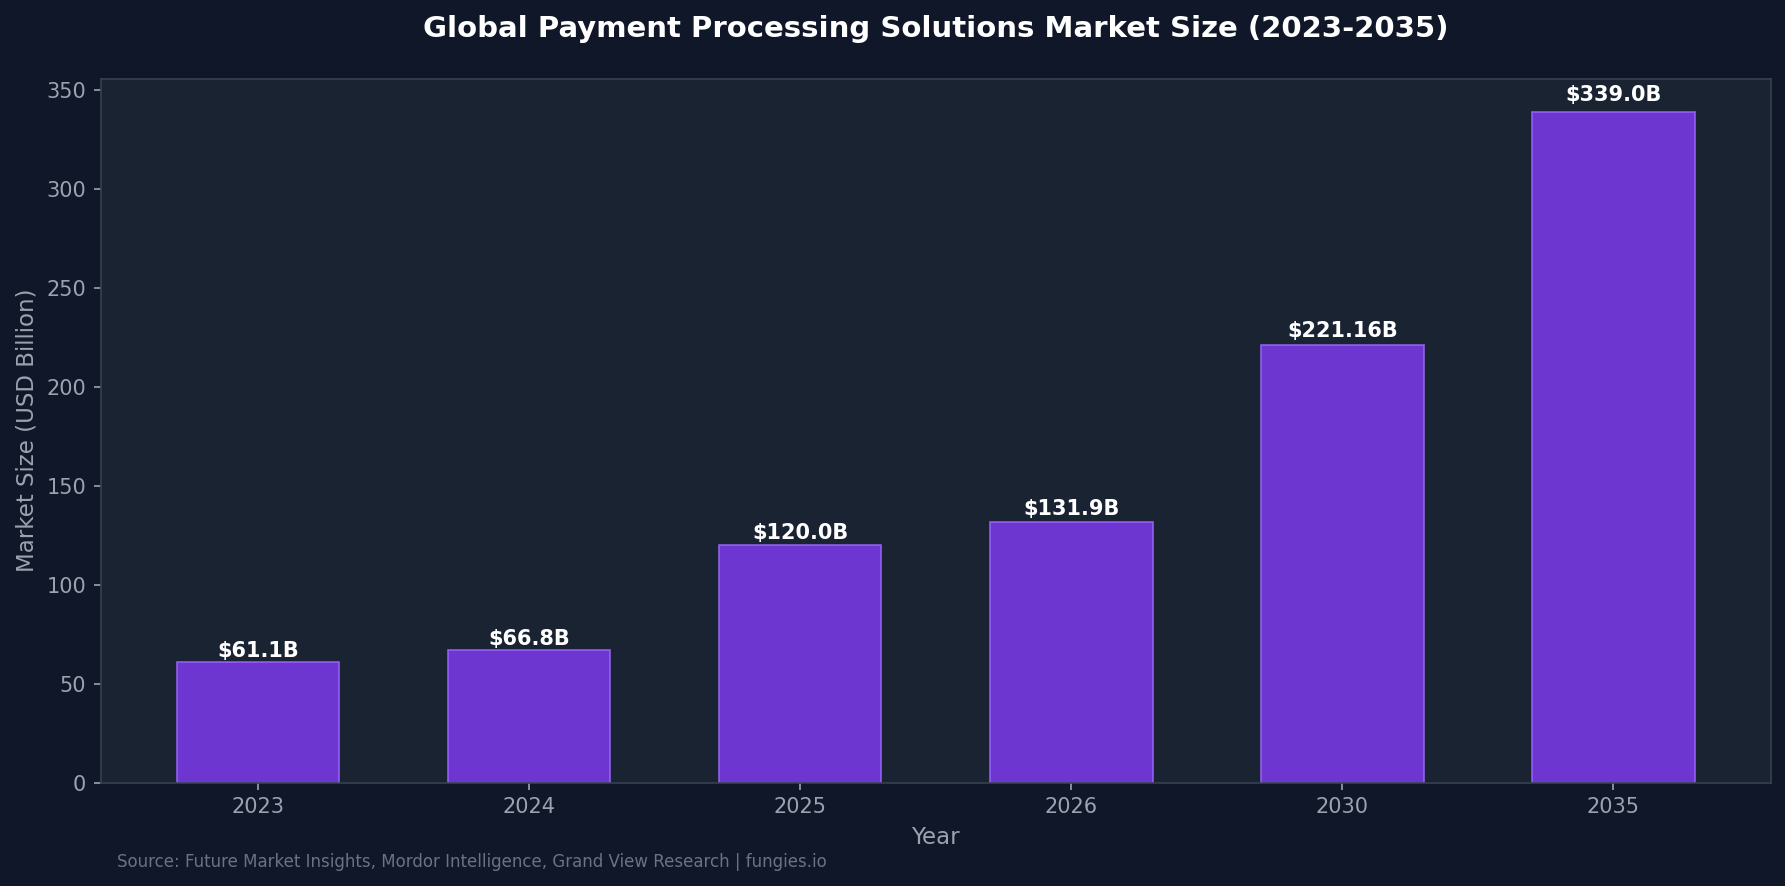
The global payment processing industry is experiencing unprecedented growth, driven by digital transformation, e-commerce expansion, and shifting consumer preferences. In 2026, the market is projected to reach $131.9 billion, with long-term forecasts suggesting a staggering $339 billion by 2036. This comprehensive report compiles the most authoritative statistics, market data, and trend analysis to serve as a primary reference for industry professionals, investors, and business decision-makers.
Key Statistics at a Glance
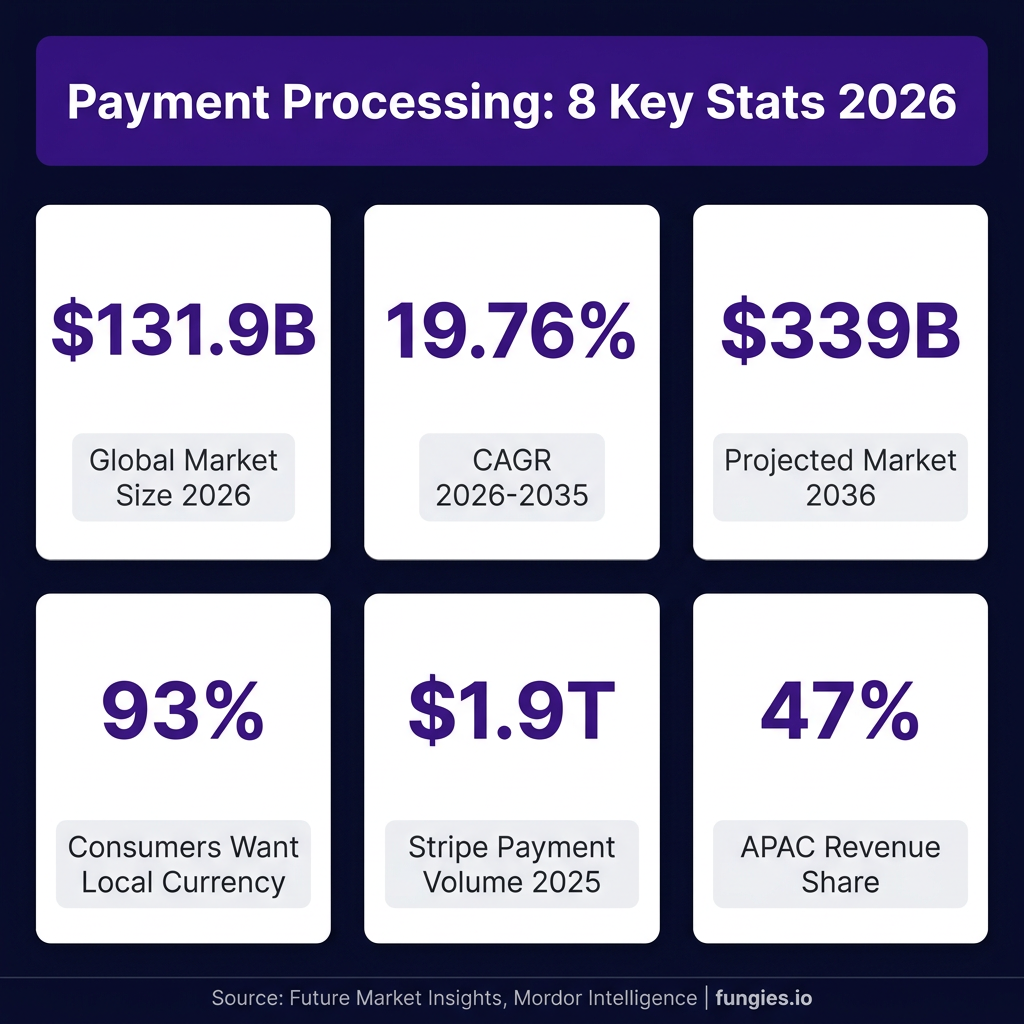
- The global payment processing solutions market is valued at $131.9 billion in 2026, up from $120.0 billion in 2025 (Future Market Insights)
- The market is projected to grow at a CAGR of 19.76% from 2026 to 2035, reaching $1.05 trillion by 2035 (Precedence Research)
- 93% of global consumers say pricing in their local currency affects their purchase decision (Airwallex)
- Stripe processed $1.9 trillion in total payment volume in 2025 (Chargeflow)
- PayPal and Stripe together command approximately 65% of web payment market share (Statista via LinkedIn)
- North America holds 36.21% of the global market share in 2025 (Fortune Business Insights)
- Asia Pacific generates 47% of global payments revenues ($1 trillion annually) (Merchant Savvy)
- The payment processor market is forecast to grow from $71.15 billion in 2026 to $122.08 billion by 2031 at 11.4% CAGR (Research and Markets)
Market Size & Growth Analysis
The payment processing solutions market has demonstrated remarkable resilience and growth trajectory. According to Grand View Research, the market was valued at $47.61 billion in 2022 and is projected to reach $139.90 billion by 2030, representing a CAGR of 14.5%. However, more recent analyses from Precedence Research suggest even more aggressive expansion, with the market estimated at $173.38 billion in 2025 and projected to hit $208.57 billion by 2026.
The disparity in market size estimates reflects different methodological approaches and segment definitions. Future Market Insights reports a more conservative $120.0 billion valuation for 2025, growing to $131.9 billion by 2026 at a 9.9% CAGR. Mordor Intelligence positions the market at $82.14 billion in 2025, expanding to $96.89 billion in 2026 and reaching $221.16 billion by 2031 at 17.95% CAGR.
According to McKinsey’s Global Payments Report, global payments revenue increased by an average of 7% annually from 2019 to 2024, with interest income comprising 46% of total revenues. This sustained growth reflects the fundamental shift from cash to digital payments across all sectors.
| Year | Market Size (USD Billion) | Growth Rate | Source |
|---|---|---|---|
| 2022 | $47.61B | — | Grand View Research |
| 2023 | $61.1B | 28.3% | Airwallex |
| 2024 | $66.8B | 9.3% | GM Insights |
| 2025 | $120.0B – $173.4B | 79.6% – 159% | Multiple Sources |
| 2026 | $131.9B – $208.6B | 10.0% – 20.3% | Future Market Insights |
| 2030 | $139.9B – $221.2B | CAGR 11.4% – 17.95% | Grand View Research |
| 2035 | $1,051.9B | CAGR 19.76% | Precedence Research |
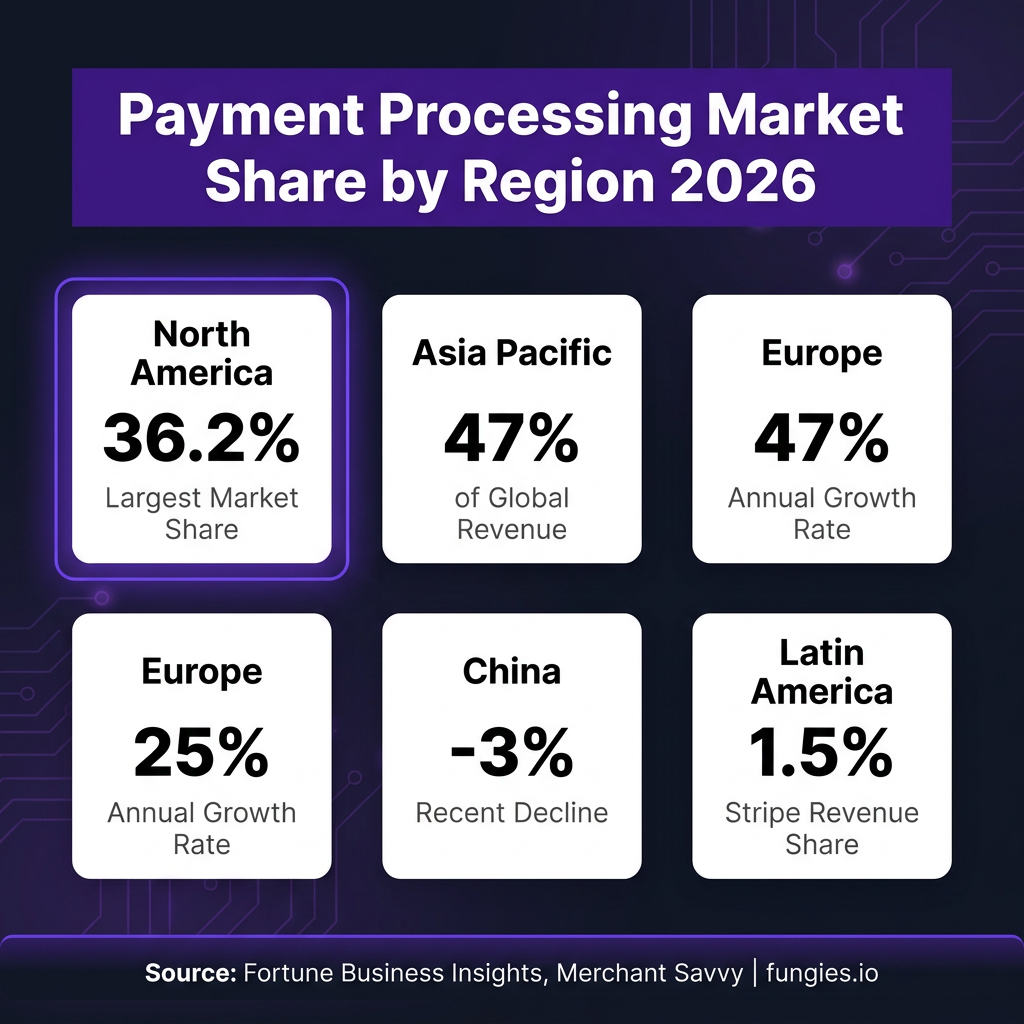
Regional Market Breakdown
Geographic distribution of payment processing revenues reveals significant regional variations in adoption, regulation, and market maturity. North America dominates with 36.21% market share in 2025, driven by high digital payment penetration and mature fintech ecosystems (Fortune Business Insights).
Asia Pacific represents the most dynamic region, generating 47% of global payments revenues—approximately $1 trillion annually. The region posted the fastest annual growth rate of 25% when excluding China, which experienced a 3% decline (Merchant Savvy). This divergence reflects China’s already-mature digital payment infrastructure and regulatory adjustments.
Europe continues to expand through open banking initiatives and real-time payment systems. The region’s growth is propelled by regulatory frameworks like PSD2 and the emergence of pan-European payment solutions. According to J.P. Morgan’s 2026 Payments Outlook, European treasury professionals increasingly value embedded banking solutions for cross-border operations.
| Region | Market Share / Revenue | Growth Characteristics |
|---|---|---|
| North America | 36.21% | Mature market, high adoption |
| Asia Pacific | 47% of global revenue ($1T) | Fastest growth (25% annually) |
| Europe | Growing via open banking | PSD2, real-time payments expansion |
| China | Declining 3% | Market saturation, regulatory shifts |
| Latin America | 1.5% of Stripe’s global business | Emerging, 6-8% revenue growth |
Key Players & Competitive Landscape
The payment processing industry is characterized by intense competition among established giants and agile fintech disruptors. According to Forrester’s latest evaluation, Stripe, Adyen, and Fiserv lead the merchant payment provider space, with each vendor offering competitive solutions with specific strengths.
PayPal maintains the largest global market share at 43.4% in online payment processing, though Stripe dominates among technology companies and developers with 20.8% to 29% global market share and approximately 45% of the U.S. domestic market (Red Stag Fulfillment). Together, PayPal and Stripe command roughly 65% of web payment market share.
Stripe’s operational metrics demonstrate remarkable scale: $1.9 trillion in total payment volume in 2025, 1.5 million live websites using its platform, 500 million API requests processed daily, and 200 million active subscriptions managed. The company achieved a valuation of $159 billion with estimated net revenue of $5.84 billion in 2025 (Chargeflow).
North America represents 70.2% of Stripe’s global business, highlighting the region’s importance for payment infrastructure providers. Latin America contributes 1.5% but is growing rapidly, increasing from 6% to 8% of Stripe’s revenue between 2022 and 2025.
| Company | Global Market Share | U.S. Market Share | Key Metric |
|---|---|---|---|
| PayPal | 43.4% | Dominant | Largest global share |
| Stripe | 20.8% – 29% | 45% | $1.9T payment volume |
| Adyen | Leading | Growing | Enterprise focus |
| Fiserv | Leading | Strong | Banking integration |
| Square | Growing | Strong | 29% terminal shipment growth |
Industry Benchmarks & KPIs
Payment processing performance is measured through specific KPIs that directly impact revenue and customer experience. According to BlueSnap, up to 40% of online sales are currently being lost due to payment gateway shortcomings and checkout friction.
The payment conversion rate—calculated by dividing the number of purchases by the number of shoppers/visitors—remains the most fundamental metric for e-commerce merchants. Forrester reports that more than 10% of U.S. online adults encountered a technical failure at the point of checkout, representing significant revenue leakage.
AI applications in fraud detection and automation can potentially reduce operational costs by 30% (Airwallex). This cost reduction potential is driving significant investment in machine learning and automated risk management systems across the industry.
Localization remains critical: 93% of global consumers indicate that pricing in their local currency affects their purchase decision. Additionally, 72% of small businesses believe payment processing companies are the best system to support their financial services needs.
| KPI / Benchmark | Value | Source |
|---|---|---|
| Revenue lost to checkout issues | Up to 40% | BlueSnap |
| Consumers affected by checkout failures | 10%+ | Forrester |
| AI cost reduction potential | 30% | Airwallex |
| Consumers preferring local currency | 93% | Airwallex |
| SMBs trusting payment processors | 72% | Airwallex |
| Digital transaction value (2025) | $20+ trillion | Statista via GM Insights |
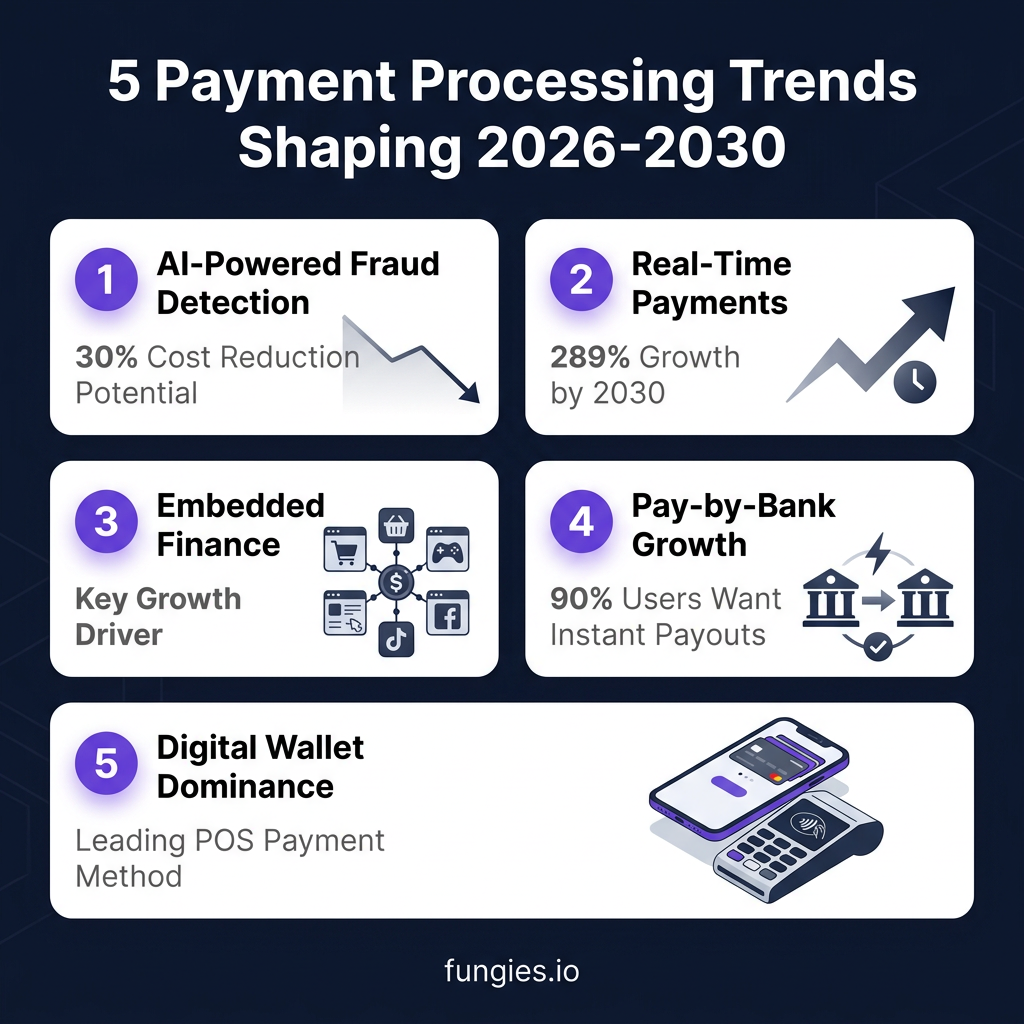
Trends & Predictions (2026-2030)
The payment processing landscape is undergoing fundamental transformation driven by technological innovation, regulatory evolution, and changing consumer expectations. Here are the five major trends shaping the industry’s future:
1. AI-Powered Fraud Detection & Automation
Artificial intelligence has become essential for keeping pace with new threat vectors. According to Airwallex, AI applications in automation and fraud detection can potentially reduce costs by 30%. Finance and iGaming sectors are investing heavily in adaptive systems that respond to threats in real-time (Zimpler).
2. Real-Time Payments Expansion
The value of transactions processed using real-time payment technology is forecast to grow by 289% between 2023 and 2030 (Statista). This explosive growth reflects consumer and business demand for instant settlement, with Visa research showing that 90% of users expect real-time payouts, which has become a key driver of trust and loyalty.
3. Embedded Finance Integration
Embedded banking and finance are perceived as highly valuable by treasury professionals. J.P. Morgan’s 2026 outlook identifies embedded finance as a key opportunity, with non-financial companies increasingly integrating payment capabilities directly into their platforms and customer experiences.
4. Pay-by-Bank & Account-to-Account (A2A) Growth
Pay-by-bank is stepping into the mainstream, delivering on speed, cost, and security simultaneously. According to Zimpler, this positions pay-by-bank as one of the most important payment trends for 2026. TrueLayer’s partnerships with Amazon and eBay demonstrate major retailer adoption of bank-based payments.
5. Digital Wallet Dominance
Digital and mobile wallets were the most used payment method in physical shops globally in 2025. According to Statista, real-time payments and digital wallets are capturing increasing market share across both POS and e-commerce channels, with significant regional variations in adoption rates.
Methodology & Data Sources
This report synthesizes data from authoritative industry sources including market research firms, financial institutions, and regulatory bodies. Primary sources include Future Market Insights, Grand View Research, Mordor Intelligence, Precedence Research, Fortune Business Insights, McKinsey Global Payments Report, J.P. Morgan Payments Outlook, Forrester Research, Statista, and company-specific reports from Stripe, PayPal, and other major processors.
Market size figures vary across sources due to different methodological approaches, segment definitions, and geographic scopes. We have presented multiple estimates where significant discrepancies exist, noting the source for each figure. All projections are based on publicly available analyst forecasts and should be considered directional indicators rather than precise predictions.
Data collection occurred in May 2026, with statistics reflecting the most recent available reports from 2025-2026. Currency conversions, where necessary, used prevailing exchange rates at the time of source publication.
Frequently Asked Questions
What is the current size of the payment processing market?
The global payment processing solutions market is valued between $131.9 billion and $208.6 billion in 2026, depending on the source and methodology. Future Market Insights reports $131.9 billion, while Precedence Research estimates $208.57 billion.
What is the projected growth rate for payment processing?
The market is projected to grow at a CAGR of 11.4% to 19.76% through 2035. Long-term forecasts suggest the market could reach $1.05 trillion by 2035 (Precedence Research) or $339 billion by 2036 (Future Market Insights).
Which companies dominate the payment processing market?
PayPal leads with 43.4% global market share, while Stripe dominates among technology companies with 20.8-29% global share and 45% of the U.S. market. Together, they command approximately 65% of web payment processing. Other major players include Adyen, Fiserv, and Square.
What are the biggest trends in payment processing for 2026?
The five major trends are: (1) AI-powered fraud detection and automation, (2) real-time payments expansion with 289% projected growth by 2030, (3) embedded finance integration, (4) pay-by-bank and A2A payment growth, and (5) continued digital wallet dominance in both POS and e-commerce.
How much revenue is lost due to payment processing issues?
According to BlueSnap, up to 40% of online sales are lost due to payment gateway shortcomings and checkout friction. Forrester reports that more than 10% of U.S. online adults encounter technical failures at checkout, representing significant revenue leakage for merchants.
Sources & Citations
- Future Market Insights – Payment Processing Solutions Market Report: futuremarketinsights.com
- Grand View Research – Payment Processing Solutions Market Size Report: grandviewresearch.com
- Mordor Intelligence – Payment Processor Market Analysis: mordorintelligence.com
- Precedence Research – Payment Processing Solutions Market Size: precedenceresearch.com
- Fortune Business Insights – Payment Processing Solutions Market: fortunebusinessinsights.com
- McKinsey – Global Payments Report 2025: mckinsey.com
- J.P. Morgan – Payments Outlook: Five Trends Powering Payments in 2026: jpmorgan.com
- Forrester – Merchant Payment Processing Research: forrester.com
- Statista – Payment Processing Software Market Share: statista.com
- Airwallex – 32 Payment Processing Industry Statistics: airwallex.com
- Chargeflow – Stripe Statistics 2026: chargeflow.io
- Red Stag Fulfillment – Stripe Market Share 2026: redstagfulfillment.com
- Merchant Savvy – Global Digital Payments Market Statistics: merchantsavvy.co.uk
- Research and Markets – Payment Processors Market Analysis: researchandmarkets.com
- BlueSnap – Payment Process Performance KPIs: bluesnap.com
- Zimpler – Payment Trends 2026: zimpler.com
- GM Insights – Payment Processing Solutions Market: gminsights.com
- Capgemini – World Payments Report 2026: capgemini.com
Last updated: May 21, 2026. This article is maintained as a living document. For corrections or additions, please contact the research team at Fungies.io.