SaaS Valuation Statistics 2026: Market Multiples, Data & Trends (Comprehensive Report)
The days of 20x revenue multiples for SaaS companies are firmly behind us. In 2026, the median private SaaS company trades at approximately 4.5x ARR—down from the double-digit multiples of 2021, but representing a stabilized “new normal” that investors and founders must navigate. Whether you’re preparing for an exit, raising your next round, or simply benchmarking your company’s performance, understanding current SaaS valuation data is essential.
This comprehensive report compiles data from over 2,700 M&A transactions, 100+ public SaaS companies, and industry-leading indices including the SaaS Capital Index and SEG SaaS Index. We’ve analyzed valuation multiples by company size, growth rate, geography, and AI positioning to give you the most complete picture of SaaS valuations in 2026.
Key Statistics at a Glance
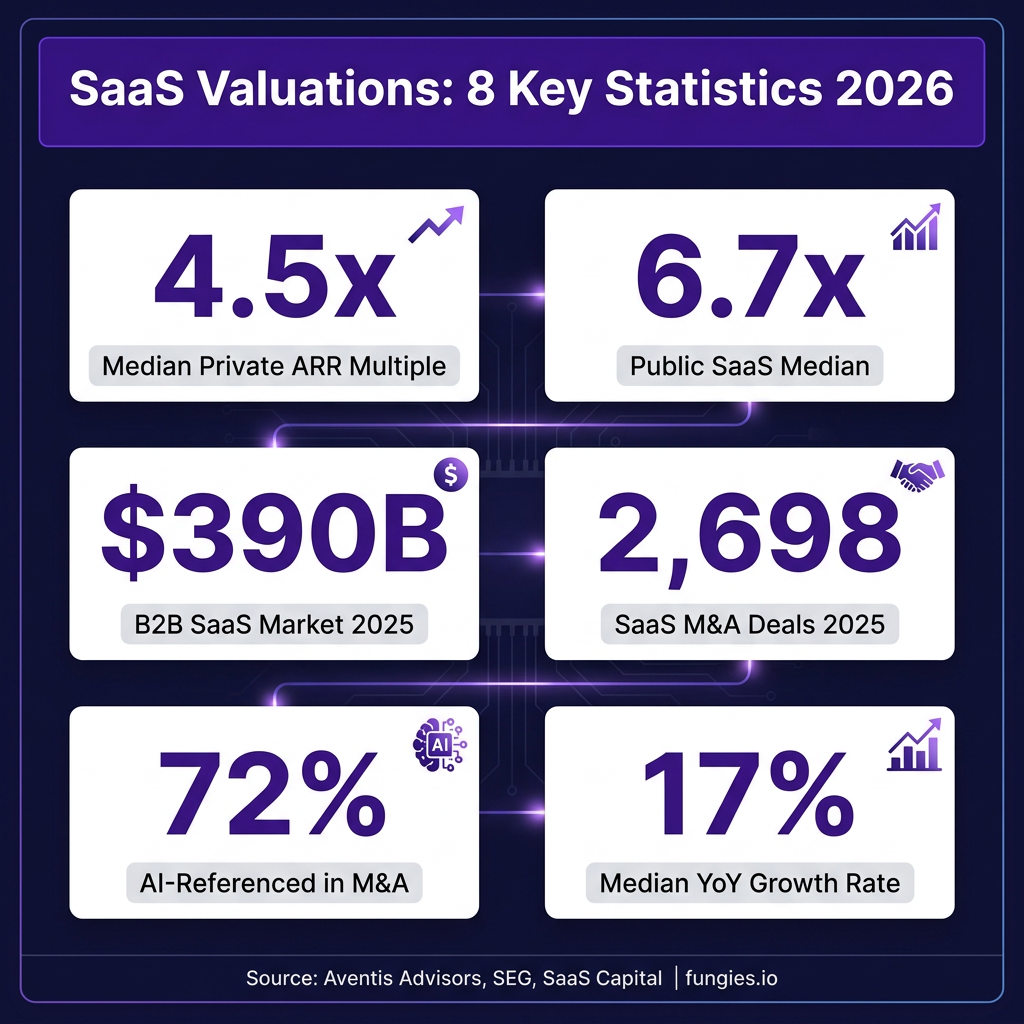
- 4.5x ARR — Median valuation multiple for private SaaS companies in 2026
- 6.7x EV/Revenue — Median multiple for public SaaS companies (SaaS Capital Index)
- $390 billion — Global B2B SaaS market size in 2025
- 2,698 deals — SaaS M&A transactions completed in 2025 (record high)
- 72% — Share of SaaS M&A targets referencing AI capabilities
- 17% — Median year-over-year revenue growth for SaaS companies (lowest since 2014)
- 3.3x to 6.2x — Valuation multiple range from $0-5M ARR to $500M+ ARR
- 12.5x — Median multiple for AI-native SaaS companies
- 80% — Share of SaaS companies growing below 20% annually
- 15-25% — UK SaaS valuation discount compared to US counterparts
Market Size & Growth
The global Software-as-a-Service market has reached unprecedented scale while entering a phase of more measured growth. According to Fortune Business Insights, the global SaaS market was valued at $315.68 billion in 2025 and is projected to grow to $375.57 billion in 2026. Looking further ahead, the market is expected to reach $1.48 trillion by 2034, representing a compound annual growth rate (CAGR) of 18.7%.
Mordor Intelligence provides slightly different but equally robust figures, estimating the 2026 SaaS market at $435.41 billion (up from $370.4 billion in 2025) with projections reaching $976.61 billion by 2031 at a 17.55% CAGR. The B2B SaaS segment specifically—of particular interest to enterprise software investors—was valued at $390 billion in 2025 and is forecast to reach $1.58 trillion by 2031, growing at an impressive 26.24% CAGR.
North America continues to dominate the global SaaS landscape, capturing more than 45% of total market share with approximately $147.8 billion in revenue during 2024. This regional concentration reflects the mature cloud infrastructure, higher enterprise IT spending, and density of SaaS headquarters in the United States.
| Metric | 2025 Value | 2026 Estimate | 2031/2034 Projection | CAGR |
|---|---|---|---|---|
| Global SaaS Market | $315.68B | $375.57B | $1.48T (2034) | 18.7% |
| Global SaaS (Mordor) | $370.4B | $435.41B | $976.61B (2031) | 17.55% |
| B2B SaaS Market | $390B | $492.34B | $1.58T (2031) | 26.24% |
| North America Share | $147.8B | ~$165B | ~$650B (2034) | — |
| SaaS CRM Segment | $54.98B | $65.99B | $164.53B (2031) | 20.05% |
The SaaS CRM market specifically represents a significant subsegment, valued at $54.98 billion in 2025 and projected to reach $65.99 billion in 2026. With a forecasted value of $164.53 billion by 2031, the CRM segment is growing at a 20.05% CAGR—outpacing the broader SaaS market due to continued digital transformation of sales and customer service functions.
Valuation Multiples by Company Size
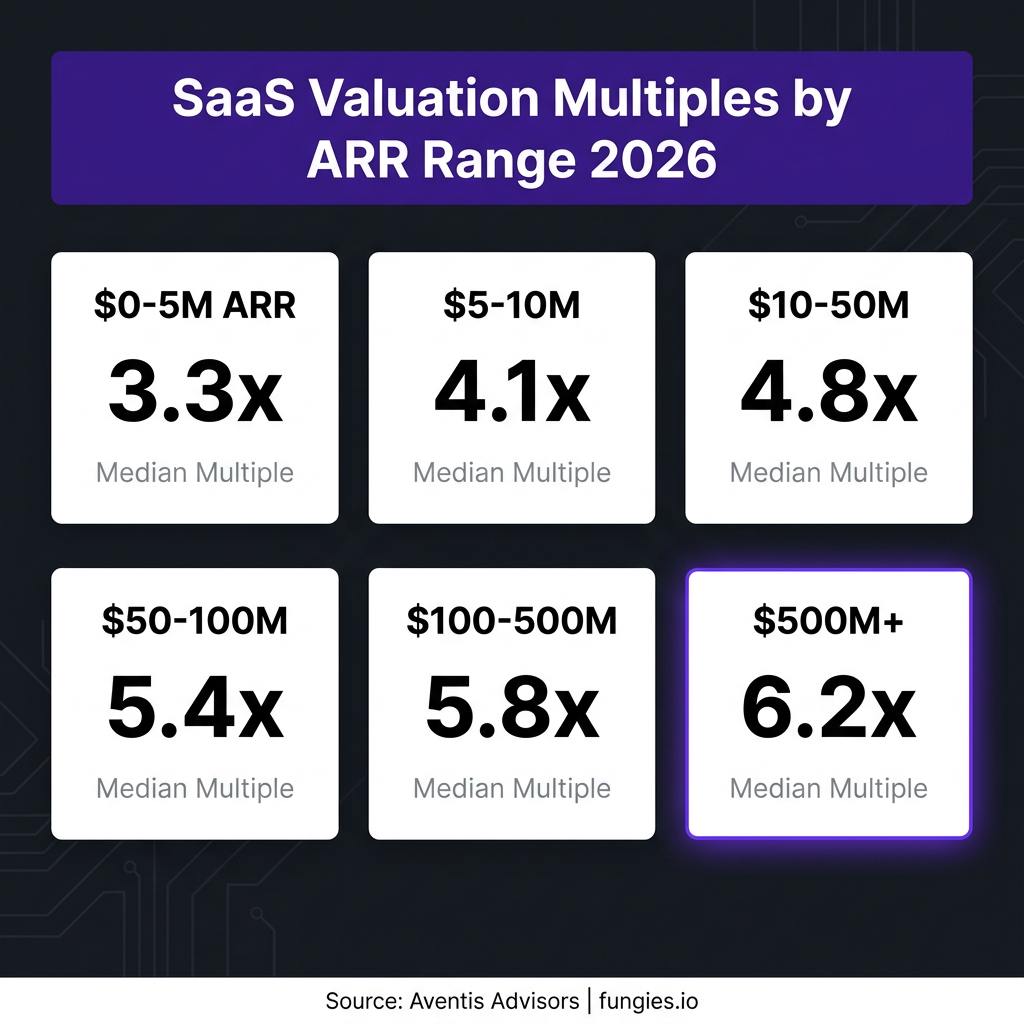
Company size—measured by Annual Recurring Revenue (ARR)—remains the single strongest predictor of valuation multiples in the SaaS industry. Research from Aventis Advisors, analyzing data from 2015 through 2026, reveals a clear positive correlation between ARR scale and valuation multiples.
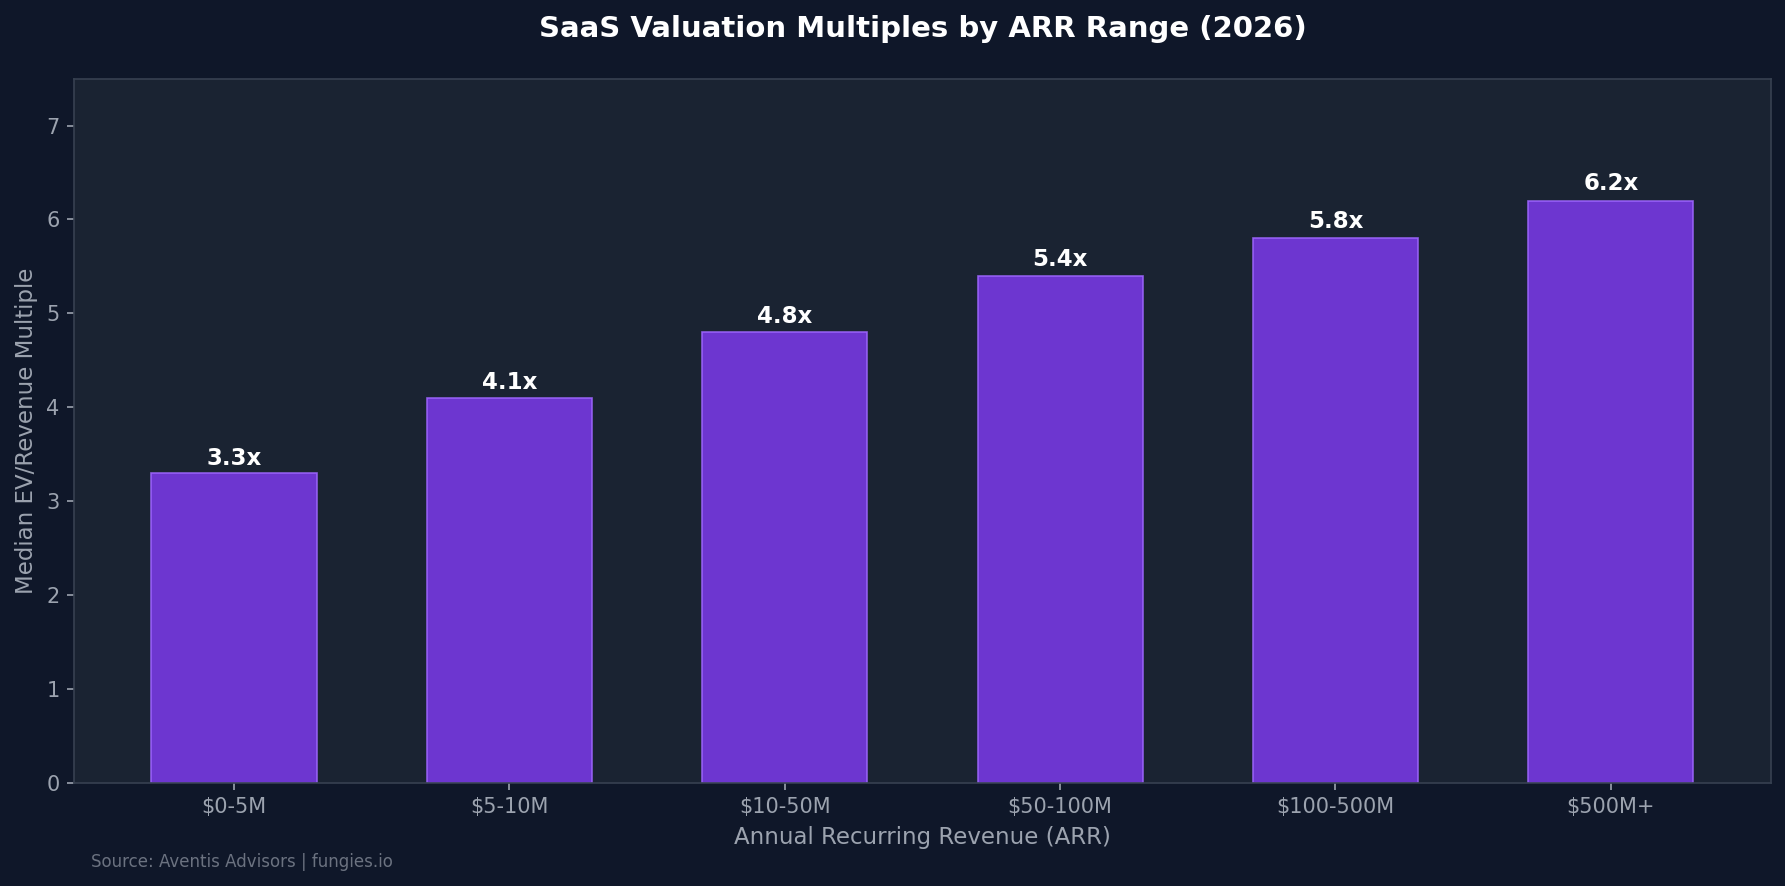
For companies in the $0-5 million ARR range, the median valuation multiple stands at 3.3x. This reflects the higher risk profile, less predictable revenue streams, and typically higher customer concentration that characterizes early-stage SaaS businesses. As companies scale to $5-10 million ARR, multiples expand to 4.1x median, indicating investor confidence in proven product-market fit and more sustainable growth mechanics.
The $10-50 million ARR band—often considered the “growth stage” sweet spot—commands a 4.8x median multiple. Companies in this range have typically established repeatable go-to-market motions, demonstrated meaningful customer retention, and built sufficient organizational infrastructure to support scaling. The $50-100 million ARR segment sees multiples rise to 5.4x, while the $100-500 million range achieves 5.8x.
At the top end, SaaS companies with $500 million or more in ARR command a 6.2x median multiple. These businesses benefit from market leadership positions, strong moats, diversified customer bases, and the operational maturity that reduces execution risk in the eyes of acquirers and public market investors.
| ARR Range | Median Multiple | Typical Profile |
|---|---|---|
| $0-5M | 3.3x | Seed to Series A, product-market fit validation |
| $5-10M | 4.1x | Early growth, initial scale, repeatable sales |
| $10-50M | 4.8x | Growth stage, established GTM, Series B-C |
| $50-100M | 5.4x | Late growth, market expansion, pre-IPO |
| $100-500M | 5.8x | Late stage, market leadership, IPO candidates |
| $500M+ | 6.2x | Public companies, category leaders |
Public vs. Private Market Valuations
A persistent valuation gap exists between public and private SaaS markets. According to the SaaS Capital Index, public SaaS companies traded at a median of 6.0x to 7.0x EV/Revenue entering 2026—significantly higher than the 4.5x median for private companies. This premium reflects the liquidity discount, regulatory transparency, and institutional scrutiny that public companies command.
However, this gap has narrowed considerably from the 2021 peak when public SaaS multiples exceeded 15x. The correction that began in 2022 has fundamentally reset expectations, with both public and private markets converging toward more sustainable valuation frameworks.
For bootstrapped SaaS companies in the $3-10 million ARR range, realistic exit multiples range from 3x to 5x ARR according to Livmo research. VC-backed companies with faster growth rates command a modest premium—SaaS Capital reports a median of 5.3x for equity-backed companies versus 4.8x for bootstrapped businesses. This 10% premium reflects investor expectations around growth trajectory and the governance structures that venture backing provides.
| Company Type | Median Multiple | Range | Source |
|---|---|---|---|
| Public SaaS (SaaS Capital Index) | 6.7x | 6.0x – 7.0x | SaaS Capital |
| Private SaaS (Lower Middle Market) | 4.5x | 3.0x – 7.0x | Aventis Advisors |
| Bootstrapped ($3-10M ARR) | 4.0x | 3.0x – 5.0x | Livmo |
| VC-Backed ($3-10M ARR) | 5.3x | 4.0x – 7.0x | SaaS Capital |
| AI-Native SaaS | 12.5x | 8.0x – 20.0x | LinkedIn/Pawel Maj |
Regional Breakdown
Geography significantly impacts SaaS valuations, with North American companies consistently commanding premiums over their international counterparts. According to research from Scale With CFO, UK SaaS companies typically trade at a 15-25% discount to comparable US rounds—meaning a US company valued at 5x ARR might see only 3.75x to 4.25x in the UK market.
This discount reflects several factors: smaller domestic market size, lower availability of growth capital, less mature exit ecosystems, and currency considerations. However, UK SaaS companies benefit from SEIS/EIS tax incentives that can partially offset valuation discounts for certain investor classes.
North America’s dominance—capturing over 45% of global SaaS revenue—creates network effects that sustain higher valuations. The concentration of strategic acquirers, private equity firms, and IPO infrastructure in the US provides more exit optionality, which translates to valuation premiums.
| Region | Market Share | 2025 Revenue | Valuation Premium/Discount |
|---|---|---|---|
| North America | 45%+ | $147.8B | Baseline |
| Europe (UK) | ~20% | ~$65B | -15% to -25% |
| Asia-Pacific | ~18% | ~$58B | -10% to -20% |
| Rest of World | ~17% | ~$55B | -20% to -30% |
Key Players & Market Share
The SaaS market remains highly concentrated at the top, with Microsoft, Salesforce, and Adobe forming a dominant trio. According to CIO Dive, Microsoft extends its market leadership position, trailed by Salesforce in second place and Adobe in third. Oracle and SAP round out the top five, with Google Cloud and Google Workspace also commanding significant market presence.
Salesforce, often regarded as a pioneer of the SaaS model since its 1999 founding, maintains approximately 23.8% of the total CRM market share with over 150,000 subscribers. The company’s cloud-based CRM platform remains the category standard against which competitors are measured.
Approximately 30,000 SaaS companies operate worldwide, with around 17,000 based in the United States. This density of SaaS providers creates intense competition but also drives innovation and category expansion. The fastest-growing SaaS providers in recent periods have been Oracle, Microsoft, and Google—indicating that established technology giants continue to capture disproportionate growth in the enterprise software transition.
| Company | Market Position | Key SaaS Products |
|---|---|---|
| Microsoft | #1 | Microsoft 365, Azure, Dynamics 365 |
| Salesforce | #2 (CRM leader) | Sales Cloud, Service Cloud, Marketing Cloud |
| Adobe | #3 | Creative Cloud, Document Cloud, Experience Cloud |
| Oracle | #4 | Oracle Cloud, NetSuite, Fusion Applications |
| SAP | #5 | S/4HANA Cloud, SuccessFactors, Ariba |
| Top 6 | Google Workspace, Google Cloud Platform |
Industry Benchmarks & KPIs
Beyond top-line revenue multiples, sophisticated SaaS valuation increasingly relies on operational metrics that predict sustainable growth. The Rule of 40—combining revenue growth rate and profit margin—has emerged as the dominant framework for assessing SaaS company health.
According to McKinsey research, investors consistently reward SaaS companies at or above the Rule of 40 with higher valuations. Companies scoring above 50 on the Rule of 40 while maintaining net revenue retention (NRR) above 120% are closing at 7x to 9x ARR in private transactions—significantly above the 4.5x median.
The LTV:CAC ratio (Lifetime Value to Customer Acquisition Cost) remains a critical benchmark. A healthy range is 3:1 to 5:1, with top companies exceeding 4:1. B2B SaaS companies show a median CAC payback period of 8.6 months with LTV:CAC of 3.8x, while prosumer and SMB tools achieve faster 6.2-month payback periods with 4.0x ratios.
Gross margins for healthy SaaS businesses typically range from 70-85%, reflecting the inherent scalability of software delivery. Monthly churn above 7% is considered concerning, while below 3% is excellent. Net revenue retention above 100% indicates that existing customers are expanding their spend faster than churned revenue—an essential characteristic of top-quartile SaaS businesses.
| Metric | Median/Target | Top Quartile | Concerning |
|---|---|---|---|
| Rule of 40 Score | 40% | 50%+ | Below 20% |
| LTV:CAC Ratio | 3.0x – 3.8x | 4.0x+ | Below 3.0x |
| CAC Payback Period | 8.6 months | Under 12 months | Over 18 months |
| Net Revenue Retention | 100%+ | 120%+ | Below 100% |
| Gross Margin | 70-85% | 80%+ | Below 70% |
| Monthly Churn | 3-5% | Below 3% | Above 7% |
| Annual Growth Rate | 17% | 30%+ | Below 10% |
M&A Activity & Exit Trends
2025 marked a record year for SaaS M&A activity. According to the Software Equity Group’s 2026 Annual SaaS Report, 2,698 SaaS M&A transactions closed in 2025—a 28% increase from 2024 and the highest annual count ever recorded. SaaS M&A accounted for approximately 58% of total software M&A activity, with software deals representing 65% of total technology deal volume.
AI is rewriting deal theses. Approximately 72% of SaaS M&A targets in 2025 referenced AI capabilities in their positioning, reflecting how quickly artificial intelligence has become embedded across the SaaS landscape. Analytics & Data Management and Content & Workflow Management were the two most active SaaS M&A product categories, together accounting for nearly 38% of total deal volume.
The median private SaaS company in the lower middle market now trades at approximately 4.5x ARR, though companies with growth above 30%, NRR above 110%, and Rule of 40 scores above 50 can command 6x to 8x ARR. This bifurcation—between “superstar” metrics and average performance—is widening as buyers become more selective.
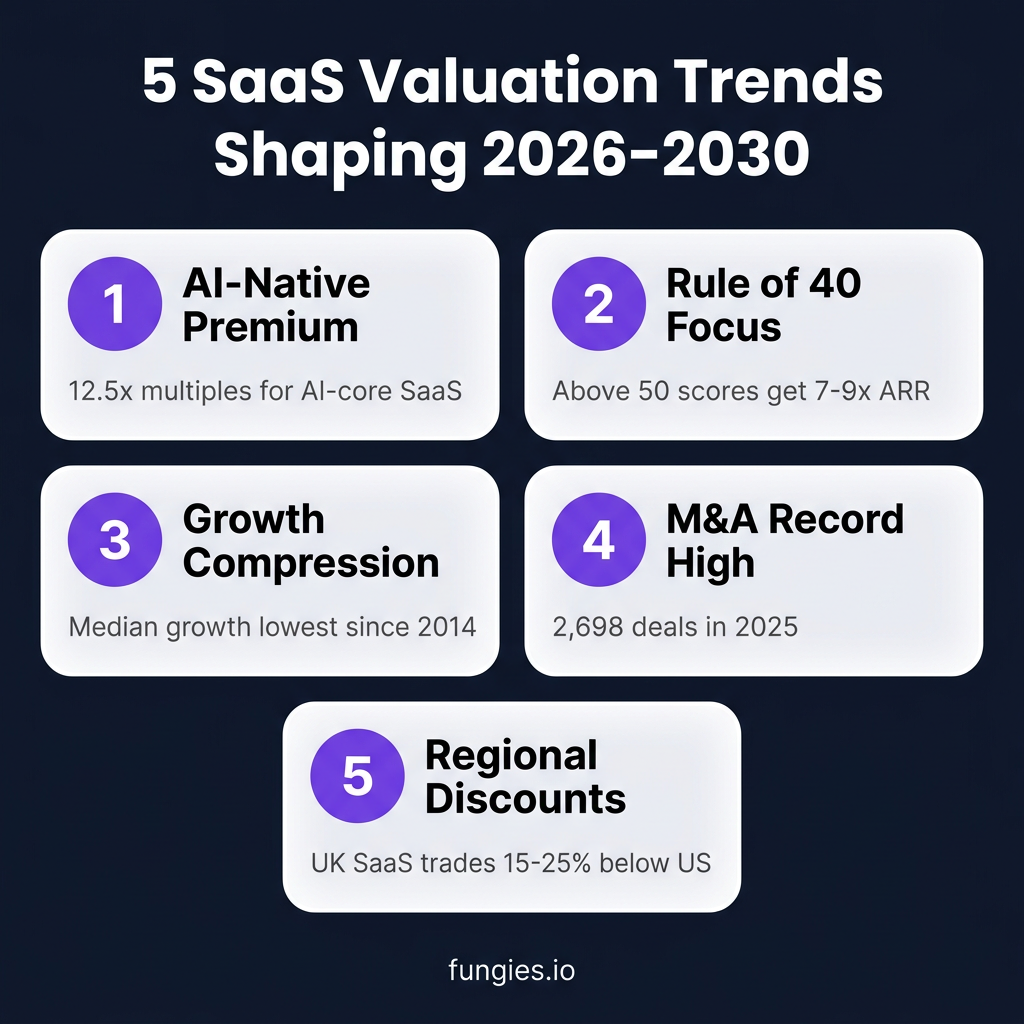
Trends & Predictions (2026-2030)
1. The AI-Native Valuation Premium
AI-native SaaS companies command 1-3x higher multiples than traditional SaaS businesses. According to research from Pawel Maj, AI-native SaaS companies achieved median EV/Revenue multiples of 12.5x in January 2026—nearly double the 6.7x median for the broader public SaaS market. According to Livmo, 87% of buyers expect this gap to widen, making AI integration not just a growth strategy but a valuation imperative.
2. Rule of 40 as the Primary Valuation Driver
The Rule of 40 has evolved from a VC talking point to the dominant valuation framework. Companies scoring above 50 on the Rule of 40 while maintaining NRR above 120% are achieving 7x to 9x ARR multiples—premium valuations in an otherwise compressed market. As Aventis Advisors notes, investors now reward operational efficiency and meaningful AI integration rather than speculative “AI wrappers.”
3. Growth Compression Continues
The median year-over-year revenue growth rate for SaaS companies is now 17%—the lowest since 2014 and far from the +30% YoY growth that fueled higher multiples in previous years. According to SaaS Capital, we’re in year three of mediocre SaaS growth coming out of COVID, with 80% of SaaS companies growing below 20%. This compression affects valuation expectations across the board.
4. Consolidation Acceleration
The SaaS industry is consolidating around record private equity dry powder, enterprise demand for fewer vendors, AI-driven deal theses, and a widening gap between premium and commodity software. The 2,698 deals in 2025 represent just the beginning—analysts expect M&A volume to remain elevated as companies seek scale and AI capabilities through acquisition rather than organic development.
5. Regional Valuation Arbitrage
The 15-25% UK discount and similar discounts in other non-US markets create arbitrage opportunities for strategic buyers. As remote work normalizes and talent markets globalize, we expect increased cross-border M&A activity as US buyers acquire international SaaS assets at valuation discounts while gaining geographic diversification.
Methodology
This report synthesizes data from multiple authoritative sources to provide a comprehensive view of SaaS valuations in 2026. Our primary data sources include:
- Aventis Advisors — SaaS Valuation Multiples 2015-2026 report, analyzing 100+ public companies and private M&A transactions
- Software Equity Group (SEG) — 2026 Annual SaaS Report covering 2,700+ M&A transactions and the SEG SaaS Index
- SaaS Capital — SaaS Capital Index and private company benchmarking surveys
- Fortune Business Insights — Global SaaS market sizing and forecasting
- Mordor Intelligence — B2B SaaS and CRM market analysis
- Grand View Research — Regional market breakdowns and growth projections
Valuation multiples cited represent median figures unless otherwise specified. Public market data reflects trading multiples as of Q1 2026. Private market data represents M&A transaction multiples reported in 2025-2026. Market size figures are based on analyst consensus estimates and may vary between sources due to definitional differences in SaaS categorization.
All currency figures are in USD unless otherwise noted. CAGR calculations are based on reported analyst forecasts. Regional market share percentages are approximate based on available data.
Frequently Asked Questions
What is a typical SaaS valuation multiple in 2026?
The median private SaaS company trades at approximately 4.5x ARR in 2026. However, this varies significantly by company size: early-stage companies ($0-5M ARR) typically see 3.0-3.5x, while mature companies ($500M+ ARR) command 6.0x+. Public SaaS companies trade at a median of 6.0-7.0x EV/Revenue according to the SaaS Capital Index.
How does the Rule of 40 affect SaaS valuations?
The Rule of 40 (revenue growth rate + profit margin) is now a primary valuation driver. Companies scoring above 50 on the Rule of 40 with net revenue retention above 120% are achieving 7x to 9x ARR multiples—significantly above the 4.5x median. Investors view Rule of 40 performance as evidence of sustainable, efficient growth.
Are AI-native SaaS companies valued differently?
Yes. AI-native SaaS companies command median multiples of 12.5x EV/Revenue—nearly double the broader market median of 6.7x. This premium reflects investor expectations that AI capabilities will drive faster growth, higher retention, and stronger competitive moats. However, investors are distinguishing between “AI wrappers” and companies with meaningful AI integration.
What LTV:CAC ratio should SaaS companies target?
A healthy LTV:CAC ratio ranges from 3:1 to 5:1, with top companies exceeding 4:1. Below 3:1 indicates unsustainable unit economics, while above 5:1 may suggest underinvestment in growth. The median B2B SaaS company achieves 3.8x LTV:CAC with an 8.6-month CAC payback period.
How do UK and European SaaS valuations compare to the US?
UK SaaS companies typically trade at a 15-25% discount to comparable US companies. This reflects smaller domestic markets, less mature exit ecosystems, and currency considerations. However, SEIS/EIS tax incentives in the UK can partially offset these discounts for certain investors. Similar discounts apply across European markets compared to US valuations.
Sources & Citations
- Aventis Advisors — SaaS Valuation Multiples 2015-2026: https://aventis-advisors.com/saas-valuation-multiples
- Software Equity Group — 2026 Annual SaaS Report: https://softwareequity.com/research/annual-saas-report
- SaaS Capital — Four Early 2026 SaaS Trends: https://www.saas-capital.com/blog-posts/four-early-2026-saas-trends
- SaaS Capital — 2025 B2B Benchmarking Private SaaS Company Growth Rates: PDF Report
- Fortune Business Insights — SaaS Market Size Global Report: https://www.fortunebusinessinsights.com/software-as-a-service-saas-market-102222
- Mordor Intelligence — B2B SaaS Market Report: https://www.mordorintelligence.com/industry-reports/b2b-saas-market
- Mordor Intelligence — Software As A Service Market Report: https://www.mordorintelligence.com/industry-reports/software-as-a-service-market
- Livmo — SaaS Valuation Multiples 2026: https://livmo.com/blog/saas-valuation-multiples-2026
- LinkedIn/Pawel Maj — SaaS Revenue Multiples January 2026: LinkedIn Post
- SaaS Mag — SaaS Consolidation Wave 2026: https://www.saasmag.com/saas-consolidation-ma-wave-2026
- Scale With CFO — UK SaaS Valuation Multiples 2026: https://www.scalewithcfo.com/post/saas-valuation-multiples-2026
- Phoenix Strategy Group — Benchmarking SaaS KPIs 2026: https://www.phoenixstrategy.group/blog/benchmarking-saas-kpis-industry-standards-2026
- Eagle Rock CFO — SaaS Finance Metrics Benchmarks: https://www.eaglerockcfo.com/blog/research/saas-finance-metrics-benchmarks
- SaaS Hero — LTV to CAC Ratio Benchmarks 2026: https://www.saashero.net/strategy/b2b-saas-ltv-cac-benchmarks
- McKinsey — SaaS and the Rule of 40: https://www.mckinsey.com/industries/technology-media-and-telecommunications/our-insights/saas-and-the-rule-of-40-keys-to-the-critical-value-creation-metric
- Exploding Topics — Top 50 SaaS Companies 2025: https://explodingtopics.com/blog/top-saas-companies
- CIO Dive — Microsoft Extends SaaS Market Lead: https://www.ciodive