Payment Processing Statistics 2026: Market Size, Data & Trends (Comprehensive Report)
The global payment processing industry is experiencing unprecedented growth, with transaction volumes reaching staggering levels and new technologies reshaping how businesses and consumers exchange value. In 2023 alone, the industry processed 3.4 trillion transactions worth approximately $1.8 quadrillion in value, generating a revenue pool of $2.4 trillion according to McKinsey & Company.
This comprehensive report brings together the latest data from leading research firms, financial institutions, and industry analysts to provide you with authoritative statistics on market size, regional breakdowns, key players, emerging trends, and benchmarks that matter. Whether you’re a SaaS founder evaluating payment infrastructure, an investor analyzing market opportunities, or a business leader optimizing your payment stack, this data will inform your strategic decisions.
Key Statistics at a Glance
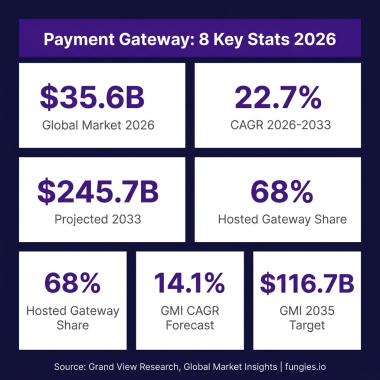
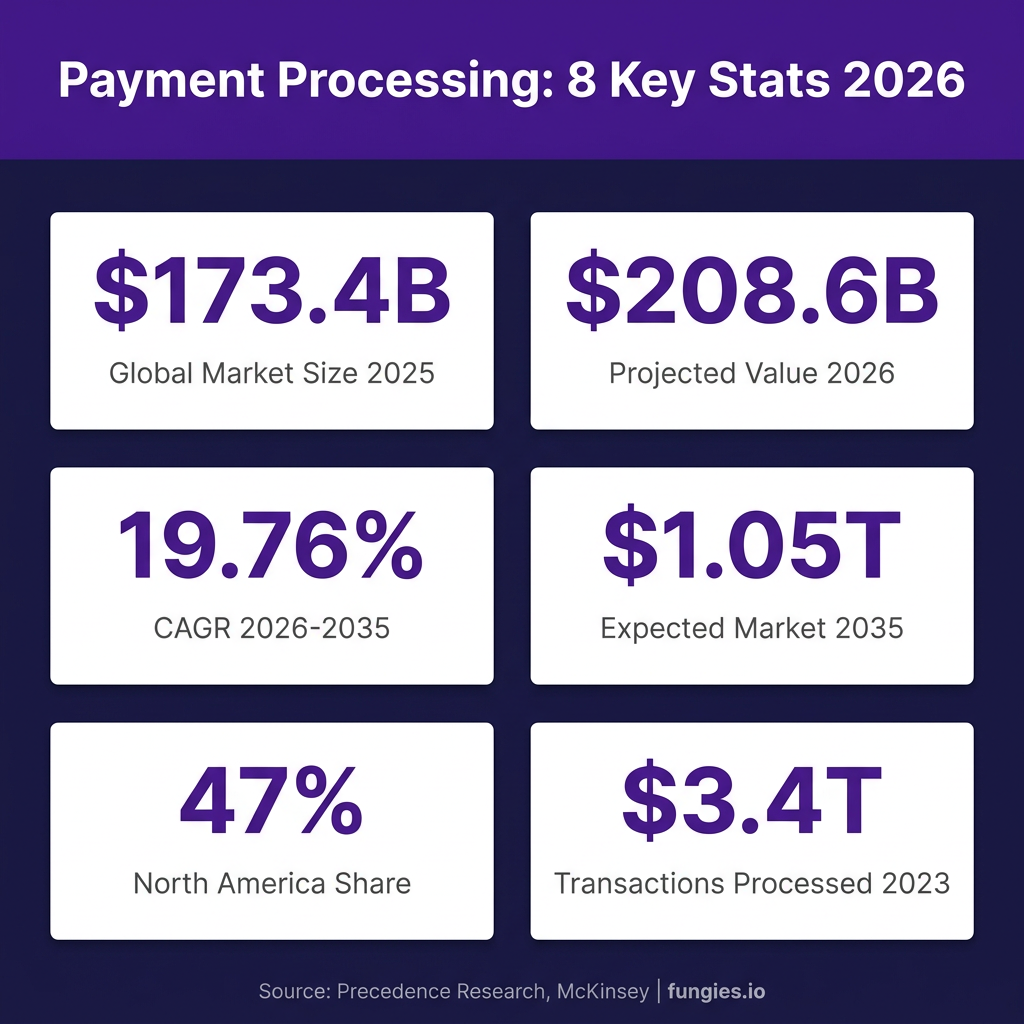
- $173.38 billion — Global payment processing solutions market size in 2025 (Precedence Research)
- $208.57 billion — Projected market value for 2026
- 19.76% CAGR — Expected growth rate from 2026 to 2035
- $1.05 trillion — Forecasted market size by 2035
- 47% — North America’s share of the global market
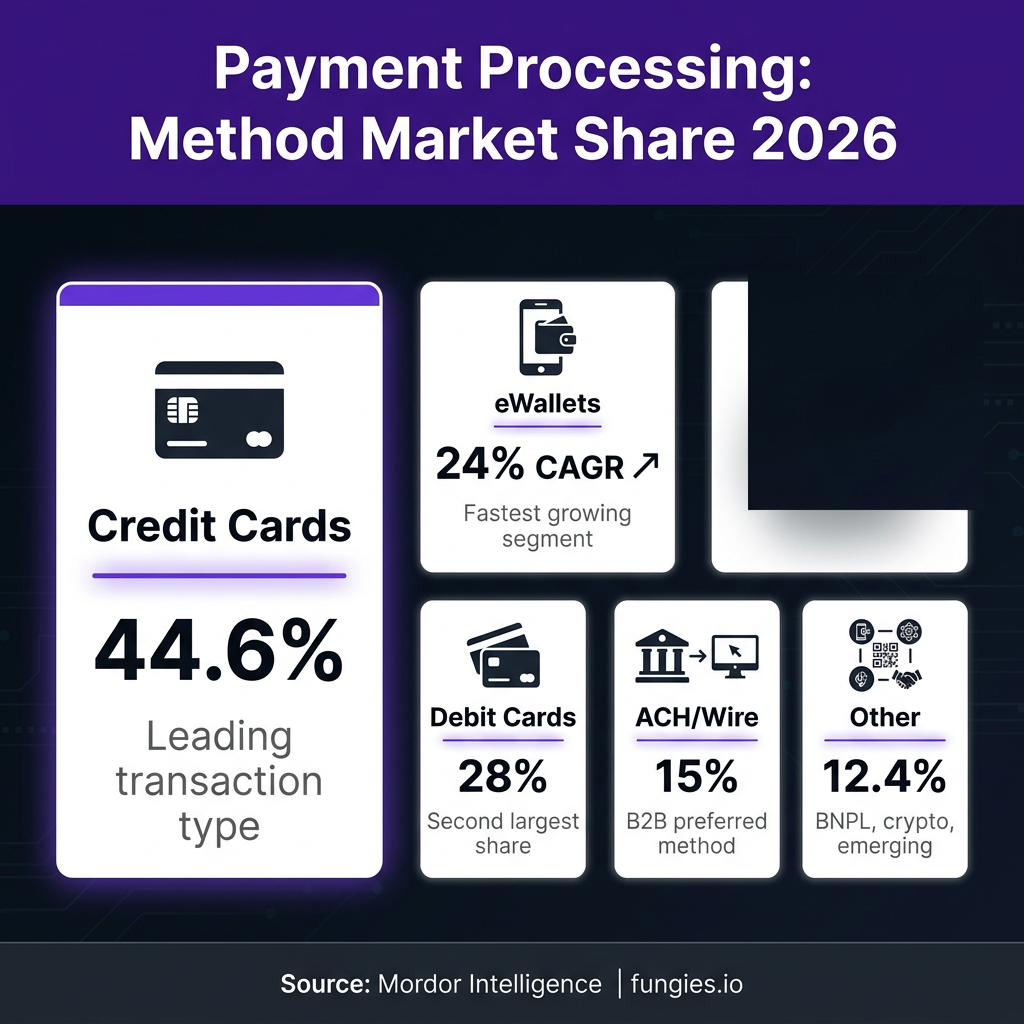
- 44.6% — Credit cards’ share of transaction types
- $18.7 trillion — Global digital payment volume in 2024
- 66% — Share of e-commerce transactions using digital payments
- $25 trillion — Projected e-wallet transaction volume by 2027
- 79% — Percentage of U.S. businesses hit by payments fraud in 2024
Market Size & Growth
The payment processing solutions market has demonstrated remarkable expansion, with multiple research firms tracking its trajectory. According to Precedence Research, the global market was valued at $173.38 billion in 2025 and is projected to reach $208.57 billion by 2026. This represents a significant acceleration from previous years, driven by the continued digitization of commerce and the proliferation of payment methods.
Looking further ahead, the market is anticipated to reach approximately $1.05 trillion by 2035, expanding at a compound annual growth rate (CAGR) of 19.76% from 2026 to 2035. This growth trajectory positions payment processing as one of the fastest-expanding segments within the broader financial technology ecosystem.
Mordor Intelligence provides a more conservative but still robust estimate, projecting the payment processor market to grow from $71.15 billion in 2026 to $122.08 billion by 2031, representing an 11.4% CAGR. The variation in projections reflects different market definitions and segmentation approaches across research firms.
The broader digital payments landscape tells an even more compelling story. Worldpay’s Global Payments Report indicates that digital payment volumes reached $18.7 trillion in 2024, up from just $1.7 trillion in 2014. By 2030, this figure is projected to more than double to $33.5 trillion as more economies digitize and consumers embrace contactless, wallets, and online checkouts.
| Year | Market Size (USD Billion) | Growth Rate | Source |
|---|---|---|---|
| 2023 | $61.1B | Baseline | Airwallex |
| 2024 | $66.8B – $79.6B | 9-12% | GM Insights / Globenewswire |
| 2025 | $173.38B | — | Precedence Research |
| 2026 | $208.57B | 20.3% | Precedence Research |
| 2030 | $453.74B – $1,051.93B | Projected | CoherentMI / Precedence |
| 2031 | $122.08B – $221.16B | 11.4-17.95% CAGR | Mordor Intelligence |
| 2035 | $1,051.93B | 19.76% CAGR | Precedence Research |
Regional Breakdown
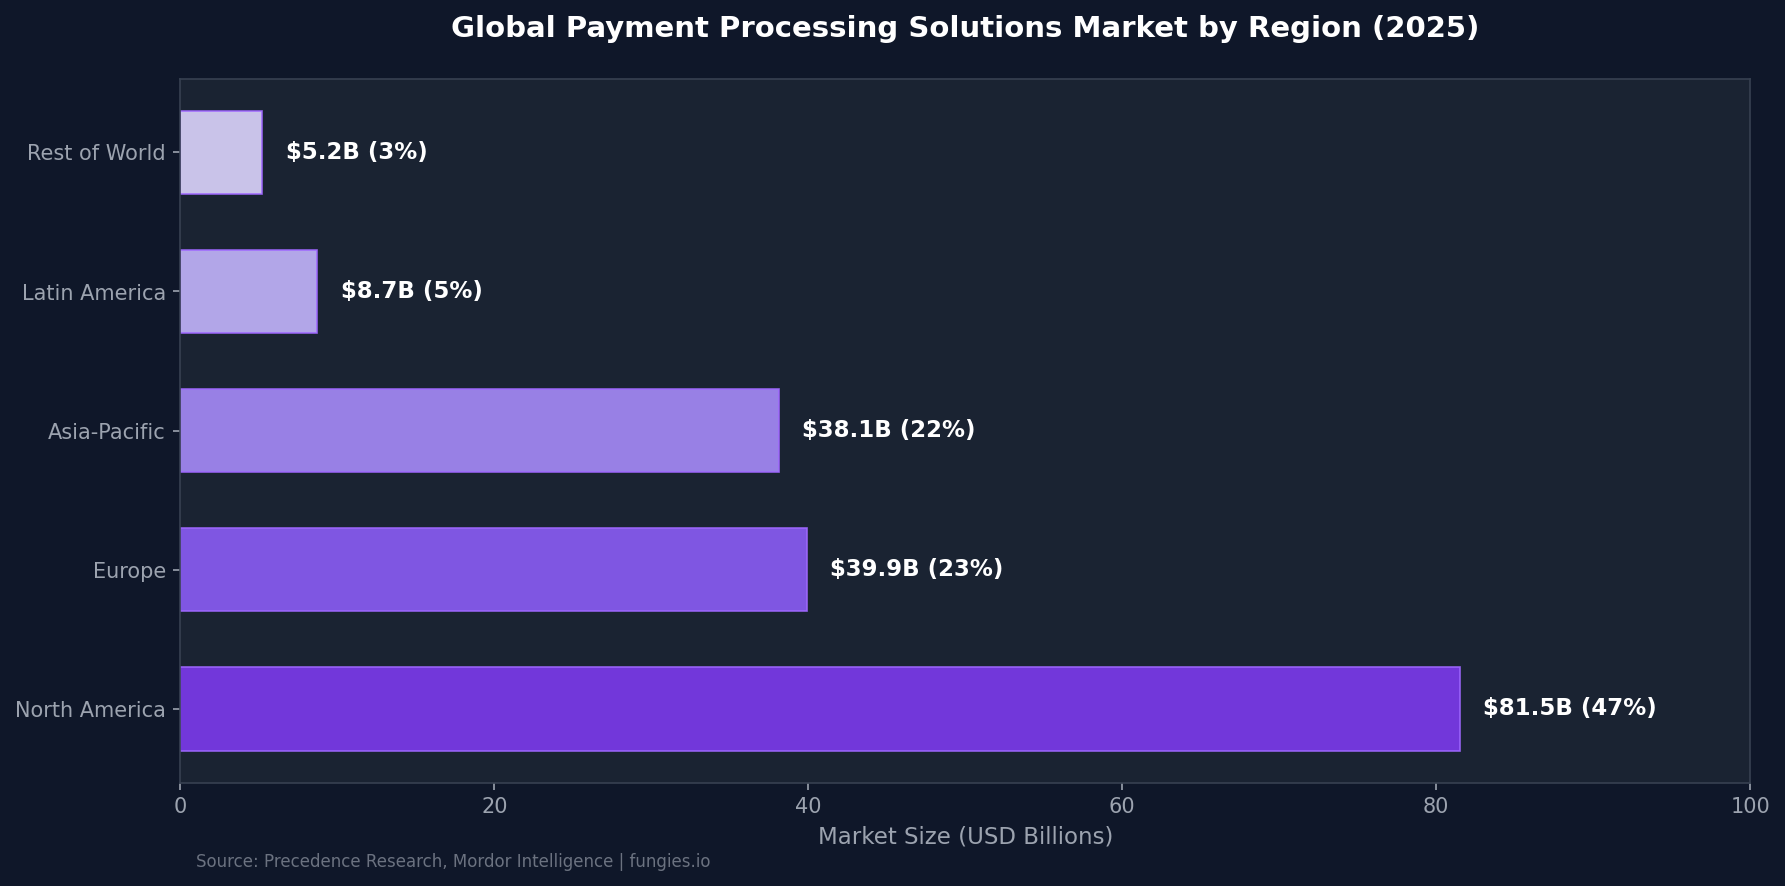
North America dominates the global payment processing landscape, commanding approximately 47% of the total market share in 2025 according to Precedence Research. This translates to roughly $81.5 billion in market value, driven by high credit card penetration, mature e-commerce infrastructure, and the presence of major payment technology companies.
Europe represents the second-largest region, accounting for approximately 23% of global market share ($39.9 billion). The region benefits from strong open banking regulations, widespread adoption of contactless payments, and the growth of real-time payment schemes like SEPA Instant.
Asia-Pacific holds approximately 22% market share ($38.1 billion) but delivers the fastest growth trajectory. Mordor Intelligence projects the region to expand at a 14.25-14.48% CAGR through 2031, driven by super-app ecosystems, QR-code payment systems, and rapid smartphone adoption. According to Merchant Savvy, Asia-Pacific generates 47% of global payments revenues ($1 trillion) and achieved a 25% annual growth rate when excluding China’s recent decline.
Latin America and the Rest of World collectively account for the remaining 8% of market share. However, Latin America shows particular promise for B2B payment digitalization among SMBs, with Brazil and Mexico leading adoption.
| Region | Market Share (2025) | Market Value | Projected CAGR |
|---|---|---|---|
| North America | 47% | $81.5B | 9-11% |
| Europe | 23% | $39.9B | 10-12% |
| Asia-Pacific | 22% | $38.1B | 14.25-14.48% |
| Latin America | 5% | $8.7B | 12-15% |
| Rest of World | 3% | $5.2B | 10-13% |
Key Players & Market Share
The payment processing industry features a mix of established incumbents and agile fintech challengers. According to October 2025 data from Statista, PayPal and Stripe dominate web payments with a combined 65% market share. PayPal leads with 45.39% of the online payment processing market, while Stripe holds 17.33%.
Stripe’s valuation hit a record $159 billion in 2026, making it the third most valuable private company in the world. The company’s total payment volume (TPV) reached approximately $1.05 trillion in 2025, demonstrating its rapid growth and market penetration.
Forrester’s latest evaluation of merchant payment providers identified Stripe, Adyen, and Fiserv as market leaders, with each vendor offering competitive solutions with specific strengths. Adyen has particularly benefited from the embedded finance trend, with SaaS vendors now earning more than half of their revenue from embedded payments.
Traditional players maintain significant positions. Visa and Mastercard continue to dominate card networks, while Shopify Payments, Amazon Pay, Afterpay, and Klarna hold smaller but strategically important shares in specific niches like BNPL (Buy Now, Pay Later).
| Company | Market Position | Key Metric | Source |
|---|---|---|---|
| PayPal | Market Leader | 45.39% online market share | Statista Oct 2025 |
| Stripe | #2 Online | 17.33% market share, $159B valuation | Statista/Chargeflow |
| Adyen | Leader (Forrester) | Embedded finance pioneer | Forrester |
| Fiserv | Leader (Forrester) | Enterprise solutions | Forrester |
| Shopify Payments | Niche Leader | Dominant in e-commerce | Statista |
| Klarna/Afterpay | BNPL Leaders | High-intent niche dominance | LinkedIn/Statista |
Payment Method Breakdown
Credit cards remain the dominant transaction type in payment processing, accounting for 44.55% of revenue share in 2025 according to Mordor Intelligence. This reflects the continued preference for credit-based purchasing in North America and Europe, as well as the higher transaction values typically associated with credit card payments.
Debit cards represent the second-largest segment at approximately 28% of transaction volume. The widespread issuance of contactless debit cards—229.87 million shipped to the United States in 2021 alone—has accelerated adoption for everyday purchases.
E-wallets represent the fastest-growing segment, expanding at a 14.82-24% CAGR depending on the forecast. Worldpay projects e-wallets to power 61% of all e-commerce and 46% of point-of-sale transactions by 2027. The global wallet transaction volume is on track to reach $25 trillion by 2027.
Account-to-account (A2A) payments and Automated Clearing House (ACH) transfers account for approximately 15% of the market, with particular strength in B2B transactions. Real-time A2A schemes are expanding rapidly, with Project Nexus connecting India, Malaysia, Philippines, Singapore, and Thailand to enable instant transfers for 1.7 billion inhabitants.
| Payment Method | Market Share | Growth Rate | Key Insight |
|---|---|---|---|
| Credit Cards | 44.6% | 6-8% | Highest transaction values |
| Debit Cards | 28% | 7-9% | Contactless driving growth |
| eWallets | 15-18% | 14.8-24% CAGR | Fastest growing segment |
| ACH/Wire/A2A | 10-15% | 11-13% | B2B preferred |
| BNPL & Other | 5-8% | 15-20% | Emerging methods |
Industry Benchmarks & KPIs
Payment processing performance varies significantly across industries and use cases. According to Stripe’s research, the average payment conversion rate—the percentage of shoppers who become buyers—ranges from 1.5% to 3.5% for e-commerce, though top performers achieve significantly higher rates.
Payment acceptance rates, which measure successful transactions versus attempted transactions, typically range from 85% to 95% depending on the market and payment method. Cross-border transactions generally see lower acceptance rates due to additional fraud checks and currency conversion requirements.
Processing fees remain a critical concern for merchants. Standard credit card processing fees typically range from 1.5% to 2.9% plus a fixed fee (e.g., $0.10 per transaction) according to Corefy. Flat-rate pricing models, popularized by providers like Stripe and Square, typically charge around 2.9% + $0.30 per transaction for Visa/Mastercard.
Fraud and chargeback rates serve as critical risk metrics. The 2024 AFP Payments Fraud and Control Survey found that 79% of U.S. businesses experienced payments fraud attempts. Chargeback ratios above 1% can result in penalties from card networks, making fraud prevention a top priority.
| KPI | Industry Average | Top Performers | Notes |
|---|---|---|---|
| Payment Conversion Rate | 1.5-3.5% | 5-8% | E-commerce average |
| Payment Acceptance Rate | 85-92% | 95%+ | Varies by market |
| Processing Fees | 1.5-2.9% + $0.10 | Negotiable | Volume-dependent |
| Fraud Rate | 0.5-1.2% | <0.3% | Revenue at risk |
| Chargeback Ratio | 0.5-0.8% | <0.5% | Network threshold 1% |
| Settlement Time | 1-3 days | Instant | Real-time growing |
Trends & Predictions
Several transformative trends are reshaping the payment processing landscape through 2030:
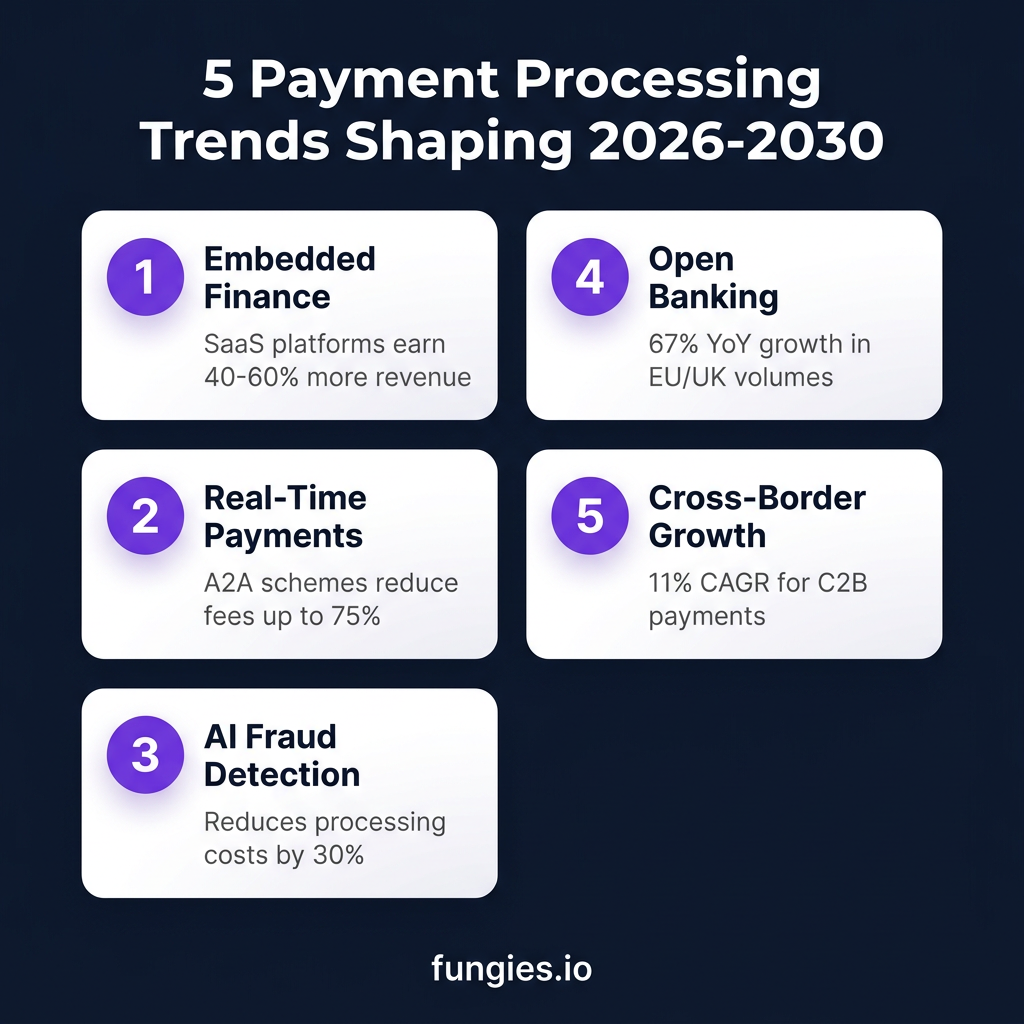
1. Embedded Finance Revolution
SaaS platforms are increasingly integrating payment processing directly into their offerings. According to Mordor Intelligence, SaaS vendors now earn more than 50% of their revenue from embedded payments, underpinning a $185 billion embedded finance ecosystem. This trend enables processors to capture higher-value transactions and earn 40-60% more revenue per merchant versus standalone services.
2. Real-Time Payment Expansion
Account-to-account (A2A) real-time payment schemes are expanding globally. According to the Bank for International Settlements, accelerated implementation across Asia and the Nordics lowers settlement times from days to seconds and reduces cross-border fees by up to 75%. Instant payments accounted for 13% of global non-cash transactions in 2022 and are projected to exceed 22% by 2028.
3. AI-Powered Fraud Prevention
Machine learning and artificial intelligence are transforming fraud detection capabilities. Airwallex reports that AI applications in automation and fraud detection can potentially reduce processing costs by 30%. With 79% of U.S. businesses experiencing payments fraud in 2024, investment in AI-driven security is accelerating.
4. Open Banking Growth
Open banking mandates in the EU and UK are generating significant payment volumes. By March 2025, open banking facilitated 27.2 million payments valued at GBP 12.9 billion (USD 16.2 billion)—a 67% year-over-year rise that validates regulatory catalysts for processor volumes.
5. Cross-Border Commerce
Cross-border consumer-to-business (C2B) payments are projected to grow at an 11% CAGR from 2023 to 2030, outpacing domestic payment growth as global e-commerce expands. According to Airwallex, 93% of global consumers say pricing in their local currency affects their purchase decision, making payment localization vital for merchants.
Methodology
This report compiles data from authoritative sources including McKinsey & Company’s Global Payments Report, Precedence Research, Mordor Intelligence, Worldpay’s Global Payments Report, Statista, and industry publications from leading payment providers. Market size figures represent the payment processing solutions segment, which includes payment gateways, processors, and related infrastructure services.
Figures are current as of May 2026 and represent the most recent available data from each source. CAGR calculations reflect each research firm’s proprietary forecasting methodologies. Regional breakdowns are based on reported market shares and may not sum to 100% due to rounding and varying geographic definitions across sources.
Frequently Asked Questions
What is the current size of the payment processing market?
The global payment processing solutions market was valued at $173.38 billion in 2025 and is projected to reach $208.57 billion by 2026, according to Precedence Research.
Which region has the largest payment processing market?
North America dominates with approximately 47% of global market share, driven by high credit card penetration and the presence of major payment technology companies.
What is the fastest-growing payment method?
E-wallets are the fastest-growing segment, expanding at a 14.82-24% CAGR and projected to power 61% of e-commerce transactions by 2027.
Who are the leading payment processing companies?
PayPal leads online payment processing with 45.39% market share, followed by Stripe at 17.33%. Forrester identifies Stripe, Adyen, and Fiserv as overall market leaders.
What are typical payment processing fees?
Standard processing fees range from 1.5% to 2.9% plus a fixed fee (typically $0.10-$0.30) per transaction. Flat-rate providers like Stripe typically charge 2.9% + $0.30 for card transactions.
Sources & Citations
- Precedence Research — Payment Processing Solutions Market Size (2026-2035)
- Mordor Intelligence — Payment Processor Market Report (2026-2031)
- McKinsey & Company — Global Payments Report 2025
- Worldpay (FIS) — Global Payments Report 2024
- GR4VY — 112 Payment Industry Statistics for 2026
- Airwallex — 32 Global Payment Processing Industry Statistics 2025
- Merchant Savvy — Global Digital Payments Market Statistics 2026
- Coherent Market Insights — Digital Payments Market Analysis
- Future Market Insights — Payment Processing Solutions Market
- Grand View Research — Payment Processing Solutions Market Size
- Global Market Insights — Payment Processing Solutions Market
- Yahoo Finance — Payment Processors Market Analysis 2026-2031
- J.P. Morgan — Payments Outlook: Five Trends Powering Payments in 2026
- Forrester — Merchant Payment Processing: Champion/Challenger Models
- Chargeflow — Stripe Statistics for 2026