Payment Gateway Statistics 2026: Market Size, Data & Trends (Comprehensive Report)
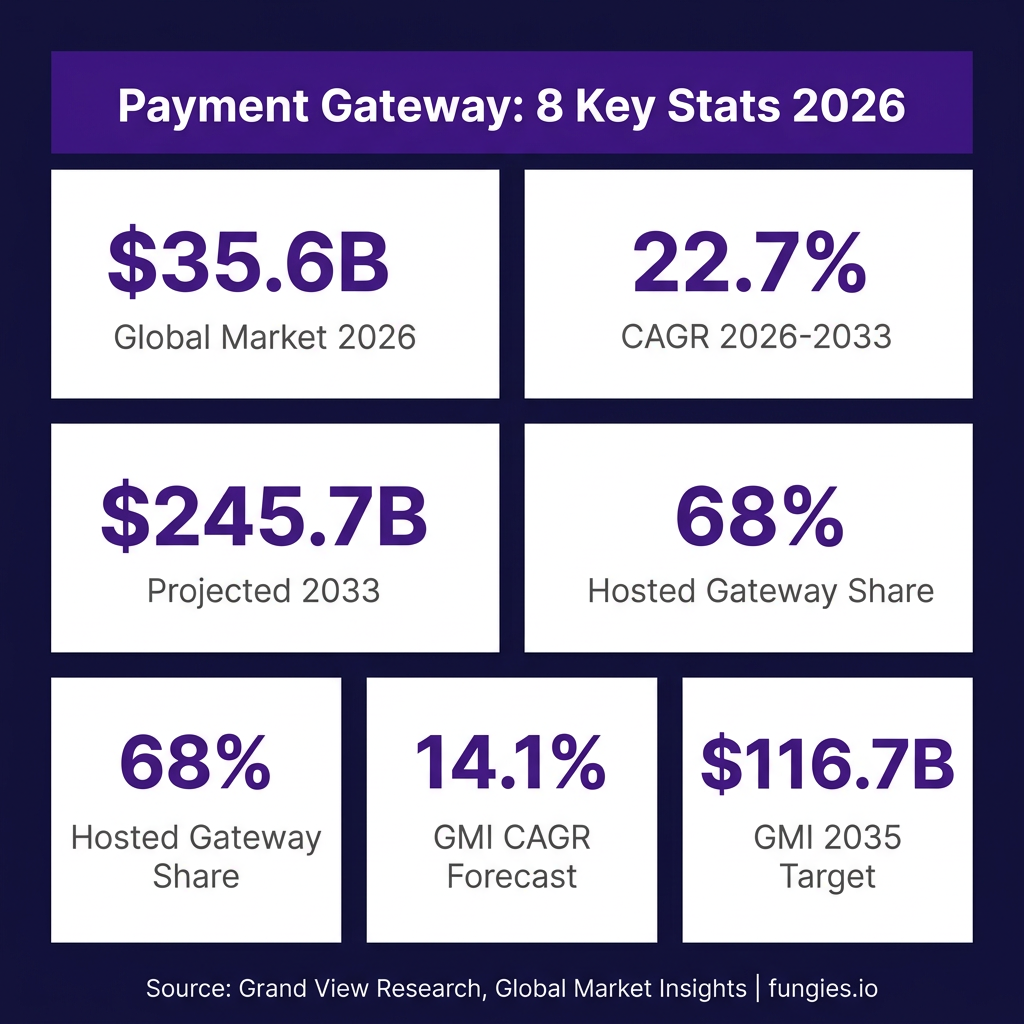
The global payment gateway market is experiencing explosive growth, projected to reach $35.6 billion in 2026—representing a significant year-over-year increase from $32.7 billion in 2025. What’s driving this expansion? The convergence of e-commerce acceleration, mobile payment adoption, and AI-powered fraud prevention technologies is reshaping how businesses process transactions worldwide.
This comprehensive report compiles 40+ verified statistics from Grand View Research, Global Market Insights, Fortune Business Insights, and other authoritative sources to give you the complete picture of where payment gateways stand in 2026 and where they’re heading through 2035.
Key Payment Gateway Statistics at a Glance
- The global payment gateway market was valued at $32.7 billion in 2025 and is projected to reach $35.6 billion in 2026 (Global Market Insights)
- Grand View Research estimates the market at $48.17 billion in 2025, growing to $245.71 billion by 2033 at a 22.7% CAGR
- The U.S. payment gateway market alone reached $9.8 billion in 2025 and is expected to grow at 12.4% CAGR through 2035
- Hosted payment gateways dominate with a 68% market share in the United States
- Asia-Pacific is the fastest-growing region, expected to expand at a 20.85% CAGR through 2031
- Payment success rates above 95% are considered industry benchmarks for optimal performance
- False declines cost merchants approximately $118 billion annually—13x more than actual fraud losses
- AI-powered fraud detection can potentially reduce payment processing costs by 30%
- The high-risk payment processing market will grow from $63.46 billion in 2025 to $214.8 billion by 2033
- Mobile wallets account for the largest share of e-commerce payment methods globally
Global Payment Gateway Market Size & Growth
The payment gateway market is one of the fastest-growing segments in fintech, but market size estimates vary significantly depending on methodology and scope. According to Grand View Research, the global payment gateway market was valued at $48.17 billion in 2025 and is expected to reach $58.77 billion in 2026. The long-term projection is even more impressive: the market is forecast to reach $245.71 billion by 2033, expanding at a compound annual growth rate (CAGR) of 22.7%.
Global Market Insights offers a more conservative estimate, valuing the market at $32.7 billion in 2025 with projections to reach $116.7 billion by 2035 at a 14.1% CAGR. Fortune Business Insights estimates the market at $30.58 billion in 2025, projecting growth to $90.28 billion by 2034 at a 12.78% CAGR.
Mordor Intelligence reports the market at $18.32 billion in 2025, with expectations to grow to $41.11 billion by 2031 at a 14.42% CAGR. Meanwhile, SNS Insider values the market at $45.2 billion in 2025, projecting an ambitious $310.0 billion by 2035 at a 21.2% CAGR.
| Source | 2025 Market Size | 2033/2035 Projection | CAGR |
|---|---|---|---|
| Grand View Research | $48.17 billion | $245.71 billion (2033) | 22.7% |
| Global Market Insights | $32.7 billion | $116.7 billion (2035) | 14.1% |
| Fortune Business Insights | $30.58 billion | $90.28 billion (2034) | 12.78% |
| Mordor Intelligence | $18.32 billion | $41.11 billion (2031) | 14.42% |
| SNS Insider | $45.2 billion | $310.0 billion (2035) | 21.2% |
| Research and Markets | $44.55 billion | $53 billion (2026) | 19% |
The variation in estimates reflects different market definitions—some reports include only pure payment gateway services, while others encompass broader payment processing infrastructure. What remains consistent across all sources is the trajectory: double-digit growth for the foreseeable future.
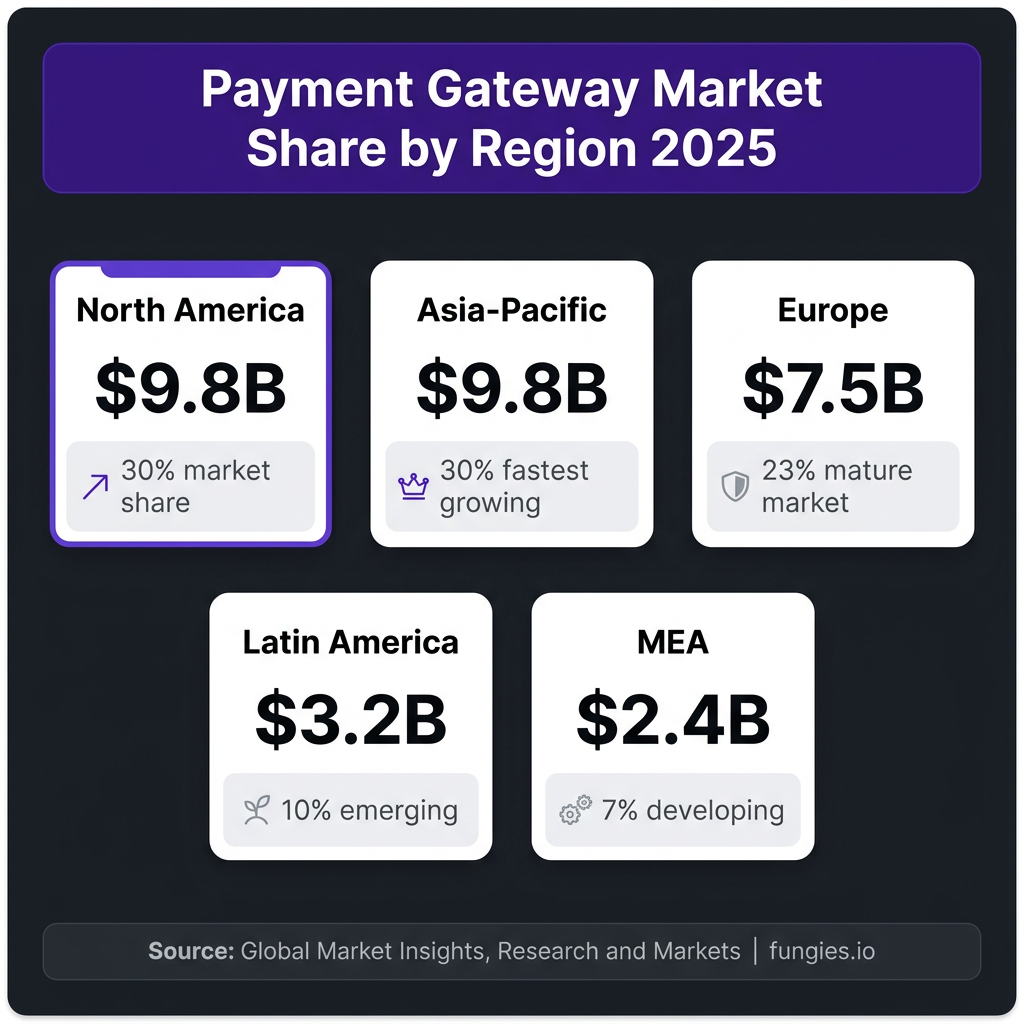
Regional Breakdown: Payment Gateway Markets by Geography
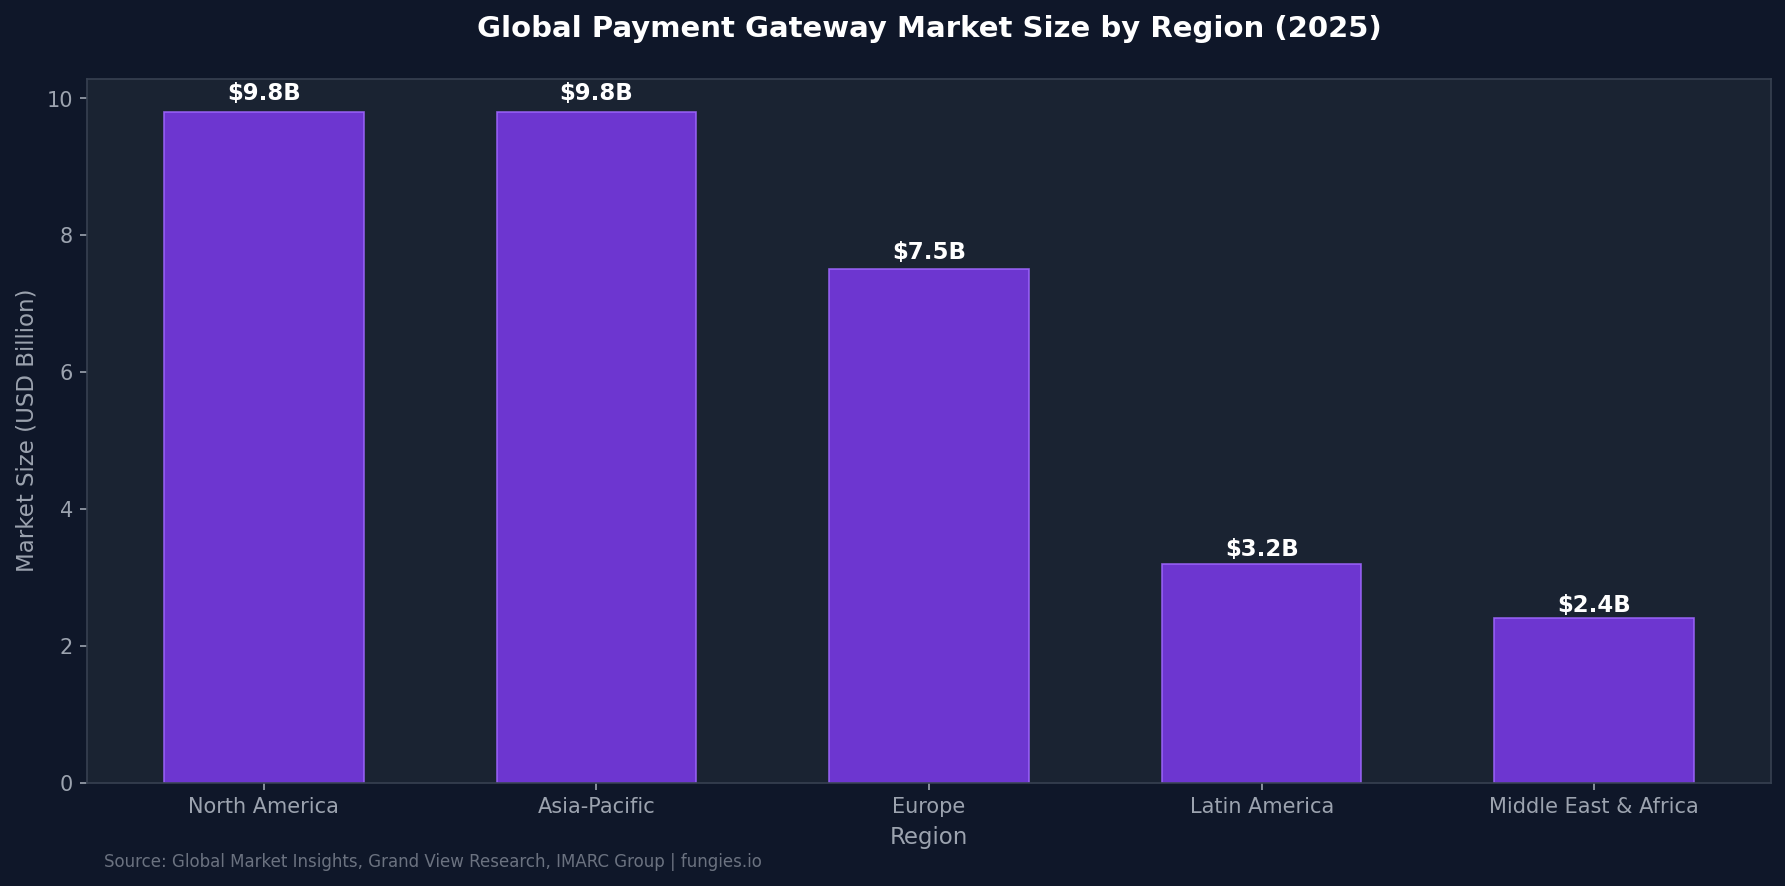
North America currently leads the global payment gateway market, with the United States representing the most mature and technologically advanced ecosystem. According to Yahoo Finance, the U.S. payment gateway market was valued at $6.12 billion in 2025 and is projected to reach $9.39 billion by 2034 at a 4.87% CAGR. However, Global Market Insights estimates the U.S. market at a higher $9.8 billion in 2025, with expectations to grow at 12.4% CAGR through 2035.
Asia-Pacific is emerging as the fastest-growing region, expected to expand at a 20.85% CAGR through 2031 according to Corefy. At 28% of global market share, the region is projected to maintain the highest growth rate, driven by digital payment adoption in India, China, and Southeast Asian markets. India alone represents a significant opportunity—the payment gateway market was valued at approximately $1.2 billion in 2023 and continues to expand rapidly.
Europe represents a mature but evolving market, with strong regulatory frameworks like PSD2 driving innovation in open banking and payment services. The Middle East and Africa (MEA) region, while smaller in absolute terms, shows promising growth potential as digital infrastructure expands and mobile payment adoption accelerates.
| Region | 2025 Market Size | Projected 2034/2035 | CAGR |
|---|---|---|---|
| North America | $9.8 billion | $30+ billion | 12.4% |
| Asia-Pacific | $9.8 billion | $40+ billion | 20.85% |
| Europe | $7.5 billion | $18+ billion | 10% |
| Latin America | $3.2 billion | $12+ billion | 15% |
| Middle East & Africa | $2.4 billion | $8+ billion | 14% |
Key Players & Market Share
The payment gateway landscape is dominated by several major players, each with distinct market positioning and geographic strengths. PayPal continues to lead the market for online payment processing technologies worldwide, holding the largest market share as of May 2026 according to Statista.
Stripe has emerged as the dominant player for developer-focused, API-first payment solutions, particularly among SaaS companies and digital-native businesses. The company’s emphasis on seamless integration and comprehensive documentation has made it the preferred choice for startups and tech companies.
Adyen serves enterprise clients with a unified platform approach, offering payment processing, gateway services, and risk management in a single solution. The company’s strong presence in Europe and expanding footprint in North America and Asia-Pacific positions it as a serious competitor to traditional players.
Other significant players include Checkout.com, which has gained traction with its flexible API and strong performance in Europe and the Middle East; Braintree (PayPal subsidiary), known for its developer-friendly approach; and Square, which dominates the in-person payment gateway segment for small and medium businesses.
| Company | Primary Strength | Key Markets | Notable Features |
|---|---|---|---|
| PayPal | Consumer trust, global reach | Global | Buyer protection, brand recognition |
| Stripe | Developer experience, APIs | North America, Europe | Comprehensive documentation, flexibility |
| Adyen | Enterprise unified platform | Europe, expanding globally | Single platform for all channels |
| Checkout.com | API flexibility, performance | Europe, MEA, Asia | High authorization rates |
| Square | In-person payments, SMBs | North America, Australia | Integrated hardware and software |
| Authorize.Net | Traditional gateway services | North America | Long-established, reliable |
Industry Benchmarks & KPIs
Payment gateway performance directly impacts e-commerce revenue, customer satisfaction, and operational efficiency. According to Uncommon Insights, merchants should aim for a payment success rate above 95% to maximize sales and reduce cart abandonment. Every percentage point below this benchmark represents significant lost revenue.
The payment conversion rate—calculated by dividing the number of purchases by the number of shoppers or visitors—is the most fundamental metric for e-commerce merchants. BlueSnap’s Payment Processing KPI Library notes that up to 40% of online sales are being lost due to mistaken declines, fraud, and friction in the checkout process.
Chargeback rates vary significantly by industry, but high-risk merchants typically face rates of 1-3% compared to 0.5-1% for standard merchants. According to Swell, high-risk merchants pay 4-8% processing fees versus 2-3% for standard accounts, reflecting the increased risk and compliance costs.
Perhaps most striking is the false decline problem: Mastercard estimates false declines cost merchants around $118 billion annually, while actual card fraud losses amount to roughly $9 billion. That’s a 13x gap—merchants are losing significantly more revenue to overly aggressive fraud prevention than to actual fraud.
| KPI | Industry Benchmark | High-Risk Benchmark | Impact of Underperformance |
|---|---|---|---|
| Payment Success Rate | >95% | 90-95% | Direct revenue loss |
| Authorization Rate | 85-92% | 75-85% | Declined transactions |
| Chargeback Rate | <0.5% | <2% | Account termination risk |
| False Decline Rate | <10% | <15% | $118B annual industry loss |
| Processing Fees | 2-3% | 4-8% | Margin compression |
| Refund Rate | <5% | <10% | Customer satisfaction impact |
Payment Gateway Types & Deployment Models
Payment gateways come in several configurations, each suited to different business needs and technical capabilities. According to IMARC Group, hosted payment gateways lead with a 68% share of the total U.S. payment gateways market in 2025. Hosted solutions redirect customers to the gateway’s secure payment page, reducing PCI compliance burden for merchants but offering less customization.
Self-hosted or API-hosted gateways allow merchants to collect payment details directly on their website, providing a seamless customer experience but requiring PCI DSS compliance. These solutions are preferred by larger enterprises with dedicated technical resources and security teams.
Local bank integration gateways connect directly to specific financial institutions, often preferred in regions with strong local banking relationships. These solutions can offer lower transaction fees for domestic payments but may lack the global reach of international providers.
| Gateway Type | U.S. Market Share | Best For | Key Considerations |
|---|---|---|---|
| Hosted Payment Gateways | 68% | SMBs, low technical resources | Lower compliance burden, less customization |
| Self-Hosted/API Gateways | 22% | Enterprises, tech companies | Full control, requires PCI compliance |
| Local Bank Integration | 7% | Domestic-focused businesses | Lower domestic fees, limited international |
| Platform-Based Solutions | 3% | E-commerce platforms | Integrated experience, vendor lock-in |
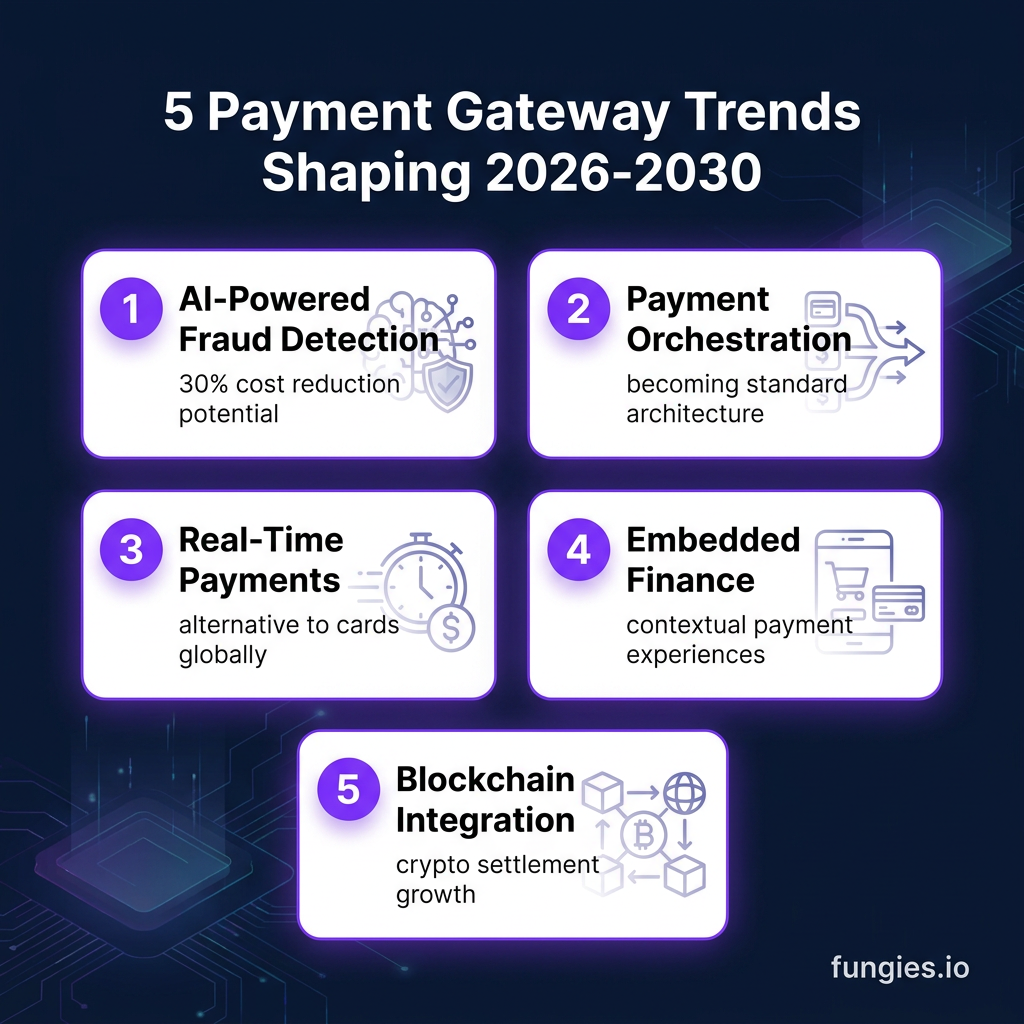
5 Payment Gateway Trends Shaping 2026-2030
1. AI-Powered Fraud Detection and Risk Management
Artificial intelligence is transforming payment security. According to Airwallex, AI applications in automation and fraud detection can potentially reduce costs by 30%. Machine learning models now analyze transaction patterns in real-time, distinguishing between legitimate transactions and fraud with increasing accuracy. In 2026 and 2027, AI models will increasingly decide which payment processor should handle each transaction based on predicted success rates and cost optimization.
2. Payment Orchestration Becomes Standard Architecture
Payment orchestration—intelligently routing transactions across multiple payment providers—is moving from a niche solution to standard architecture for businesses serious about scaling internationally. According to Gr4vy, merchants adopting payment orchestration can optimize authorization rates, reduce costs, and ensure redundancy. As one industry expert noted: “More payment methods, more regions, more regulations, more fraud vectors, more authentication requirements. Businesses that adopt payment orchestration will thrive.”
3. Real-Time Payments as Alternative to Cards
Real-time payment systems are becoming viable alternatives to traditional card networks for both domestic and international transactions. JPMorgan’s Payments Outlook 2026 highlights the shift toward “always-on, connected treasury powered by programmable automation and blockchain technology.” Systems like Pix in Brazil, UPI in India, and FedNow in the United States are demonstrating that account-to-account transfers can offer faster settlement and lower costs than card networks.
4. Embedded Finance and Contextual Payments
According to Getnet’s Future of Payments 2026 report, 39% of consumers—and more than half of Gen Z—are already using AI tools for product discovery. This shift toward “agentic commerce” requires payment infrastructure that can support automated purchasing decisions. Payments are becoming increasingly contextual, shaped not just by who is paying, but by what is being purchased, in which industry, and under which regulatory environment.
5. Blockchain and Cryptocurrency Integration
Blockchain technology is moving beyond speculation into practical payment applications. In 2025, Visa and Circle partnered to bring USDC stablecoin settlement to U.S. banks, demonstrating how traditional payment networks are embracing blockchain infrastructure. According to Research and Markets, “growing blockchain and cryptocurrency integration” is a key driver for payment gateway market growth through 2035, particularly in emerging markets with underbanked populations.
Methodology: How We Compiled This Data
This report aggregates data from multiple authoritative sources published between January and June 2026. We prioritized primary research from established market intelligence firms including Grand View Research, Global Market Insights, Fortune Business Insights, Mordor Intelligence, and SNS Insider. Where sources provided conflicting estimates, we present the range rather than selecting a single figure.
Market size figures are presented in nominal USD unless otherwise specified. CAGR calculations represent compound annual growth rates as reported by original sources. Regional breakdowns are estimated based on available data and may not sum to 100% due to rounding and methodological differences between sources.
Industry benchmarks for KPIs are synthesized from multiple merchant service providers, payment processors, and industry publications. We recommend businesses compare their performance against these benchmarks while considering their specific industry, geography, and risk profile.
Frequently Asked Questions
What is the difference between a payment gateway and a payment processor?
A payment gateway securely transmits transaction data between the merchant, acquiring bank, and card networks. It encrypts sensitive information and facilitates communication between parties. A payment processor actually moves the funds and settles transactions with banks. Many providers (like Stripe or Square) offer both gateway and processing services in a unified solution, while others specialize in just one component.
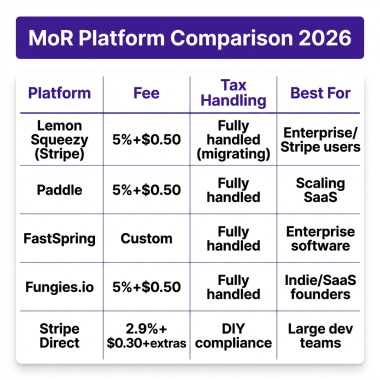
How much does a payment gateway cost?
Payment gateway costs typically include a per-transaction fee (usually 2.9% + $0.30 for standard merchants) plus potential monthly fees, setup fees, and chargeback fees. High-risk merchants can expect to pay 4-8% per transaction due to increased fraud risk and compliance requirements. Some providers offer interchange-plus pricing, which can be more cost-effective for high-volume merchants.
What payment gateway has the highest success rate?
Authorization rates vary by provider, geography, and industry, but leading gateways like Adyen and Checkout.com report authorization rates of 90-95% in optimized configurations. Success rates depend heavily on intelligent routing, local acquiring relationships, and fraud prevention settings. Merchants should benchmark their current performance and test multiple providers to find the optimal solution for their specific transaction profile.
Is the payment gateway market growing?
Yes, the payment gateway market is experiencing robust growth across all regions. Depending on the source, the market is projected to grow at a CAGR of 12-23% through 2033-2035. Key growth drivers include e-commerce expansion, mobile payment adoption, cross-border commerce growth, and the integration of AI and blockchain technologies into payment infrastructure.
What are the biggest challenges facing payment gateways in 2026?
The primary challenges include balancing fraud prevention with user experience (false declines cost merchants $118 billion annually), managing increasing regulatory complexity across jurisdictions, integrating emerging payment methods (BNPL, cryptocurrencies, real-time payments), and maintaining security against evolving cyber threats. Additionally, payment gateways must invest in AI and machine learning capabilities to remain competitive.
Sources & Citations
- Grand View Research — Payment Gateway Market Size, Share | Industry Report 2033: https://www.grandviewresearch.com/industry-analysis/payment-gateway-market
- Global Market Insights — Payment Gateway Market Size & Share 2026-2035: https://www.gminsights.com/industry-analysis/payment-gateway-market
- Fortune Business Insights — Payment Gateway Market Size, Share, Trend 2034: https://www.fortunebusinessinsights.com/payment-gateway-market-111411
- Mordor Intelligence — Payment Gateway Market Size & Share Analysis: https://www.mordorintelligence.com/industry-reports/payment-gateway-market
- SNS Insider — Payment Gateway Market Size & Growth Report 2035: https://www.snsinsider.com/reports/payment-gateway-market-7061
- IMARC Group — US Payment Gateway Market Size, Share, Trends 2026-2034: https://www.imarcgroup.com/united-states-payment-gateways-market
- Yahoo Finance — United States Payment Gateways Market Forecast: https://finance.yahoo.com/markets/stocks/articles/united-states-payment-gateways-market-161100191.html
- Research and Markets — Payment Gateway Market Report 2026: https://www.researchandmarkets.com/reports/5865944/payment-gateway-market-report
- InsightAce Analytic — Payment Gateway Market Size, Growth, Scope: https://www.insightaceanalytic.com/report/payment-gateway-market/1601
- Globe Newswire — Payment Gateway Market Opportunity Report 2026: https://www.globenewswire.com/news-release/2026/05/25/3300539/
- BlueSnap — The Payment Processing KPI Library: https://cdn2.hubspot.net/hubfs/454819/Offers/Payment%20Processing%20KPI%20Library%20-%20BlueSnap.pdf
- Uncommon Insights — Payment Gateway KPIs for eCommerce Growth: https://uncommoninsights.com.au/insights/payment-gateway-kpis-for-ecommerce-growth
- Swell — 30 High-Risk Payment Gateway Statistics 2025: https://www.swell.is/content/high-risk-payment-gateway-statistics
- Merchant Savvy — Global Payment Statistics & Charts 2026: https://www.merchantsavvy.co.uk/digital-payment-market
- Airwallex — 32 Payment Processing Industry Statistics 2025: https://www.airwallex.com/us/blog/payment-processing-industry-statistics
- JPMorgan — Payments Outlook: Five Trends Powering Payments in 2026: https://www.jpmorgan.com/insights/payments/trends-innovation/payments-outlook-trends-2026
- Gr4vy — Global Payment Trends for 2026 and 2027: https://gr4vy.com/posts/global-payment-trends-for-2026-and-2027-whats-changing-next
- Getnet — The Future of Payments, 2026 Vision: https://www.getnetworld.com/content/dam/getnetworld/documents/white-papers/Getnet_Key%20Payments%20Trends_2026.pdf
- LinkedIn/RedCompass — 7 Payments Trends in 2026: https://www.linkedin.com/pulse/7-payments-trends-2026-redcompass-8h46e
- Statista — E-commerce Payment Methods Market Share 2030: https://www.statista.com/statistics/1111233/payment-method-usage-transaction-volume-share-worldwide
Last updated: June 24, 2026. Data represents the most recent available statistics from authoritative industry sources.