Here’s a number that should terrify every SaaS founder: 90% of SaaS companies fail because they scale before they’re ready. And the most common reason? They can’t read their own metrics. After analyzing data from 800+ SaaS companies for the 2025 Benchmarks Report, one pattern is crystal clear — the founders who win aren’t necessarily the ones with the best product. They’re the ones who understand their numbers.
In my experience running paid acquisition for multiple SaaS companies, I’ve seen founders obsess over vanity metrics like total signups or website traffic while completely missing the signals that actually predict success. The median B2B SaaS company now has a Net Revenue Retention of just 101%. That means most companies are barely holding onto their existing revenue, let alone growing efficiently.
What Are SaaS Metrics (And Why Most Founders Track the Wrong Ones)
SaaS metrics are the vital signs of your subscription business. Unlike traditional software companies that rely on one-time purchases, SaaS businesses live or die by recurring revenue, customer retention, and efficient growth. The right metrics tell you whether you’re building a sustainable business or just burning cash.
But here’s the problem: most founders track too many metrics. I’ve seen startup dashboards with 47 different KPIs. When everything’s important, nothing is. The companies that scale successfully focus on a handful of metrics that tell the complete story — acquisition, retention, and profitability.
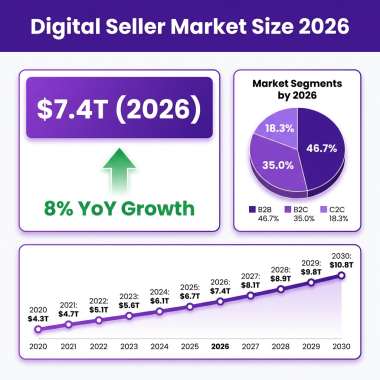
According to Benchmarkit’s 2025 data, private SaaS companies are spending 47% of revenue on sales and marketing (VC-backed) versus 33% for PE-backed companies. That’s a massive difference in efficiency. The question isn’t whether you’re spending money to grow — it’s whether that spend is generating sustainable returns.
Net Revenue Retention (NRR): The North Star Metric for 2026
If you only track one metric, make it Net Revenue Retention. NRR measures how much revenue you retain from existing customers over time, including expansions, contractions, and churn. An NRR above 100% means your existing customers are growing in value — you’re achieving negative churn.
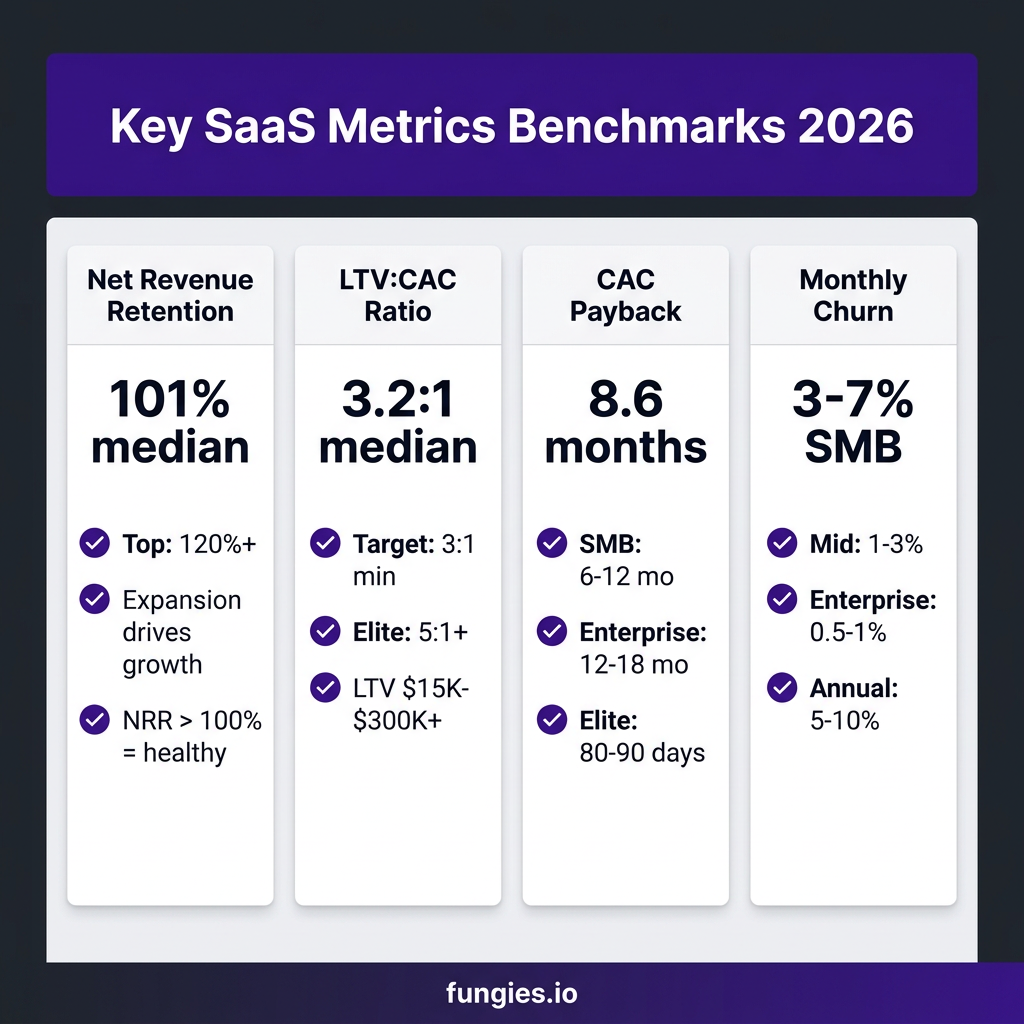
The 2025 benchmarks tell a sobering story. Median NRR across all SaaS companies is just 101%. Top performers hit 120% or higher. Companies with NRR above 120% grow 2.5x faster than those stuck at 100% or below. The difference between 100% and 115% NRR isn’t just 15 percentage points — it’s the difference between a business that needs constant new sales to survive and one that compounds growth organically.
How to Calculate NRR (The Right Way)
NRR = (Starting MRR + Expansion MRR – Contraction MRR – Churned MRR) / Starting MRR × 100
Let’s say you start January with $100,000 in MRR. During the month, you expand existing accounts by $10,000, lose $3,000 to contractions (downgrades), and churn $5,000. Your NRR would be: ($100,000 + $10,000 – $3,000 – $5,000) / $100,000 × 100 = 102%.
Honestly, anything below 100% is a red flag. You’re leaking revenue faster than you can replace it. The 2025 Recurly Churn Report puts median B2B SaaS annual churn at 3.5%, which means you need serious expansion revenue just to stay flat.
LTV:CAC Ratio: The Profitability Engine
Customer Lifetime Value to Customer Acquisition Cost ratio answers the fundamental question: are you spending more to acquire customers than they’re worth? The traditional benchmark is 3:1 — for every dollar you spend acquiring a customer, you should get three back in lifetime value.
But the 2025 data shows the real picture is more nuanced. The median B2B SaaS LTV:CAC ratio is 3.2:1. Elite performers hit 4:1 or higher. A ratio below 3:1 means you’re either spending too much on acquisition or not retaining customers long enough. A ratio above 6:1 might sound great, but it could mean you’re under-investing in growth.
Here’s what the benchmarks look like by segment:
| Segment | LTV Range | CAC Payback | Target LTV:CAC |
|---|---|---|---|
| SMB SaaS | $15K – $40K | 6-12 months | 3:1 minimum |
| Mid-Market | $80K – $200K | 8-14 months | 3.5:1 |
| Enterprise | $300K – $1M+ | 12-18 months | 4:1+ |
The payback period matters just as much as the ratio. A company with a $50K LTV customer who takes 24 months to pay back CAC is in worse shape than a company with a $30K LTV customer who pays back in 8 months. Cash-constrained startups should prioritize faster payback over absolute LTV.
Cohort Analysis: The Retention Diagnostic
Cohort analysis is how you see beneath the surface. Instead of looking at aggregate metrics that hide problems, cohorts track groups of customers who signed up in the same period and follow their behavior over time. This reveals whether your product is getting stickier or if recent cohorts are churning faster.
Here’s a pattern I’ve seen repeatedly: a SaaS company celebrates 80% overall retention while completely missing that customers acquired through their latest marketing campaign are churning at 60%. Aggregate metrics lie. Cohort analysis tells the truth.
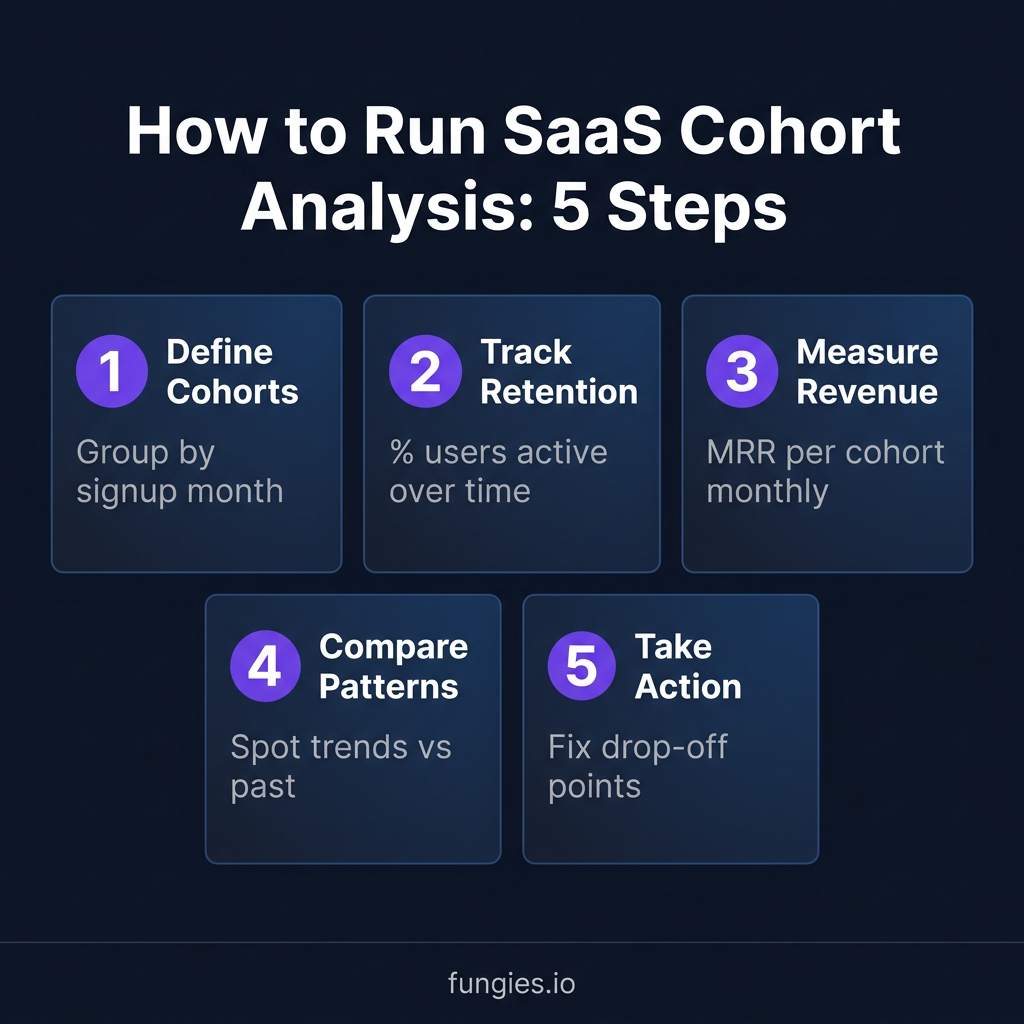
The 5-Step Cohort Analysis Framework
Step 1: Define Your Cohorts
Group customers by acquisition month. You can also segment by acquisition channel, plan type, or company size. The key is comparing apples to apples.
Step 2: Track User Retention
What percentage of each cohort is still active after 1 month, 3 months, 6 months, 12 months? Most SaaS churn happens in the first 90 days. If you can get customers past that point, they’re likely to stay.
Step 3: Measure Revenue Retention
Track MRR per cohort over time. Are customers expanding their spend or contracting? Revenue retention often differs significantly from user retention, especially in B2B SaaS where one power user might drive significant expansion.
Step 4: Compare Cohort Patterns
Are recent cohorts retaining better or worse than older ones? If retention is improving, your product changes are working. If it’s declining, you have a problem — possibly with product-market fit, onboarding, or customer quality.
Step 5: Take Action on Insights
Cohort analysis isn’t just for reporting — it’s for action. If you see a retention cliff at month 3, investigate what happens at that point. Maybe your annual contracts are renewing (or not). Maybe customers hit a usage limit. Fix the drop-off points.
Churn Rate Benchmarks: What’s Normal (And What’s Not)
Churn is the silent killer of SaaS businesses. A 5% monthly churn rate means you’re losing nearly half your customer base every year. You’d have to run just to stay in place.
According to 2025 data, here’s what “normal” looks like:
| Company Type | Monthly Churn | Annual Churn |
|---|---|---|
| SMB SaaS | 3-7% | 31-58% |
| Mid-Market | 1-3% | 11-31% |
| Enterprise | 0.5-1% | 6-12% |
If your churn is significantly higher than these benchmarks, it’s a red flag that needs immediate attention. The 2025 Recurly report found that most customers churn in the first 90 days. Your onboarding experience isn’t just a nice-to-have — it’s a retention mechanism.
The Metrics That Matter by Growth Stage
Not all metrics matter equally at every stage. Here’s what to prioritize:
Pre-Product-Market Fit ($0 – $1M ARR)
Focus on activation rate and early retention. Are users experiencing your product’s core value? Track the percentage of new users who complete your key activation event within the first week. If they don’t activate, they won’t retain.
Growth Stage ($1M – $10M ARR)
This is where LTV:CAC and payback period become critical. You need to prove you can acquire customers profitably at scale. Track NRR closely — expansion revenue should start becoming significant.
Scale Stage ($10M+ ARR)
NRR becomes your primary metric. At this stage, expansion revenue from existing customers should drive a significant portion of growth. Top-quartile companies at $50M+ ARR get over 50% of new ARR from expansion, not new logos.
How to Build Your SaaS Metrics Dashboard
You don’t need expensive BI tools to start. A simple spreadsheet with these metrics updated weekly will tell you more than most fancy dashboards:
- MRR and MRR growth rate
- New customer count and CAC
- Monthly churn rate and NRR
- LTV:CAC ratio
- CAC payback period
- Activation rate (first week)
Update this weekly. Trends matter more than absolute numbers. A churn rate of 4% is fine if it’s improving from 6%. A churn rate of 2% is concerning if it’s deteriorating from 1%.
Common SaaS Metrics Mistakes (And How to Avoid Them)
Mistake 1: Confusing Logo Churn with Revenue Churn
Losing 10% of your customers isn’t the same as losing 10% of your revenue. In B2B SaaS, your biggest customers might represent disproportionate revenue. Track both.
Mistake 2: Ignoring Cohort Quality
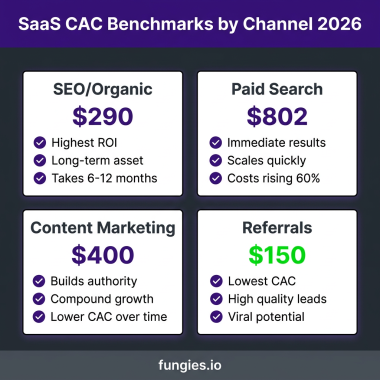
Not all customers are equal. Customers from organic search might have 2x the LTV of customers from paid social. Calculate LTV:CAC by channel, not just overall.
Mistake 3: Using Predicted LTV Instead of Actual
A company with 6 months of history projecting 5-year LTV is guessing. Use actuals where possible, and be conservative with projections.
Mistake 4: Focusing on Vanity Metrics
Total signups, website traffic, app downloads — these don’t pay the bills. Focus on metrics that correlate with revenue and retention.
FAQ: SaaS Metrics Explained
What is a good NRR for SaaS?
A good NRR is above 100%. The median B2B SaaS company has 101% NRR. Top performers exceed 120%. If your NRR is below 100%, you’re losing more revenue from churn and contraction than you’re gaining from expansion.
What LTV:CAC ratio should SaaS companies target?
The minimum healthy LTV:CAC ratio is 3:1. Elite performers hit 4:1 or 5:1. Below 3:1 suggests you’re spending too much on acquisition or not retaining customers long enough. Above 6:1 might mean you’re under-investing in growth.
How do you calculate CAC payback period?
CAC payback period = CAC / (Average MRR per customer × Gross Margin). A healthy payback period is under 12 months for SMB SaaS and under 18 months for enterprise. Elite companies achieve 80-90 day paybacks.
What is cohort analysis in SaaS?
Cohort analysis tracks groups of customers who signed up during the same time period and follows their behavior over time. It reveals retention patterns that aggregate metrics hide, showing whether your product is getting stickier or if recent customers are churning faster.
What’s the difference between gross and net revenue retention?
Gross Revenue Retention (GRR) measures revenue retained from existing customers excluding expansion. Net Revenue Retention (NRR) includes expansion, contraction, and churn. GRR shows how well you keep customers; NRR shows how well you grow existing accounts.
Conclusion: Metrics Are Your Compass
The SaaS companies that survive and thrive aren’t the ones with the fanciest products or the biggest marketing budgets. They’re the ones that understand their unit economics. NRR above 100%. LTV:CAC at 3:1 or better. Cohort retention that improves over time.
These aren’t just numbers on a dashboard. They’re the vital signs of your business. Ignore them at your peril. Master them, and you’ll build something that lasts.
Ready to start tracking the metrics that actually matter? Get started with Fungies and build a SaaS business with the financial foundation to scale.