E-commerce Statistics 2026: Global Market Size, Data & Trends (Comprehensive Report)
The global e-commerce market has crossed into a new era. In 2026, online retail isn’t just an alternative to brick-and-mortar—it’s becoming the dominant form of commerce worldwide. With $7.41 trillion in projected global sales and nearly 2.86 billion people shopping online, understanding the data behind this transformation isn’t optional for businesses—it’s survival.
This comprehensive report compiles verified statistics from eMarketer, Statista, IMARC Group, Grand View Research, and other authoritative sources. Whether you’re a merchant evaluating market opportunities, an investor analyzing growth sectors, or a policymaker tracking digital commerce trends, this data provides the foundation for informed decision-making.
Key E-commerce Statistics at a Glance
- $7.41 trillion — Projected global e-commerce sales in 2026 (eMarketer)
- 2.86 billion — Number of online shoppers worldwide as of 2026
- 20.1% — E-commerce share of total global retail sales
- $2.5 trillion — Mobile commerce (m-commerce) sales, representing 59% of all e-commerce
- 70.2% — Average shopping cart abandonment rate globally
- 2.5% — Global average e-commerce conversion rate
- $2.11 trillion — Social commerce market size in 2026
- 54.3% — Asia Pacific’s share of global e-commerce revenue
- 8% — Year-over-year growth rate for global e-commerce in 2026
- $1.17 trillion — Projected U.S. e-commerce sales for 2026

Global E-commerce Market Size & Growth
The global e-commerce market has demonstrated remarkable resilience and growth trajectory. According to eMarketer, global e-commerce sales reached approximately $6.86 trillion in 2025 and are projected to grow to $7.41 trillion in 2026—representing an 8% year-over-year increase.
Looking at the broader forecast, IMARC Group values the global e-commerce market at $33.80 trillion in 2025 when including B2B transactions, with projections reaching $243.40 trillion by 2034 at a compound annual growth rate (CAGR) of 24.54%. Grand View Research offers a more conservative estimate of $33.91 trillion in 2025, growing to $155.98 trillion by 2033 at a 21.6% CAGR.
The discrepancy between B2C-focused figures (~$7T) and total e-commerce figures (~$34T) highlights a critical insight: Business-to-Business (B2B) e-commerce dominates transaction volume, accounting for 46.7% of all e-commerce activity according to IMARC Group’s 2025 analysis.
| Year | Global E-commerce Sales (B2C) | YoY Growth | Share of Retail |
|---|---|---|---|
| 2020 | $4.28 trillion | 27.6% | 17.8% |
| 2021 | $5.29 trillion | 23.6% | 19.1% |
| 2022 | $5.72 trillion | 8.1% | 19.4% |
| 2023 | $6.03 trillion | 5.4% | 19.5% |
| 2024 | $6.33 trillion | 5.0% | 19.8% |
| 2025 | $6.86 trillion | 8.4% | 20.1% |
| 2026 | $7.41 trillion | 8.0% | 20.8% |
| 2027 | $8.00 trillion | 8.0% | 21.5% |
| 2028 | $8.56 trillion | 7.0% | 22.0% |
| 2030 | $9.71 trillion | 6.5% | 22.6% |
Regional E-commerce Market Breakdown
E-commerce growth is not evenly distributed globally. Asia Pacific dominates the market, while North America and Europe represent mature, high-value markets with significant per-transaction values.
Asia Pacific leads with 54.3% of global e-commerce revenue in 2025, according to IMARC Group. This dominance is driven by China’s massive digital economy—accounting for 83% of regional e-commerce sales—alongside rapid growth in India (fueled by the government-backed ONDC network) and Southeast Asia’s mobile-first consumer base.
North America holds approximately 18.2% of global market share, with the U.S. representing the second-largest e-commerce market worldwide. U.S. e-commerce penetration reached 16.2% of total retail sales in 2024 and is projected to hit 18% in 2026.
| Region | Market Share (2025) | Market Value (2026 est.) | Key Growth Driver |
|---|---|---|---|
| Asia Pacific | 54.3% | $4.02 trillion | China, India ONDC, SEA mobile growth |
| North America | 18.2% | $1.35 trillion | U.S. market maturity, high AOV |
| Europe | 15.8% | $1.17 trillion | Cross-border e-commerce, digital adoption |
| Latin America | 6.1% | $452 billion | Brazil, Mexico digital payments growth |
| Middle East & Africa | 5.6% | $415 billion | Fastest-growing region (high CAGR) |

Key Players & Market Share
The e-commerce landscape is characterized by high concentration among a few dominant players, particularly in the U.S. market.
Amazon maintains its position as the global e-commerce leader, capturing 40.4% of U.S. retail e-commerce sales in 2025—approximately $491.65 billion in gross merchandise value. Globally, Amazon recorded nearly $638 billion in revenue in 2024, making it not just the largest e-commerce platform but one of the world’s largest companies by revenue.
Alibaba Group dominates the Asian market through its portfolio of platforms including Taobao, Tmall, and AliExpress. While exact 2026 figures vary by source, Alibaba’s ecosystem processes trillions of dollars in annual GMV across its Chinese and international marketplaces.
Walmart has emerged as the second-largest U.S. online retailer with approximately 10% market share. The retail giant has leveraged its physical store network as distribution centers, enabling same-day pickup and delivery capabilities that pure-play online retailers struggle to match.
| Company | U.S. Market Share (2025) | Global Revenue (2024) | Key Markets |
|---|---|---|---|
| Amazon | 40.4% | $638 billion | Global (U.S., Europe, India) |
| Walmart | 10.0% | $648 billion (total) | U.S., expanding internationally |
| Apple | 3.9% | $391 billion | Global (premium electronics) |
| eBay | 3.5% | $10.1 billion | Global (marketplace/C2C) |
| Target | 2.4% | $107 billion | Primarily U.S. |
| Costco | 2.1% | $242 billion | U.S., Canada, International |
| Home Depot | 2.0% | $152 billion | North America |
Industry Benchmarks & Performance Metrics
Understanding how your e-commerce business compares to industry benchmarks is essential for identifying optimization opportunities. Here’s what the data tells us about key performance indicators in 2026.
Conversion Rates by Industry
The global average e-commerce conversion rate hovers between 2.5% and 3.0%, but this aggregate figure masks significant variation across industries. According to Statista’s Q1 2026 data, the food & beverage and beauty & skin sectors achieved the highest conversion rates at 2.4%, while the overall average across all sectors was 1.4%.
| Industry | Conversion Rate (2026) | Add-to-Cart Rate |
|---|---|---|
| Food & Beverage | 6.0% | 9.76% |
| Beauty & Personal Care | 2.4% | 6.5% |
| Health & Pharmacy | 3.0% | 6.8% |
| Fashion & Apparel | 1.8% | 5.2% |
| Electronics | 1.5% | 4.8% |
| Home & Furniture | 1.2% | 4.2% |
| Luxury & Jewelry | 0.9% | 2.28% |
| Global Average | 2.5% | 7.52% |
Shopping Cart Abandonment
Cart abandonment remains one of e-commerce’s most persistent challenges. The global average cart abandonment rate in 2026 ranges from 70% to 78%, with mobile devices showing even higher abandonment at 85% according to Upsella’s 2026 analysis.
The primary reason for abandonment? Unexpected shipping costs, cited by 48% of consumers. Other significant factors include the requirement to create an account (24%), concerns about payment security (18%), and complicated checkout processes (17%).
| Industry | Cart Abandonment Rate (2026) |
|---|---|
| Luxury & Jewelry | 81.68% |
| Beauty & Personal Care | 82.32% |
| Fashion | 76.4% |
| Travel & Hospitality | 80.1% |
| Electronics | 74.2% |
| Pet Care & Veterinary | 52.49% |
| Global Average | 70.2% |
Average Order Value (AOV)
Average order value varies dramatically by industry. According to Dynamic Yield’s 2026 benchmarks, Luxury & Jewelry commands the highest AOV at $349, while Pet Care & Veterinary Services has the lowest at $68.
Mobile Commerce (M-Commerce) Statistics
Mobile commerce has transitioned from emerging trend to dominant force. In 2026, mobile devices account for 59% of all e-commerce sales worldwide—approximately $2.5 trillion in transaction value.
According to Mordor Intelligence, the global m-commerce market is projected to grow from $2.64 trillion in 2025 to $4.16 trillion by 2031 at a robust CAGR. This growth is driven by smartphone penetration, improved mobile checkout experiences, and the proliferation of mobile payment solutions.
Key insight: Mobile apps significantly outperform mobile websites. Apps convert at 3.5% compared to just 2% for mobile websites, and cart abandonment is dramatically lower (20% vs. 85%).
| Metric | Value (2026) |
|---|---|
| Mobile Share of E-commerce | 59% |
| Global M-Commerce Sales | $2.5 trillion |
| Mobile App Conversion Rate | 3.5% |
| Mobile Web Conversion Rate | 2.0% |
| Mobile Cart Abandonment | 85% |
| Digital Wallet Transaction Value | $10 trillion |
Social Commerce Market Data
Social commerce—purchases made directly through social media platforms—has exploded into a $2.11 trillion global market in 2026, growing at a 29.12% CAGR according to Mordor Intelligence.
The U.S. social commerce market reached $114.7 billion in 2025 and is projected to grow to $188.3 billion by 2030. TikTok Shop has emerged as a major player, capturing 18.2% of total U.S. social commerce with $15.82 billion in sales in 2025—a 108% year-over-year increase.
Globally, social commerce is forecast to represent 22.4% of all e-commerce transactions in 2026, up from 17% in 2025. Facebook remains the most popular social commerce platform in the U.S., with over 250 million monthly active users engaging with Facebook Shops.
| Platform | U.S. Social Commerce Share (2025) | Key Metrics |
|---|---|---|
| 32% | 250M monthly active shop users | |
| 24% | Strong visual commerce focus | |
| TikTok Shop | 18.2% | $15.82B sales, 108% YoY growth |
| 12% | High purchase intent users | |
| Other | 13.8% | Snapchat, YouTube, emerging |
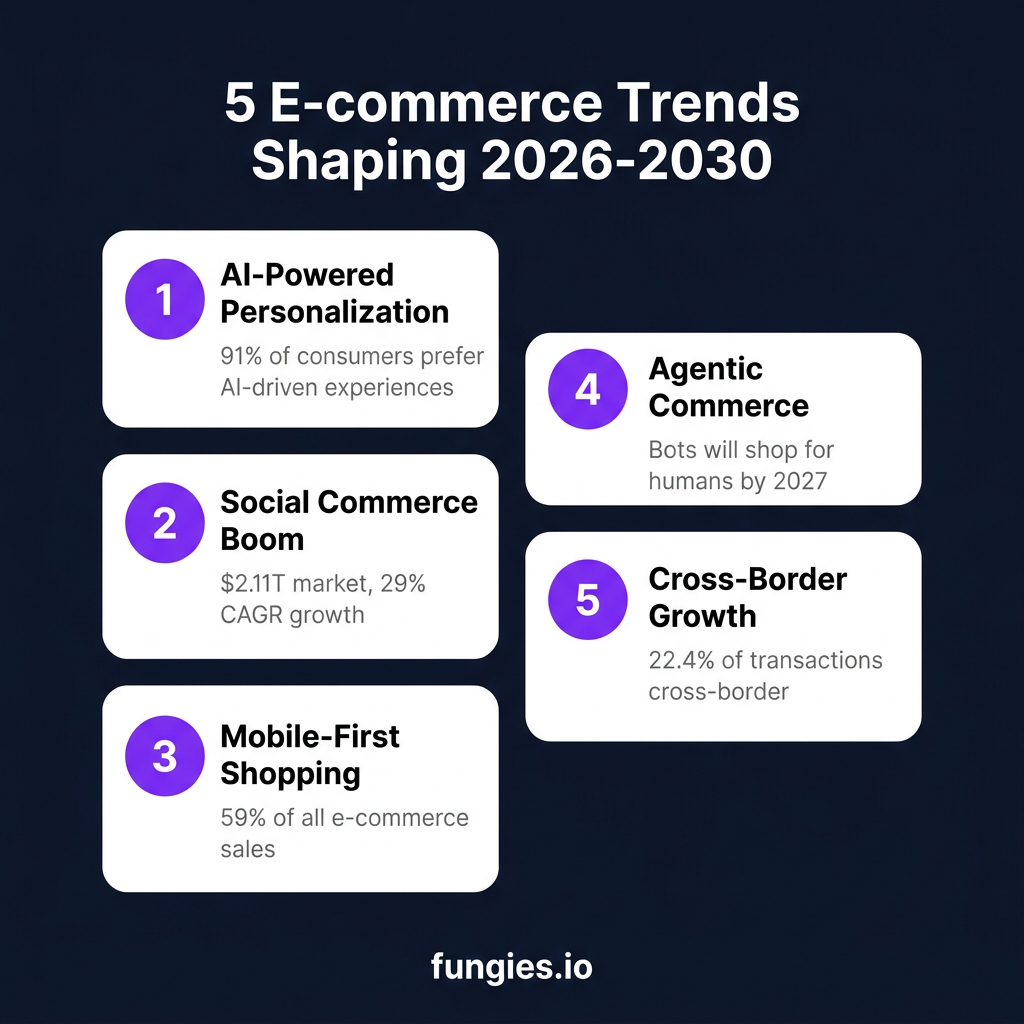
5 E-commerce Trends Shaping 2026-2030
1. AI-Powered Personalization
Artificial intelligence is transforming e-commerce from a one-size-fits-all experience to hyper-personalized shopping journeys. According to Elementor’s 2025 research, 91% of consumers prefer brands that offer personalized experiences, and 80% are more likely to make a purchase when personalization is present.
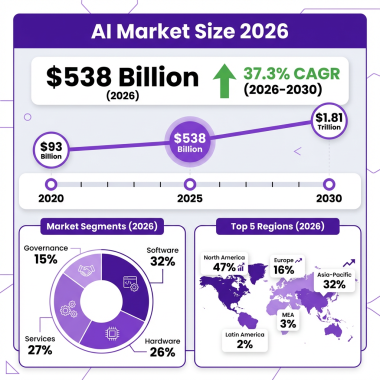
The global AI e-commerce market is projected to approach $51 billion by 2033, expanding at a CAGR of 24.3%. Applications include AI-powered product recommendations, visual search, chatbots for conversational commerce, and predictive inventory management.
2. Agentic Commerce
Perhaps the most transformative trend on the horizon is “agentic commerce”—AI agents that shop on behalf of consumers. According to Signifyd’s State of Commerce Report 2026, these autonomous shopping agents will search, compare, and purchase products based on consumer-defined parameters.
Juniper Research predicts this shift will fundamentally reshape e-commerce transactions, with agentic commerce becoming a significant channel that merchants cannot afford to ignore by 2027.
3. Cross-Border E-commerce Expansion
Cross-border e-commerce is accelerating, with 22.4% of all e-commerce transactions now crossing international borders. For merchants, this represents both opportunity and complexity—managing multiple currencies, tax jurisdictions, and shipping logistics.
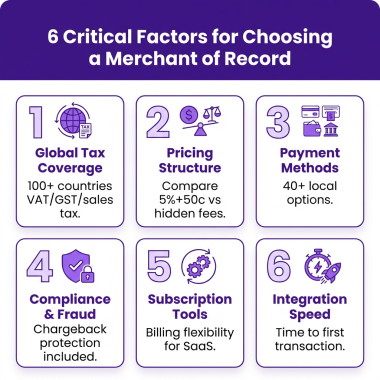
Platforms like Fungies.io are addressing this complexity by providing merchant-of-record services that handle VAT, sales tax compliance, and localized payment methods automatically.
4. Digital Product Passports (DPP)
The rise of Digital Product Passports—digital records containing detailed product information including origin, materials, and sustainability credentials—is reshaping supply chain transparency. The EU has mandated DPPs for certain product categories by 2027, and this trend is expected to expand globally.
5. Live Shopping & Live Commerce
Live shopping, already massive in China (where it represents 10% of total e-commerce), is gaining traction in Western markets. Conversion rates for live shopping events can reach 30%—significantly higher than traditional e-commerce. TikTok Shop and Instagram Live Shopping are leading this trend in the U.S. and Europe.
Methodology & Data Sources
This report compiles data from authoritative industry sources including eMarketer, Statista Market Forecast, IMARC Group, Grand View Research, Mordor Intelligence, the U.S. Census Bureau, and Eurostat. Market size figures represent the most recent available data as of June 2026.
Figures are presented in U.S. dollars unless otherwise noted. CAGR (Compound Annual Growth Rate) calculations are based on reported projections from respective research firms. Regional market share percentages may not sum to exactly 100% due to rounding and varying methodologies across sources.
Conversion rate and cart abandonment benchmarks are derived from aggregated platform data across millions of e-commerce transactions. Industry-specific metrics represent averages and actual performance will vary based on traffic quality, brand recognition, pricing strategy, and user experience optimization.
Frequently Asked Questions
What is the global e-commerce market size in 2026?
The global e-commerce market is projected to reach $7.41 trillion in 2026 for B2C transactions, according to eMarketer. When including B2B e-commerce, the total market size is estimated at approximately $33-34 trillion.
What percentage of retail sales are e-commerce?
E-commerce accounts for 20.1% of total global retail sales in 2025, projected to reach 22.6% by 2027. In the United States, e-commerce penetration is approximately 16-18% of total retail sales.
What is the average e-commerce conversion rate?
The global average e-commerce conversion rate is 2.5% to 3.0%, though this varies significantly by industry. Food & beverage achieves the highest rates (6%), while luxury & jewelry has the lowest (0.9%).
What is the shopping cart abandonment rate?
The global average cart abandonment rate is 70.2%, meaning approximately 7 out of 10 shopping carts are abandoned before checkout completion. Mobile devices show even higher abandonment at 85%.
Which region has the largest e-commerce market?
Asia Pacific dominates global e-commerce with 54.3% of total revenue, led by China which accounts for 83% of regional sales. North America is second with 18.2% market share.
Sources & Citations
- eMarketer — Global E-commerce Forecast 2026: emarketer.com
- Statista — E-commerce Worldwide Statistics: statista.com
- IMARC Group — E-commerce Market Report 2026: imarcgroup.com
- Grand View Research — E-commerce Market Size 2026-2033: grandviewresearch.com
- Mordor Intelligence — M-Commerce Market Report: mordorintelligence.com
- U.S. Census Bureau — Quarterly Retail E-commerce Sales: census.gov
- Dynamic Yield — E-commerce Benchmarks 2026: dynamicyield.com
- Upsella — Cart Abandonment Statistics 2026: upsella.com
- SellersCommerce — Shopping Cart Abandonment Statistics: sellerscommerce.com
- EmberTribe — E-commerce Statistics 2026: embertribe.com
- SearchLab — E-commerce Statistics 2026: searchlab.nl
- Coherent Market Insights — Retail E-commerce Market: coherentmarketinsights.com
- Forrester — US Retail E-commerce Forecast 2030: forrester.com
- Ringly.io — Social Commerce Statistics 2026: ringly.io
- SQ Magazine — Social Commerce Statistics: sqmagazine.co.uk
- Droids On Roids — Mobile Commerce Guide 2026: thedroidsonroids.com
- DemandSage — Mobile Commerce Statistics 2026: demandsage.com
- Signifyd — State of Commerce Report 2026: signifyd.com
- Convertibles.dev — E-commerce Conversion Rate Benchmarks: convertibles.dev
- Blend Commerce — Shopify Conversion Rate Benchmarks: blendcommerce.com