The digital commerce landscape has reached an inflection point in 2026. With global e-commerce sales projected to hit $6.88 trillion this year, representing 21.1% of all retail commerce worldwide, the question is no longer whether to sell online—but how to do it profitably in an increasingly competitive environment. For digital sellers, entrepreneurs, and e-commerce operators, understanding the current market dynamics isn’t just helpful; it’s essential for survival.
The transformation we’ve witnessed since 2020 has been nothing short of revolutionary. What began as a pandemic-driven shift to online shopping has evolved into a permanent behavioral change. Consumers now expect seamless digital experiences, personalized recommendations, and instant gratification. The sellers who thrive in this environment are those who treat e-commerce not as a channel, but as a core business discipline backed by data, technology, and customer-centric strategy.

Market Overview: The $6.88 Trillion Digital Commerce Ecosystem
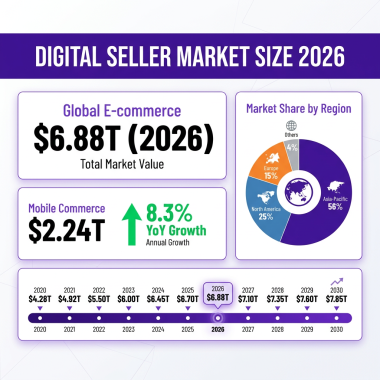
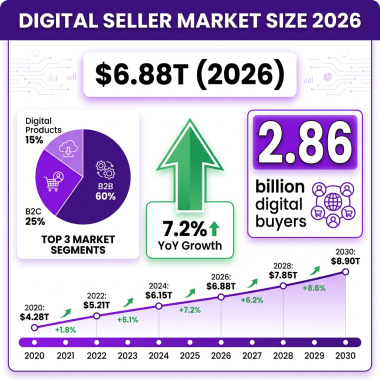
The global e-commerce market has demonstrated remarkable resilience and growth trajectory. According to the latest market research, the industry reached $4.41 trillion in 2025 and is on track to exceed $6.88 trillion in 2026. This represents a compound annual growth rate (CAGR) of approximately 12.6%, with projections suggesting the market will approach $7.93 trillion by 2028 and potentially $29.29 trillion by 2035 as digital commerce continues to penetrate new markets and verticals.
The scale of this growth becomes even more impressive when we examine regional breakdowns. Asia-Pacific dominates the global e-commerce landscape, commanding a 56% revenue share in 2025, with China alone accounting for approximately $2.2–$2.4 trillion in online retail sales. This represents roughly 83% of the region’s total e-commerce volume. The sheer size of China’s digital commerce market—driven by platforms like Alibaba, JD.com, and Pinduoduo—has created a template that other emerging markets are rapidly trying to replicate.
North America remains the second-largest market, with the United States projected to reach $1.88 trillion in e-commerce sales by 2029. The U.S. market is particularly notable for its maturity and sophistication, with online sales accounting for 15.4% of total retail sales in Q4 2023 and climbing steadily. The UK represents Europe’s strongest e-commerce market, with online sales expected to account for more than 28% of all retail sales in 2026, rising to nearly 30% by 2030.
What’s particularly interesting for digital sellers is the emergence of South America as the fastest-growing region, with an estimated CAGR of 13.8% through 2035. Fueled by fintech expansion, improved logistics infrastructure, and cross-border e-commerce capabilities across Brazil and Mexico, this region represents a significant opportunity for sellers willing to navigate its unique challenges. Similarly, the Middle East and Africa are posting the steepest gains in cross-border e-commerce adoption, with nearly 48% of online retail in these regions now involving international transactions.
The mobile commerce (m-commerce) segment deserves special attention, as it has become the dominant force in digital retail. Global mobile commerce sales hit $2.5 trillion in 2025, representing 59% of all e-commerce worldwide. The m-commerce market is projected to grow from $2.42 trillion in 2026 to $5.01 trillion by 2034, exhibiting a CAGR of 9.5%. This shift toward mobile-first shopping has profound implications for digital sellers, requiring optimized mobile experiences, streamlined checkout processes, and mobile-specific marketing strategies.

Key Statistics and Data Points Every Digital Seller Must Know
Data-driven decision making separates successful digital sellers from those who struggle. Here are the critical statistics shaping the e-commerce landscape in 2026:
Market Size and Growth Metrics
- Global e-commerce market 2026: $6.88 trillion (up from $6.4 trillion in 2024)
- Year-over-year growth rate: 8.3%
- E-commerce share of total global retail: 21.1%
- Projected e-commerce market 2028: $7.89 trillion
- Long-term projection 2035: $29.29 trillion (CAGR 14.36%)
- Alternative market sizing (IMARC): $33.80 trillion in 2025, projected to reach $243.40 trillion by 2034 (CAGR 24.54%)
Regional Market Breakdown
- Asia-Pacific market share: 56% of global e-commerce revenue
- China online retail sales: $2.2–$2.4 trillion (83% of Asia-Pacific)
- U.S. e-commerce market 2025: $1.43 trillion
- U.S. e-commerce share of total retail: 15.4% (Q4 2023)
- UK online share of retail: 28% (2026), projected 30% by 2030
- South America growth rate: 13.8% CAGR (fastest-growing region)
Mobile Commerce Statistics
- Global m-commerce sales 2025: $2.5 trillion
- M-commerce share of total e-commerce: 59%
- M-commerce market 2026: $2.42 trillion
- M-commerce projection 2034: $5.01 trillion
- Mobile app conversion rate: 3.5% (vs. 2% for mobile web)
- Mobile cart abandonment rate: 85% (vs. 20% for apps)
- Digital wallet transaction volume: $10 trillion globally
Digital Goods and Social Commerce
- Digital goods market 2025: $124.32 billion
- Digital goods projection 2031: $511.43 billion (CAGR 26.60%)
- Social commerce market 2026: $2.21 billion
- Social commerce projection 2034: $27.52 billion (CAGR 37.04%)
- U.S. social commerce 2026: Crossed $100 billion for the first time (18% YoY growth)
Cross-Border E-Commerce
- Cross-border e-commerce market 2025: $1.75 trillion
- Cross-border market 2026: $1.74–$2.08 trillion
- Cross-border share of global e-commerce: 33.7% (2026)
- Cross-border projection 2033: $4.85 trillion (CAGR 18.6%)
- Middle East & Africa cross-border share: 48%
- Amazon cross-border revenue 2024: $398.5 billion
AI and Personalization Impact
- AI in e-commerce market 2025: $9.01 billion
- AI e-commerce projection 2035: $74.93 billion (CAGR 23.59%)
- Companies using AI: 78%
- Commerce companies with AI plans: 97%
- Revenue increase from personalization: 40% more for leaders
- Product recommendations revenue share: 31% of e-commerce revenues
- Personalized email transaction rates: 6x higher than non-personalized
- AI-powered customer lifetime value increase: 33%
- Real-time personalization conversion lift: 20% higher than batch processing
Conversion and Cart Abandonment
- Global e-commerce conversion rate: 1.4–2.5% (varies by industry)
- Food & beverage conversion rate: 2.4% (highest)
- Beauty & skin conversion rate: 2.4%
- Email marketing conversion: 4.0–5.3% (highest traffic source)
- Cart abandonment rate 2026: 70.19–70.22%
- Cart abandonment due to extra costs: 48% of shoppers
DTC and Platform Economics
- U.S. DTC e-commerce 2025: $239.75 billion (19.2% of retail e-commerce)
- Global DTC projection 2033: $595 billion (from $163 billion in 2024, CAGR 15.4%)
- Amazon U.S. market share: 35.7% ($440 billion in sales)
- Shopify U.S. market share: 14% (up from 12% in 2024)
- Combined Amazon + Shopify U.S. share: 49.7%
- Shopify global platform share: 10.32%
- Active Shopify stores: 4.8 million (3 million in U.S.)
- Shopify GMV 2026: $280 billion
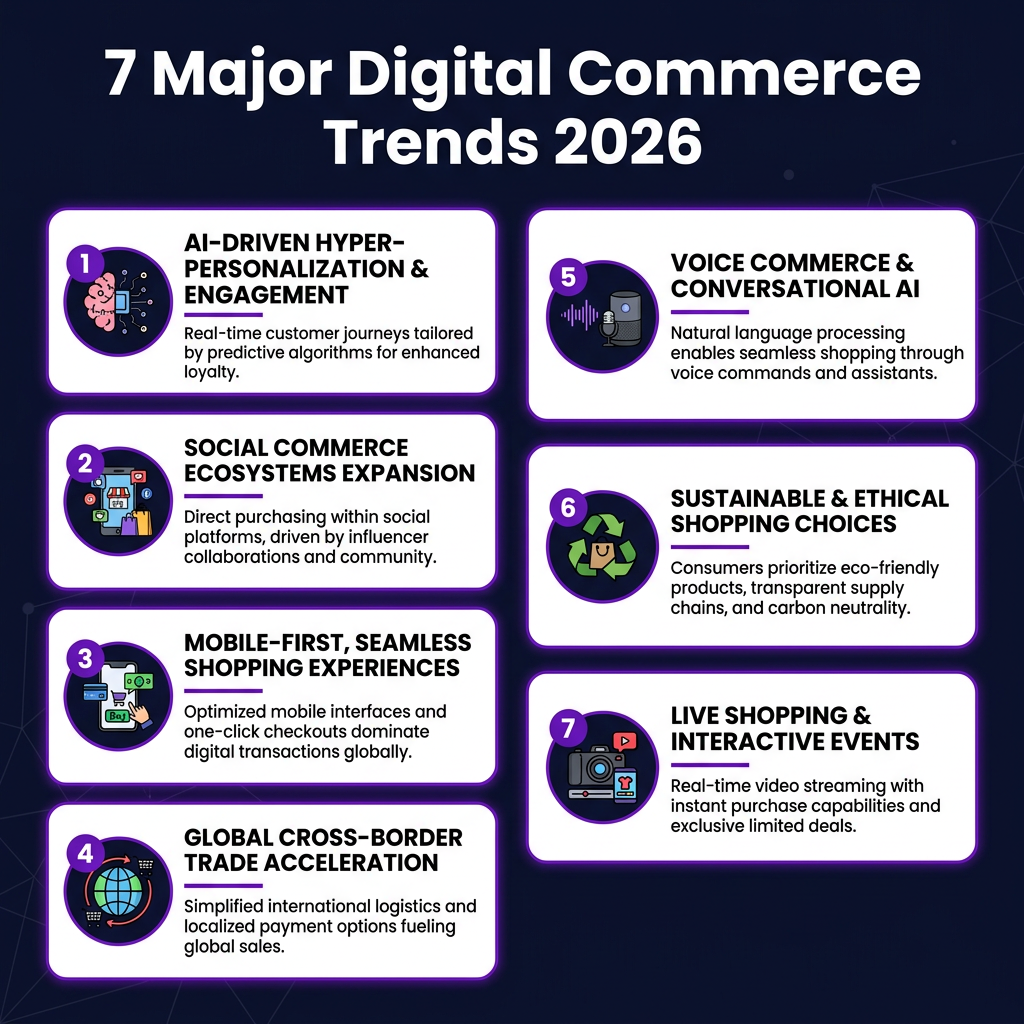
Seven Major Trends Shaping Digital Commerce in 2026
The e-commerce landscape is evolving at a pace that demands constant adaptation. Here are the seven trends that will define digital selling in 2026 and beyond:
1. AI-Powered Hyper-Personalization at Scale
Artificial intelligence has moved from experimental to essential in e-commerce. With 97% of commerce companies now having AI implementation plans, the competitive advantage has shifted from whether you use AI to how effectively you deploy it. The data is compelling: companies generating 40% more revenue from personalization efforts are growing approximately 10 percentage points faster than laggards.
AI personalization now extends far beyond product recommendations (which alone drive up to 31% of e-commerce revenues). Modern implementations include dynamic pricing, personalized search results, customized email content, and even AI-generated product descriptions tailored to individual shopper preferences. Real-time personalization delivers 20% higher conversion rates than batch processing, and sessions with personalized experiences show 369% increases in average order value.
For digital sellers, the implication is clear: investing in AI-powered personalization tools isn’t optional—it’s a prerequisite for competitive parity. The technology has matured to the point where even small sellers can access sophisticated personalization through platforms like Shopify’s AI Sidekick, Klaviyo’s predictive analytics, and third-party tools like Nosto or Dynamic Yield.
2. The Explosion of Social Commerce
Social commerce has crossed the threshold from novelty to necessity. With the U.S. social commerce market exceeding $100 billion for the first time in 2026 (representing 18% year-over-year growth), platforms like TikTok, Instagram, and Pinterest have become legitimate sales channels—not just marketing tools.
The social commerce market is projected to grow from $2.21 billion in 2026 to $27.52 billion by 2034, a staggering CAGR of 37.04%. This growth is driven by native shopping tools, enhanced product discovery algorithms, and the seamless integration of content consumption with purchase capability. The “see it, want it, buy it” impulse loop has never been tighter.
Live shopping events—already massive in China—are gaining traction globally. These real-time, interactive shopping experiences combine entertainment with commerce, creating urgency and social proof simultaneously. For digital sellers, building a social commerce strategy that includes shoppable posts, influencer partnerships, and potentially live shopping events is no longer a “nice to have”—it’s essential for reaching younger demographics where they spend their time.
3. Mobile-First as the Default
With mobile commerce accounting for 59% of global e-commerce sales, the mobile experience is no longer a secondary consideration—it’s the primary one. The disparity in performance between mobile apps and mobile web is striking: apps convert at 3.5% compared to just 2% for mobile websites, and cart abandonment rates are 20% for apps versus 85% for mobile web.
This trend has several implications for digital sellers. First, mobile optimization is non-negotiable. Sites must load quickly, navigation must be thumb-friendly, and checkout processes must be streamlined for small screens. Second, the case for investing in a native mobile app has never been stronger for established sellers with repeat customers. Third, payment methods must accommodate mobile-first preferences, including digital wallets (processing $10 trillion globally), one-click checkout, and buy-now-pay-later options.
The mobile commerce market’s projected growth from $2.42 trillion in 2026 to $5.01 trillion by 2034 underscores the long-term importance of this trend. Sellers who fail to prioritize mobile are effectively ignoring the majority of their potential market.
4. Cross-Border E-Commerce Normalization
Cross-border e-commerce now represents 33.7% of all global online retail, up from 31.2% in 2025. The market is valued at approximately $1.74–$2.08 trillion in 2026 and is projected to reach $4.85 trillion by 2033 (CAGR 18.6%). For digital sellers, this represents a massive expansion of addressable market without the traditional costs of international retail expansion.
The drivers of cross-border growth include improved logistics networks, streamlined customs processes, localized payment methods, and AI-powered translation and localization tools. Amazon’s cross-border revenue of $398.5 billion in 2024 demonstrates the scale of opportunity, while platforms like Shopify Markets and specialized cross-border solutions have made international selling accessible to smaller merchants.
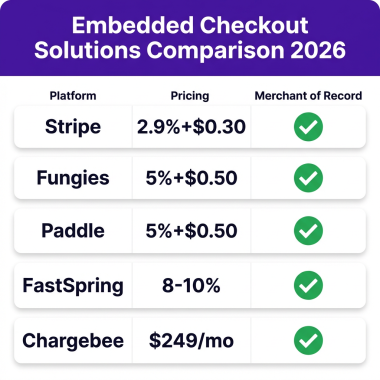
However, cross-border selling brings complexity: tax compliance (VAT, GST, sales tax), currency conversion, international shipping logistics, and cultural localization. The sellers who succeed in cross-border commerce are those who invest in infrastructure—whether through platforms like Fungies.io that handle tax compliance automatically, or through dedicated cross-border solutions that manage the operational complexity.
5. Voice Commerce and Conversational AI
Voice-activated shopping through smart speakers and voice assistants is gaining momentum, though it remains an emerging rather than dominant channel. The integration of conversational AI into e-commerce—through chatbots, virtual shopping assistants, and voice interfaces—is transforming how customers discover and purchase products.
Modern AI agents can handle complex customer service inquiries, provide personalized product recommendations through natural conversation, and even complete transactions. As natural language processing continues to improve, the friction between intention and purchase will continue to decrease. For digital sellers, optimizing for voice search and exploring conversational commerce interfaces represents a forward-looking investment in customer experience.
6. Sustainability as a Purchase Driver
Environmental consciousness is increasingly influencing purchase decisions, particularly among younger consumers. Sustainable packaging, carbon-neutral shipping options, and transparent supply chains are becoming competitive differentiators rather than niche concerns. Digital sellers who can authentically demonstrate environmental responsibility—through verified certifications, transparent sourcing, and concrete sustainability metrics—are capturing a growing segment of conscious consumers.
This trend extends to the digital goods market as well, where the environmental impact of blockchain technologies and NFTs has come under scrutiny. Sellers in the digital products space must be prepared to address sustainability concerns and position their offerings appropriately.
7. The Rise of Live Shopping and Interactive Commerce
Live shopping—real-time, interactive video streams where hosts demonstrate products and viewers can purchase instantly—has exploded in popularity, particularly in Asian markets. While adoption in Western markets has been slower, the trend is accelerating. The combination of entertainment, education, and commerce creates a powerful engagement mechanism that traditional e-commerce struggles to replicate.
For digital sellers, live shopping represents an opportunity to build authentic connections with customers, demonstrate products in real-world contexts, and create urgency through limited-time offers. Platforms like TikTok Shop, Instagram Live Shopping, and dedicated live commerce platforms are making this format increasingly accessible.

Key Players and Competitive Landscape
The e-commerce competitive landscape is dominated by a handful of platforms and marketplaces, but opportunities exist for sellers who understand the ecosystem dynamics.
The Platform Duopoly: Amazon and Shopify
Amazon and Shopify together account for approximately 50% of U.S. e-commerce—a remarkable concentration of market power. Amazon generated roughly $440 billion in U.S. sales in 2025, representing a 35.7% share of the $1.2 trillion U.S. e-commerce market. Shopify, reporting U.S. market share for just the second time in its Q4 2025 earnings, claimed 14% (up from 12% a year prior).
Amazon’s dominance is built on its marketplace model, fulfillment infrastructure (FBA), and Prime membership ecosystem. For sellers, Amazon offers unparalleled reach but at the cost of reduced margins, platform dependency, and intense competition. The Amazon marketplace has become increasingly crowded, with advertising costs rising and organic visibility declining.
Shopify represents the alternative: a platform for building independent online stores with full brand control. With 4.8 million active stores globally (3 million in the U.S.) and $280 billion in GMV for 2026, Shopify has become the infrastructure layer for independent e-commerce. The platform’s ecosystem—encompassing payments (Shopify Payments), fulfillment (Shopify Fulfillment Network), and AI tools (Sidekick)—provides sellers with enterprise-grade capabilities at accessible price points.
Other Significant Players
- Walmart: The only genuine competitor to Amazon at scale, with growing marketplace capabilities but still a fraction of Amazon’s volume in online sales.
- eBay: Remains significant for specific categories (collectibles, used goods, automotive) but has lost general merchandise share.
- Etsy: Dominates handmade, vintage, and craft categories with a loyal customer base willing to pay premium prices.
- BigCommerce: Enterprise-focused alternative to Shopify, particularly strong in B2B e-commerce.
- WooCommerce: The WordPress-based solution powers millions of stores, particularly popular among content-first businesses.
- Alibaba: Dominates Chinese and Asian markets, with cross-border capabilities through AliExpress.
- Shopee: Leading platform in Southeast Asia with 52% market share in key markets.
Emerging Platforms and Trends
Beyond traditional e-commerce platforms, social media platforms are increasingly becoming commerce destinations. TikTok Shop, Instagram Shopping, Pinterest Shopping, and Facebook Marketplace represent new channels where discovery and purchase happen within the same ecosystem. For digital sellers, these platforms offer lower barriers to entry and access to engaged audiences, though often with less control over customer relationships and data.
Challenges and Pain Points for Digital Sellers
Despite the enormous opportunity, digital selling is not without significant challenges. Understanding these pain points is essential for developing effective strategies.
1. Cart Abandonment: The $4 Trillion Problem
Cart abandonment remains the single largest source of lost revenue in e-commerce. With rates holding steady at 70.19–70.22% across all industries, this represents trillions in potential revenue left on the table annually. The primary causes are well-documented: unexpected shipping costs (48% of abandonments), complicated checkout processes, forced account creation, and payment security concerns.
Solving cart abandonment requires a multi-faceted approach: transparent pricing (including shipping costs) displayed early, guest checkout options, streamlined one-page checkout, multiple payment methods including digital wallets, and retargeting campaigns to recover abandoned carts. AI-powered recovery tools have shown significant promise, with personalized recovery emails and dynamic retargeting ads proving more effective than generic messaging.
2. Rising Customer Acquisition Costs
Average e-commerce customer acquisition costs (CAC) increased 40–60% from 2023 to 2025, now averaging $68–$84 per customer. This surge is driven by increased competition for digital advertising inventory, privacy changes (iOS 14.5, cookie deprecation), and platform algorithm changes that reduce organic reach.
The implication for digital sellers is that unit economics have become more challenging. Businesses that relied on aggressive paid acquisition must now focus on customer lifetime value (LTV), retention, and organic growth channels. The LTV:CAC ratio has become a critical metric, with healthy businesses targeting ratios of 3:1 or higher.
3. Platform Dependency and Fee Compression
Sellers on Amazon and other marketplaces face ongoing fee increases, with total fees (including fulfillment and advertising) often consuming 30–50% of revenue. This fee compression makes profitability challenging, particularly for lower-margin products. Additionally, platform policy changes can devastate businesses overnight, creating significant risk for sellers overly dependent on any single channel.
The solution is channel diversification: building direct-to-consumer (DTC) capabilities through owned websites, exploring alternative marketplaces, and investing in owned audience channels (email lists, SMS subscribers, community platforms) that reduce dependency on paid acquisition and platform algorithms.
4. International Tax and Compliance Complexity
Cross-border selling brings significant compliance burdens. VAT in Europe (with varying rates across 27 EU member states), GST in Australia and Canada, sales tax in the U.S. (with thousands of jurisdictions), and evolving digital services taxes create a compliance nightmare for sellers. Failure to comply can result in penalties, account suspensions, and reputational damage.
Merchant of Record (MoR) solutions like Fungies.io have emerged to address this challenge, handling tax registration, collection, remittance, and compliance automatically. For sellers looking to expand internationally without building massive compliance infrastructure, these solutions offer a compelling value proposition.
Opportunities and Growth Strategies
Despite the challenges, significant opportunities exist for digital sellers who execute strategically.
1. Subscription and Recurring Revenue Models
Subscription e-commerce continues to grow, with consumers increasingly comfortable with recurring payment models for everything from consumables to software to curated product boxes. The predictability of recurring revenue improves cash flow, increases customer lifetime value, and creates opportunities for deeper customer relationships.
For digital sellers, exploring subscription models—even for traditionally one-time purchase products—can unlock significant value. This might include refill subscriptions, membership programs with exclusive benefits, or access-based models for digital products.
2. B2B E-Commerce Expansion
While B2C e-commerce receives more attention, B2B digital commerce represents a massive opportunity. The B2B segment hit a revenue share of over 59.6% in 2025, and the transition of B2B purchasing to digital channels accelerated dramatically post-2020. B2B buyers now expect the same seamless digital experiences they receive as consumers, creating opportunities for sellers who can adapt B2C best practices to B2B contexts.
3. Niche Market Domination
In a crowded e-commerce landscape, niche specialization offers a path to sustainable competitive advantage. Rather than competing with Amazon on general merchandise, successful sellers are building deep expertise in specific categories, serving passionate communities with specialized products, content, and expertise that generalist platforms cannot replicate.
The data supports this strategy: niche e-commerce sites often achieve higher conversion rates (2.5–3% vs. 1.4% average) and higher customer lifetime values due to the relevance of their offerings to specific buyer segments.
Case Studies: Digital Sellers Winning in 2026
Case Study 1: Gymshark—Community-Led DTC Growth
Gymshark, the UK-based fitness apparel brand, has built a $1.3 billion business primarily through DTC e-commerce. Their strategy centered on building a community of fitness enthusiasts through influencer partnerships, social media engagement, and user-generated content. By leveraging micro-influencers and creating authentic connections with their audience, Gymshark achieved remarkable growth without relying on traditional advertising or Amazon.
Key lessons: Community building creates defensible competitive advantage; influencer marketing at scale can replace traditional advertising; DTC independence allows for margin control and customer data ownership.
Case Study 2: Allbirds—Sustainability as Differentiation
Allbirds built a $1.7 billion valuation by positioning sustainability as a core brand value. Their transparent approach to materials (merino wool, eucalyptus fiber), carbon footprint labeling, and B Corp certification resonated with environmentally conscious consumers willing to pay premium prices for products aligned with their values.
Key lessons: Authentic sustainability messaging attracts loyal customers; transparency builds trust; premium positioning is viable when backed by genuine differentiation.
Case Study 3: MVMT—Direct-to-Consumer Watch Disruption
MVMT Watches built a $100+ million business by disrupting the traditional watch industry through DTC e-commerce. By eliminating retail markups and selling directly to consumers online, they offered stylish watches at accessible price points. Their success demonstrates the power of the DTC model to disrupt established industries.
Key lessons: DTC can disrupt established industries by eliminating intermediaries; design and branding matter as much as product functionality; social proof and user-generated content drive conversion.
Future Outlook: The Digital Commerce Landscape 2026–2030
Looking ahead, several trends will shape the digital commerce landscape through 2030:
Continued Market Growth
The e-commerce market is projected to reach $7.89 trillion by 2028 and potentially $29.29 trillion by 2035. This growth will be driven by continued penetration in emerging markets, the expansion of mobile commerce, and the normalization of digital purchasing across all demographics.
AI Integration Becomes Universal
By 2030, AI will be embedded in virtually every aspect of e-commerce operations—from inventory management and pricing optimization to customer service and marketing personalization. The competitive advantage will shift from having AI to having better data and more sophisticated implementations.
Omnichannel Becomes the Default
The distinction between online and offline retail will continue to blur. Successful sellers will offer seamless experiences across physical stores, online storefronts, mobile apps, social media, and marketplaces. Inventory visibility, unified customer profiles, and consistent pricing across channels will become table stakes.
Sustainability Becomes Mandatory
Environmental and social responsibility will transition from differentiator to expectation. Sellers will need to demonstrate concrete sustainability practices, ethical sourcing, and transparent supply chains to maintain consumer trust and meet regulatory requirements.
Key Takeaways for Digital Sellers
- The market is massive and growing: With $6.88 trillion in global e-commerce sales projected for 2026, the opportunity for digital sellers has never been larger.
- Mobile is mandatory: 59% of e-commerce happens on mobile devices. Optimization for mobile experiences is non-negotiable.
- AI is essential: 97% of commerce companies have AI implementation plans. Personalization powered by AI drives 40% more revenue for leaders.
- Cross-border is the next frontier: 33.7% of e-commerce is now cross-border, representing a $1.74+ trillion opportunity for sellers willing to navigate international complexity.
- Cart abandonment is fixable: With 70% of carts abandoned, solving this single problem can double revenue for many sellers.
- Platform dependency is risky: Diversification across channels—including owned DTC websites—reduces risk and improves margins.
- Community beats advertising: Brands that build authentic communities achieve sustainable growth with lower customer acquisition costs.
Sources and Citations
- The Business Research Company – E-Commerce Global Market Report 2026: https://www.thebusinessresearchcompany.com/report/ecommerce-global-market-report
- Craftberry – Global Ecommerce Statistics 2025/2026: https://craftberry.co/articles/global-e-commerce-statistics
- eCommerceTrix – Ecommerce Statistics 2026: https://www.ecommercetrix.com/ecommerce-statistics/ecommerce-statistics
- Mobiloud – Ecommerce Market Size by Country 2026: https://www.mobiloud.com/blog/ecommerce-market-size-by-country
- Capital One Shopping – eCommerce Statistics 2026: https://capitaloneshopping.com/research/ecommerce-statistics
- Shopify – Global Ecommerce Sales Growth Report 2026: https://www.shopify.com/blog/global-ecommerce-sales
- Statista – Top Large Cap E-commerce Companies 2026: https://www.statista.com/statistics/245340/leading-large-cap-e-commerce-companies-market-cap
- Red Stag Fulfillment – Shopify Market Share Stats 2026: https://redstagfulfillment.com/shopify-market-share
- Mordor Intelligence – Digital Goods Market Report: https://www.mordorintelligence.com/industry-reports/digital-goods-market
- Precedence Research – Digital Commerce Market Size: https://www.precedenceresearch.com/digital-commerce-market
- Fortune Business Insights – Mobile Commerce Market 2026-2034: https://www.fortunebusinessinsights.com/m-commerce-market-111886
- Mordor Intelligence – M-Commerce Market Report: https://www.mordorintelligence.com/industry-reports/m-commerce-market
- Envive.ai – AI Personalization in eCommerce Statistics: https://www.envive.ai/post/ai-personalization-in-ecommerce-lift-statistics
- Precedence Research – AI in E-commerce Market: https://www.precedenceresearch.com/artificial-intelligence-in-e-commerce-market
- Amra & Elma – Cross-Border E-commerce Statistics 2026: https://www.amraandelma.com/cross-border-e-commerce-statistics
- Coherent Market Insights – Cross-Border Ecommerce Market: https://www.coherentmarketinsights.com/industry-reports/cross-border-ecommerce-market
- Digital Applied – Cart Abandonment Statistics 2026: https://www.digitalapplied.com/blog/cart-abandonment-statistics-2026-data-points
- Convertibles – Ecommerce Conversion Rate Benchmarks 2026: https://convertibles.dev/blogs/optimization/increase-ecommerce-conversion-rate
- Swell – DTC Ecommerce Statistics 2026: https://www.swell.is/content/dtc-ecommerce-statistics
- Forrester – US Retail in 2030 Forecast: https://www.forrester.com/blogs/us-retail-in-2030-e-commerce-expands-stores-still-matter
Deep Dive: E-Commerce Technology Stack Evolution
The technology infrastructure powering e-commerce has undergone radical transformation. Understanding this evolution helps digital sellers make informed platform decisions.
Headless Commerce Architecture
Headless commerce—decoupling the frontend presentation layer from the backend commerce engine—has gained significant traction. This architecture allows sellers to build custom storefronts using modern frameworks (React, Vue, Next.js) while leveraging robust commerce APIs for transactions, inventory, and customer management.
The benefits are substantial: faster page loads (critical for conversion), complete design flexibility, and the ability to sell across multiple touchpoints (web, mobile, IoT, voice) from a single backend. Platforms like Shopify Plus, BigCommerce, and commercetools have embraced headless architectures, making enterprise-grade flexibility accessible to mid-market sellers.
Composable Commerce
Taking headless a step further, composable commerce enables sellers to assemble best-of-breed solutions for each function: CMS (Contentful, Sanity), search (Algolia, Elasticsearch), personalization (Dynamic Yield, Nosto), reviews (Yotpo, Okendo), and loyalty (Smile, LoyaltyLion). Rather than relying on a single platform’s native capabilities, sellers can optimize each component.
This approach requires more technical expertise but delivers superior performance. The total cost of ownership can be higher due to multiple vendor relationships, but the flexibility to swap components as technology evolves provides long-term strategic value.
Progressive Web Apps (PWA)
PWAs combine the reach of web with the experience of native apps. They load instantly, work offline, send push notifications, and can be installed on home screens—without app store approval processes. For digital sellers, PWAs offer app-like conversion rates (3.5% vs. 2% for traditional mobile web) at a fraction of the development cost of native apps.
Major brands including Starbucks, Pinterest, and Uber have seen significant conversion improvements after launching PWAs. For smaller sellers, platforms like Shopify and BigCommerce now offer PWA capabilities out of the box or through plugins.
Payment Innovation and Consumer Preferences
Payment methods have proliferated, and offering the right mix can significantly impact conversion rates.
Digital Wallets Dominate
Digital wallets—including Apple Pay, Google Pay, PayPal, and Shop Pay—now process $10 trillion globally. They offer one-click checkout, biometric authentication, and stored payment credentials that reduce friction. Sellers offering digital wallet options see 20-30% higher mobile conversion rates compared to card-only checkout.
Buy Now, Pay Later (BNPL)
BNPL services like Klarna, Afterpay, and Affirm have exploded in popularity, particularly among younger consumers. These services allow shoppers to split purchases into interest-free installments, increasing average order values by 20-45% and reducing cart abandonment. For higher-ticket items, BNPL has become nearly mandatory.
Cryptocurrency and Alternative Payments
While still niche, cryptocurrency payments are gaining acceptance, particularly for high-value transactions and international sales where they can reduce fees and settlement times. Platforms like Shopify and BigCommerce now support crypto payments through integrations with Coinbase Commerce and BitPay.
Local payment methods—critical for cross-border success—include iDEAL in the Netherlands, Bancontact in Belgium, and PIX in Brazil. Supporting these methods can increase conversion in specific markets by 30% or more.
Logistics and Fulfillment: The New Battleground
Shipping speed and cost have become primary purchase decision factors. Amazon’s Prime program—offering free two-day (now often one-day) shipping—has reset consumer expectations.
Third-Party Logistics (3PL) Evolution
3PL providers have scaled to offer Amazon-like fulfillment capabilities to sellers of all sizes. Companies like ShipBob, Deliverr (now Shopify Logistics), and Red Stag Fulfillment offer distributed warehousing, same-day processing, and integrated returns management. For sellers, this enables competitive shipping speeds without massive capital investment.
Same-Day and Local Delivery
Same-day delivery—once a premium service—is becoming standard in urban markets. Partnerships with DoorDash, Uber, and Instacart enable sellers to offer local delivery without building their own driver networks. For food, groceries, and urgent purchases, same-day delivery has become table stakes.
Sustainable Shipping
Environmental concerns are driving demand for carbon-neutral shipping options. Major carriers now offer carbon offset programs, and packaging innovations—biodegradable materials, right-sized boxes, reusable containers—are becoming competitive differentiators. Sellers who can demonstrate sustainable fulfillment practices are capturing environmentally conscious consumers.
Marketing Strategies for Digital Sellers in 2026
Customer acquisition has become more challenging and expensive. Successful sellers are diversifying their marketing mix beyond traditional digital advertising.
Owned Audience Development
Building owned audiences—email subscribers, SMS lists, community members—reduces dependency on platform algorithms and paid acquisition. Email marketing, with conversion rates of 4.0–5.3%, remains the highest-performing channel. SMS marketing, while more intrusive, achieves 20-35% open rates and 5-15% click-through rates.
Community building—through Facebook Groups, Discord servers, or branded forums—creates engaged audiences that generate organic referrals and user-generated content. Brands like Glossier and Peloton have built billion-dollar businesses on community-first strategies.
Influencer and Creator Partnerships
Influencer marketing has matured beyond celebrity endorsements to long-term creator partnerships. Micro-influencers (10k–100k followers) often deliver higher engagement and conversion rates than mega-influencers at lower costs. The key is authentic alignment between creator and brand—audiences can detect inauthentic partnerships instantly.
Content Marketing and SEO
Organic search remains a critical acquisition channel, with SEO-driven traffic converting at 2.5–3%—higher than most paid channels. Content strategies that address customer pain points, answer questions, and provide genuine value build long-term organic visibility. Video content, in particular, is increasingly important as Google prioritizes video results and YouTube becomes the second-largest search engine.
Regulatory Landscape and Compliance
The regulatory environment for e-commerce is becoming more complex, with implications for sellers of all sizes.
Data Privacy Regulations
GDPR in Europe, CCPA in California, and emerging privacy laws globally require explicit consent for data collection, transparent privacy policies, and the ability for consumers to request data deletion. Non-compliance can result in fines of 4% of global revenue (GDPR) or $7,500 per violation (CCPA).
Consumer Protection Requirements
E-commerce sellers must comply with consumer protection regulations including clear return policies, accurate product descriptions, and prohibition of deceptive pricing practices. The FTC and equivalent bodies globally are increasing enforcement against misleading marketing and fake reviews.
Tax Compliance Automation
The complexity of international tax compliance has created opportunities for automated solutions. Economic nexus laws in the U.S. require sales tax collection in states where sellers exceed revenue or transaction thresholds. In Europe, VAT OSS (One-Stop Shop) simplifies compliance but still requires accurate calculation and remittance. Solutions like Avalara, TaxJar, and Merchant of Record platforms automate these complexities.
Conclusion: Thriving as a Digital Seller in 2026
The digital commerce landscape of 2026 offers unprecedented opportunity alongside significant complexity. Success requires a strategic approach that balances growth with sustainability, automation with human connection, and platform leverage with independence.
The sellers who will thrive are those who:
- Invest in mobile-first experiences that convert
- Leverage AI for personalization at scale
- Build diversified channel strategies that reduce platform dependency
- Develop owned audiences that reduce acquisition costs
- Embrace cross-border opportunities with proper compliance infrastructure
- Prioritize customer experience from discovery through post-purchase
- Stay agile as technology and consumer preferences evolve
The $6.88 trillion e-commerce market of 2026 rewards sellers who combine data-driven decision making with genuine customer empathy. The tools, platforms, and infrastructure exist to build world-class digital commerce operations at any scale. The question is not whether the opportunity exists—it’s whether you’re prepared to seize it.