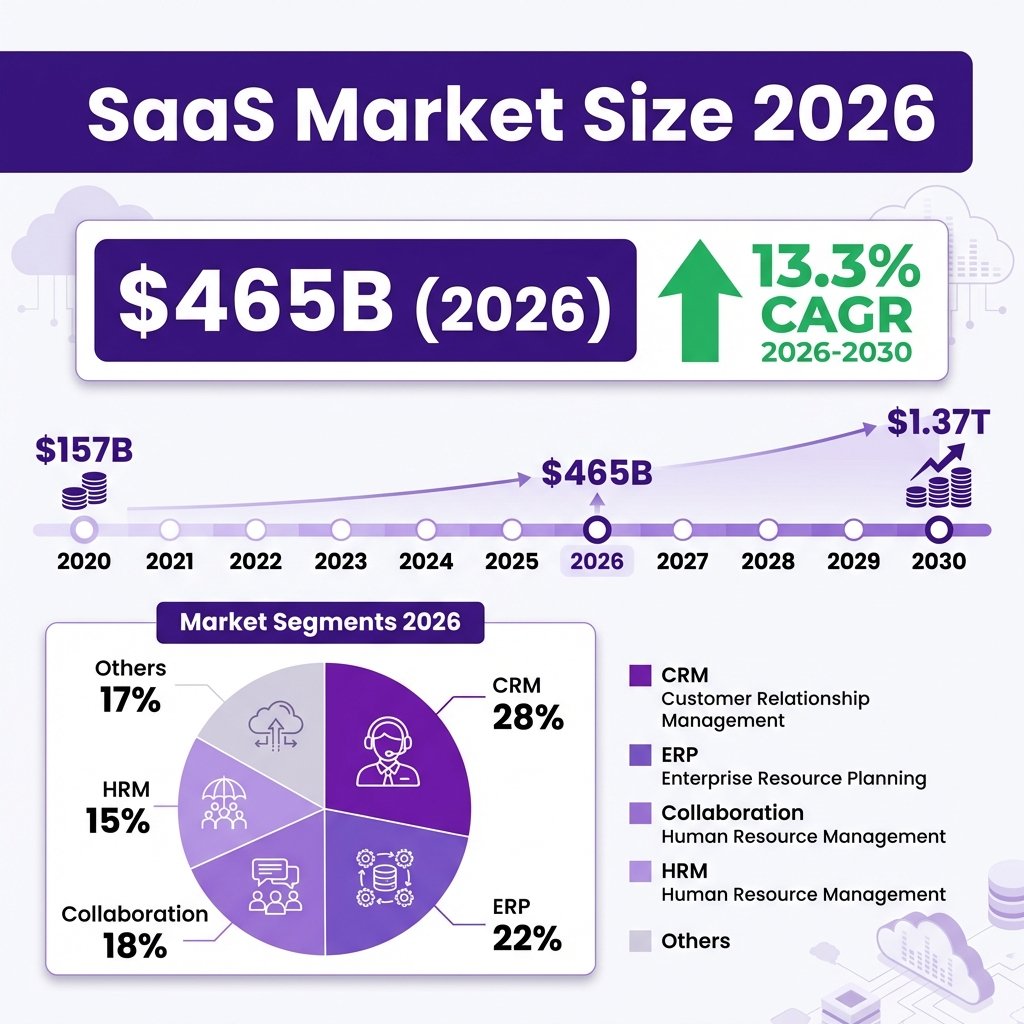
The global Software as a Service (SaaS) market has reached an unprecedented inflection point in 2026. With the market valued at $465.03 billion according to Precedence Research, and projected to surge past $1.37 trillion by 2035, SaaS has evolved from a convenient alternative to on-premise software into the dominant paradigm for enterprise technology delivery. This comprehensive analysis draws on data from Gartner, Grand View Research, Fortune Business Insights, and leading SaaS analytics firms to provide you with the most complete picture of where the industry stands today and where it is headed.
What makes 2026 particularly significant is the convergence of multiple transformative forces: artificial intelligence integration reaching mainstream adoption, vertical SaaS solutions displacing generic platforms, and usage-based pricing models reshaping customer relationships. The statistics tell a compelling story—99% of organizations now use at least one SaaS application, enterprises average 305 SaaS tools in their portfolios, and AI-native SaaS companies are growing at double the rate of traditional providers.

Market Overview: The $465 Billion SaaS Ecosystem
The SaaS market’s growth trajectory has been nothing short of extraordinary. According to Grand View Research, the global SaaS market size was estimated at $399.10 billion in 2024 and is projected to reach $819.23 billion by 2030, growing at a compound annual growth rate (CAGR) of 12.0%. However, other research firms paint an even more aggressive picture—Precedence Research places the 2026 market at $465.03 billion with a projected CAGR of 12.85% through 2034, while Fortune Business Insights forecasts the market reaching $1.48 trillion by 2032 at an 18.7% CAGR.
The variation in these figures stems from methodological differences in defining SaaS scope. Precedence Research employs a broader definition that encompasses cloud-delivered application services, while Fortune Business Insights maintains a tighter SaaS-specific categorization. Regardless of the specific metric used, the directional trend is unambiguous: SaaS is experiencing sustained, robust expansion that shows no signs of deceleration.
Historical context illuminates the magnitude of this transformation. The SaaS market has grown from approximately $157 billion in 2020 to over $400 billion in 2025—representing a nearly threefold increase in just five years. This growth has consistently outpaced overall IT spending, with SaaS capturing an increasing share of enterprise technology budgets. In 2020, SaaS accounted for approximately 55% of total software spending; by 2026, that figure has climbed to 70% and is projected to reach 85% before the decade’s end.
The COVID-19 pandemic served as an unexpected accelerant for SaaS adoption, compressing what might have been a decade of digital transformation into approximately 18 months. Remote work requirements drove massive investments in collaboration tools, video conferencing platforms, and cloud-based productivity suites. While the initial surge has moderated, the structural shift toward distributed workforces has permanently elevated SaaS demand. Organizations that might have hesitated to embrace cloud solutions were compelled by necessity—and having made the transition, few have shown interest in reverting to on-premise alternatives.
Looking ahead, the market’s growth will be driven by several interconnected factors. The proliferation of AI-powered features is creating new categories of intelligent SaaS applications that command premium pricing. Vertical SaaS solutions tailored to specific industries are capturing market share from horizontal platforms by offering superior functionality for specialized use cases. The expansion of SaaS into emerging markets, particularly in Asia-Pacific and Latin America, is opening vast new customer bases. And the continued maturation of SaaS ecosystems, with improved integration capabilities and API-driven architectures, is making cloud-native solutions increasingly indispensable for business operations.
Key Statistics and Data: The Numbers Defining SaaS in 2026
The SaaS landscape in 2026 is characterized by remarkable scale, rapid growth, and significant inefficiencies that represent both challenges and opportunities. Understanding these statistics is essential for anyone operating in or evaluating the SaaS ecosystem—whether as a vendor, investor, or enterprise customer.
Market Size and Growth Metrics
The global SaaS market reached $408.21 billion in 2025 according to Precedence Research, with 2026 projections ranging from $465 billion to $500 billion depending on the research firm. The market is expanding at a compound annual growth rate of 12-18%, with most analysts converging on a 13-14% figure for the medium term. This growth significantly outpaces overall IT spending, which Gartner forecasts at $6.15 trillion for 2026—a 10.8% increase over 2025.
Software has emerged as the fastest-growing category within IT spending, with Gartner projecting 14.7% year-over-year growth for 2026. This acceleration reflects the ongoing shift from capital-intensive on-premise software deployments to subscription-based cloud models. The transition is particularly pronounced in enterprise segments, where the complexity and cost of maintaining on-premise infrastructure increasingly favor SaaS alternatives.
Adoption and Penetration Statistics
Universal adoption has become a reality in the SaaS market. 99% of organizations now use at least one SaaS application, according to research from Productiv and Zylo. This figure represents effectively complete market penetration among businesses of any significant size. The more relevant metric has shifted from whether organizations use SaaS to how extensively they rely on it—and here the numbers are striking.
The average company now manages 305 SaaS applications, according to Zylo’s 2026 SaaS Management Index. Large enterprises with 10,000+ employees average 473 SaaS applications, while even mid-market companies typically operate 130+ tools. This application proliferation has created significant management challenges, with organizations struggling to maintain visibility into their SaaS portfolios and control associated costs.
Per-employee SaaS spending has reached $4,830 annually on average, with enterprises spending an average of $4.2 million per year on SaaS subscriptions. Total enterprise SaaS spending reached $52 million annually in 2025 for large organizations, up from $45 million in 2024. These figures underscore how deeply SaaS has become embedded in business operations—and how significant the associated costs have become.
Efficiency and Waste Metrics
The rapid expansion of SaaS adoption has created substantial inefficiencies. 44% of SaaS licenses go unused, representing approximately $18 billion in annual waste across the industry. The average enterprise loses roughly $18 million per year on licenses that nobody touches—a figure that has remained stubbornly high despite increasing awareness of the problem.
Shadow IT continues to compound these challenges, with 56% of SaaS purchases happening outside official IT channels. This phenomenon reflects the ease with which business units can procure SaaS tools independently, often using corporate credit cards or expense reimbursement processes that bypass traditional procurement controls. While this democratization of technology access has benefits for agility and innovation, it creates significant governance and security risks.
Application consolidation has emerged as a response to these challenges, with average SaaS application counts declining slightly from 112 in 2023 to 106 in 2024—though this consolidation rate has slowed from 14% year-over-year to just 5%. Organizations are discovering that rationalizing their SaaS portfolios is more complex than anticipated, with overlapping functionality, entrenched user preferences, and integration dependencies creating friction.
Business Model and Pricing Statistics
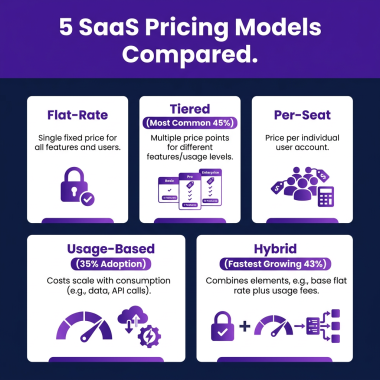
The SaaS pricing landscape is undergoing significant transformation. Usage-based pricing adoption has reached 61%, up from just 34% in 2022, according to OpenView Partners. Companies employing usage-based models are growing 38% faster than those using traditional seat-based pricing, reflecting customer preferences for consumption-aligned costs.
Despite this shift, seat-based pricing remains the most common model at 45% of companies. Freemium conversion rates average 2-5%, while free trial conversions range from 15-25%. Enterprise annual contract values (ACV) typically fall between $50,000-$100,000, though this varies significantly by category and company size.
Product-led growth (PLG) companies demonstrate superior efficiency metrics, with 30% lower customer acquisition costs (CAC) than sales-led organizations. This advantage has driven widespread adoption of PLG strategies, particularly among companies targeting developers, designers, and other technical users who prefer self-service evaluation and adoption.
Financial Performance Benchmarks
SaaS financial benchmarks reveal the characteristics of high-performing companies. The median annual revenue growth rate for SaaS companies in 2026 is 26%, down from 47% in 2024—reflecting market maturation and increased focus on sustainable growth over pure expansion. Growth expectations vary by company size: startups under $1M ARR often achieve 100%+ growth, while companies over $50M ARR typically target 20-30% annually.
Net Revenue Retention (NRR) has emerged as a critical metric, with top performers achieving 120%+ NRR—driving 2.3x higher valuations than companies with lower retention rates. The median NRR for public SaaS companies is 110%, while top quartile companies exceed 120%. Expansion revenue now accounts for approximately 40% of total new ARR for the median SaaS company, rising to over 50% for companies exceeding $50M ARR.
The Rule of 40—which combines growth rate and profit margin—remains a key valuation benchmark. Companies scoring above 60% on the Rule of 40 see 2-3x higher valuations, while only 25% of SaaS companies achieve the Rule of 40 threshold. Gross margins for SaaS businesses typically range from 72-78%, reflecting the inherent scalability of software delivery models.
Major Trends Shaping SaaS in 2026
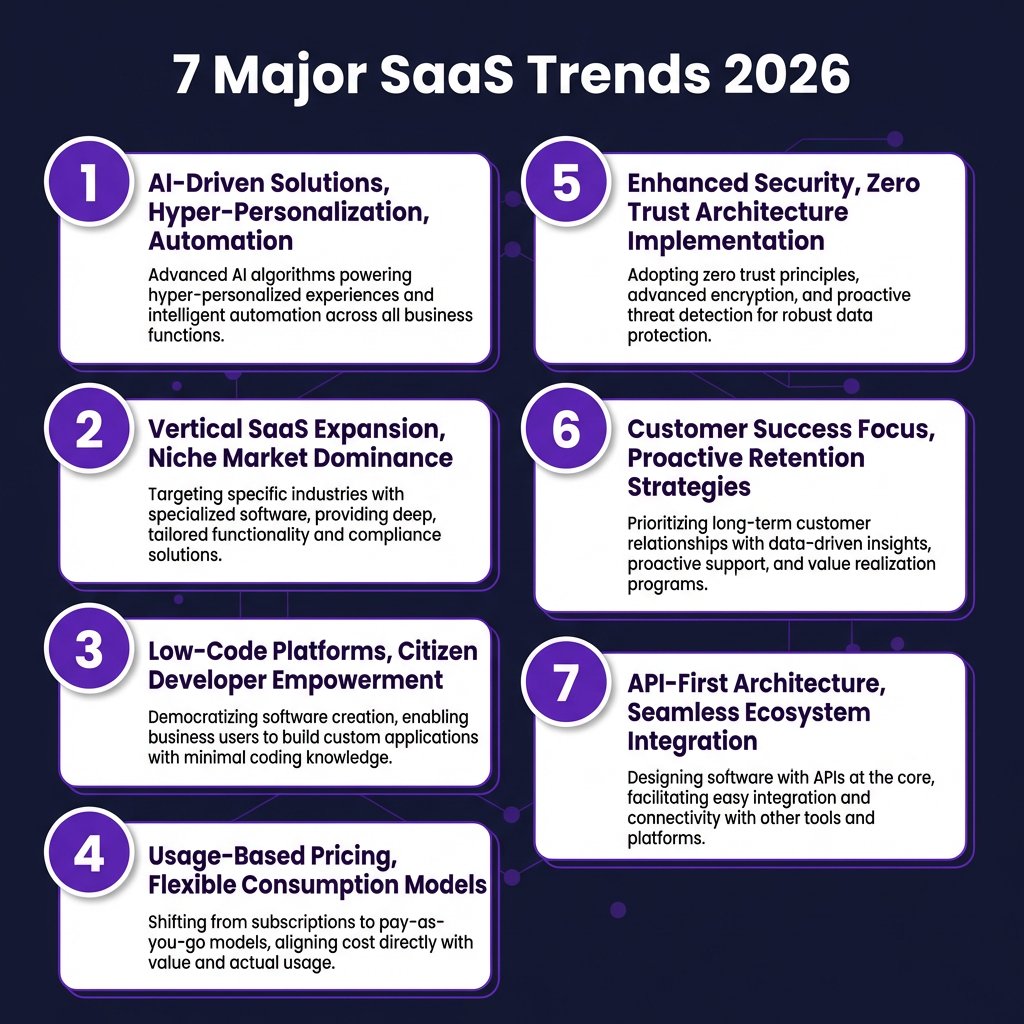
The SaaS industry in 2026 is being reshaped by seven major trends that are fundamentally altering how software is built, sold, and consumed. Understanding these trends is essential for predicting where the market is headed and identifying opportunities for competitive advantage.
1. AI-Driven SaaS Solutions
Artificial intelligence has transitioned from experimental feature to foundational capability across the SaaS landscape. 75% of SaaS companies have shipped AI features, according to Sapphire Ventures, and AI-native SaaS startups captured 35% of total SaaS funding in 2024-2025. The AI SaaS market is projected to reach $68 billion in 2026, growing at a 40%+ CAGR—triple the growth rate of traditional SaaS.
AI integration is taking multiple forms. Predictive analytics capabilities enable SaaS platforms to anticipate user needs and automate decision-making. Natural Language Processing (NLP) powers conversational interfaces that make complex software accessible to non-technical users. Machine learning algorithms optimize everything from resource allocation to pricing recommendations. And generative AI is automating content creation, code generation, and creative workflows.
The business impact is substantial. AI features command a 20-30% pricing premium, according to McKinsey research. Companies report 40-70% efficiency gains in specific operational verticals where AI is properly implemented. And 92% of SaaS companies plan to increase AI R&D investment in 2026, according to Salesforce research.
Gartner predicts that more than 80% of companies will have AI-enabled applications deployed by the end of 2026—up from just 5% in 2023. This rapid adoption is driven by competitive necessity: customers increasingly expect intelligent features as standard, and SaaS vendors that fail to deliver risk obsolescence.
2. Vertical SaaS Expansion
Vertical SaaS—solutions tailored to specific industries rather than horizontal use cases—is outpacing general-purpose platforms. Vertical SaaS companies are growing at 31% annually compared to 28% for horizontal SaaS, with the gap widening to 24% versus 16% across the broader market. The vertical SaaS market has reached $100+ billion and is growing at 20%+ CAGR.
This trend reflects the limitations of one-size-fits-all software. Industry-specific solutions can embed regulatory compliance requirements, specialized workflows, and domain-specific analytics that horizontal platforms cannot match. Healthcare SaaS ($28B market), FinTech SaaS (23% CAGR), Legal Tech ($12B, 20%+ growth), and EdTech ($18B) represent major vertical opportunities.
The verticalization trend extends beyond industry to function. Specialized solutions for specific business processes—revenue operations, customer success, developer experience—are capturing market share from broader platforms by delivering superior depth in their focus areas. This specialization enables vendors to command premium pricing while delivering demonstrably better outcomes.
3. Low-Code and No-Code Platforms
Low-code and no-code platforms are democratizing software development, enabling non-technical users to build applications without traditional programming skills. These platforms are accelerating project delivery, reducing IT backlogs, and empowering business users to solve their own problems without waiting for developer resources.
The business implications are profound. Organizations can prototype new tools quickly, experiment with workflows, and respond to market changes more rapidly. The platforms are becoming central to enterprise software strategy, enabling a wider range of employees—from operations managers to marketing specialists—to contribute to digital transformation initiatives.
Established SaaS vendors are responding by embedding low-code capabilities into their platforms, allowing customers to customize and extend functionality without leaving the ecosystem. This convergence of packaged software and custom development is blurring traditional category boundaries and creating new competitive dynamics.
4. Usage-Based Pricing Models
The shift toward usage-based pricing represents a fundamental rethinking of customer relationships. Rather than charging fixed fees regardless of value received, usage-based models align vendor revenue with customer success. This alignment creates powerful incentives for vendors to drive adoption and deliver outcomes.
Adoption has accelerated dramatically: 61% of SaaS companies now offer usage-based options, up from 34% in 2022. Companies employing these models are growing 38% faster than peers, with lower churn and higher net revenue retention. The model is particularly effective for infrastructure services, API-based products, and platforms where usage correlates directly with business value.
However, implementation challenges remain. Customers can struggle to predict and budget for variable costs. Vendors must invest in sophisticated metering and billing infrastructure. And sales compensation structures require redesign to align with non-linear revenue patterns. Despite these challenges, the trend toward usage-based pricing appears irreversible.
5. Enhanced Security and Compliance
Security has become a primary concern as SaaS platforms become central to business operations. 55% of organizations experienced a SaaS security incident in the past two years, according to AppOmni. Misconfigurations cause 43% of cloud security incidents, and the average SaaS breach costs $4.45 million according to IBM research.
Regulatory compliance requirements are intensifying across jurisdictions. GDPR in Europe, CCPA in California, and emerging AI regulations are creating complex compliance landscapes that SaaS vendors must navigate. Customers increasingly demand SOC 2 Type II certification, ISO 27001 compliance, and industry-specific certifications as table stakes for vendor evaluation.
SaaS security spending is growing 25% annually as organizations invest in CASB (Cloud Access Security Broker) solutions, SaaS Security Posture Management (SSPM) tools, and zero-trust architectures. Vendors that can demonstrate robust security capabilities and compliance certifications gain significant competitive advantage in enterprise sales cycles.
6. Customer Success as Strategic Function
Customer success has evolved from support function to strategic pillar. Leading SaaS companies now view customer success as a revenue center rather than a cost center, investing proactively in ensuring users achieve their desired outcomes with the product.
This shift reflects the economics of SaaS business models. With customer acquisition costs averaging $1,200 for B2B SaaS and payback periods of 15-18 months, retention and expansion are critical to profitability. Companies that prioritize customer success experience lower churn rates, stronger retention, and higher lifetime customer value.
Modern customer success programs include personalized onboarding, tailored training resources, ongoing engagement through regular check-ins, and proactive intervention when usage patterns suggest disengagement. Analytics and AI focused on user behavior enable customer success teams to anticipate needs and address potential pain points before they drive churn.
7. API-First and Ecosystem Strategies
API-first architectures are becoming the default for SaaS development, enabling seamless integration with other tools and supporting ecosystem strategies that extend platform value. Rather than attempting to build all functionality internally, leading SaaS vendors are creating platforms that enable third-party developers to extend capabilities and address specialized use cases.
This ecosystem approach creates powerful network effects. As more integrations become available, the platform becomes more valuable to users, attracting more developers, who create more integrations—a virtuous cycle that builds sustainable competitive advantage. Salesforce’s AppExchange, Slack’s app directory, and Shopify’s app store represent successful implementations of this strategy.
The API economy is creating new business models, with some SaaS companies generating significant revenue from API usage alone. Infrastructure-as-a-Service providers, payment platforms, and communication services have particularly strong API monetization opportunities.
Key Players and Competitive Landscape
The SaaS market is characterized by significant concentration among leading players, with the top 10 vendors accounting for approximately 35% of total market revenue. Understanding the competitive landscape is essential for identifying partnership opportunities, competitive threats, and market positioning strategies.
Market Leaders by Revenue
Microsoft leads the SaaS market with $245.1 billion in total revenue for FY2025, with its cloud segment growing 16% year-over-year. Microsoft’s dominance spans productivity (Microsoft 365), collaboration (Teams), cloud infrastructure (Azure), and business applications (Dynamics 365). The company’s strategic investments in AI—particularly Copilot integration across its product suite—are reinforcing its market position and driving premium pricing.
Salesforce remains the CRM category leader with $37.9 billion in FY2025 revenue, representing 11% year-over-year growth. The company derives 93%+ of revenue from subscriptions and has successfully expanded beyond sales automation into service, marketing, commerce, and analytics. Salesforce’s Agentforce platform for autonomous AI agents represents a significant bet on the future of AI-powered business automation.
Adobe generated $21.5 billion in FY2024 revenue, with 93% coming from subscriptions. The company’s Creative Cloud and Document Cloud products dominate their respective categories, while the Experience Cloud provides marketing automation and analytics capabilities. Adobe’s AI investments, including Firefly for generative content creation, are driving product innovation and pricing power.
SAP reported €26.7 billion in cloud revenue through the first nine months of 2025, with cloud services accounting for 77%+ of total revenue and growing 25% year-over-year. The company’s current cloud backlog reached €15.7 billion by Q3 2025, indicating strong future revenue visibility. SAP’s strength in ERP and supply chain management positions it well for enterprise digital transformation initiatives.
Oracle posted $53 billion in total revenue with cloud services representing the majority of growth. The company’s database and enterprise application franchises are successfully transitioning to cloud delivery models, with Oracle Cloud Infrastructure gaining traction as a viable alternative to AWS and Azure for enterprise workloads.
Other significant players include ServiceNow ($10.5B), Shopify ($8.9B), Workday ($7.7B), Atlassian ($4.8B), and Datadog ($2.7B, +26%). These companies demonstrate that significant scale can be achieved through focus on specific categories and consistent execution.
Regional Market Distribution
North America dominates the global SaaS market, accounting for 46.9% of global revenue according to Grand View Research. The United States alone hosts approximately 17,000 SaaS companies and is projected to generate $141.06 billion in SaaS revenue in 2026. The region’s dominance reflects its mature technology ecosystem, venture capital availability, and early adoption of cloud computing.
Europe holds approximately 25% of the global market, with Germany’s SaaS market expected to reach €16.3 billion in 2025. The region’s regulatory environment—particularly GDPR—has created both challenges and opportunities for SaaS vendors. European companies often lead in privacy-preserving technologies and compliance automation.
Asia-Pacific represents the fastest-growing region, with India’s SaaS companies growing at a 24% compound annual rate since FY19. The country now has 250 companies with $10 million or more in annual recurring revenue. Private equity investment in Indian SaaS hit $1.38 billion in the first seven months of 2025, up sharply from $833 million across all of 2024. China’s SaaS market is substantial but faces unique regulatory and competitive dynamics.
Latin America and Middle East/Africa represent emerging opportunities, with growing technology adoption and increasing cloud infrastructure investment. These regions are attracting attention from global SaaS vendors seeking growth beyond saturated developed markets.
Competitive Dynamics
The SaaS competitive landscape is characterized by several key dynamics. Platform consolidation is occurring as customers seek to reduce vendor sprawl and integration complexity. Large vendors are acquiring specialized solutions to round out their portfolios, while point solutions face increasing pressure to demonstrate unique value or risk displacement.
AI capabilities are becoming a key differentiator, with vendors competing to deliver the most useful and integrated intelligent features. This competition is driving rapid innovation but also raising the bar for what constitutes table stakes functionality.
Vertical specialization is creating opportunities for focused vendors to compete effectively against larger horizontal platforms within specific industries. These specialists can deliver superior functionality and domain expertise that generalists struggle to match.

Challenges and Pain Points
Despite its remarkable growth, the SaaS industry faces significant challenges that vendors and customers must navigate. Understanding these pain points is essential for developing effective strategies and identifying opportunities for innovation.
1. Cost Management and Budget Volatility
SaaS cost volatility has replaced predictable growth as a defining challenge for enterprise customers. 61% of organizations were forced to cut projects or initiatives due to unplanned SaaS cost increases, according to Zylo’s 2026 SaaS Management Index. Despite flat application portfolios, total SaaS spend increased 8% year-over-year—driven by pricing increases, AI feature premiums, and usage-based overages.
The shift to usage-based pricing, while beneficial for alignment, creates budgeting challenges. Organizations struggle to predict costs when they depend on variable usage patterns. Price increases from major vendors—averaging 8-12% in 2024-2025—compound these challenges, with AI feature additions often driving additional 20-30% cost increases.
License waste represents a significant opportunity for improvement. With 44% of licenses unused and average enterprises losing $18 million annually on untouched subscriptions, better license management could deliver substantial cost savings. However, achieving these savings requires visibility and governance capabilities that many organizations lack.
2. Integration Complexity
The average enterprise operates 305 SaaS applications, creating significant integration challenges. Data silos emerge when applications cannot communicate effectively, undermining the value of digital transformation investments. Workflow fragmentation occurs when users must navigate between multiple tools to complete tasks.
Integration platform-as-a-service (iPaaS) solutions have emerged to address these challenges, but they add cost and complexity. Custom integrations require development resources that may be scarce. And maintaining integrations as APIs evolve creates ongoing maintenance burdens.
The API-first trend is helping address integration challenges by standardizing how applications expose functionality. However, significant work remains to achieve seamless interoperability across the SaaS ecosystem.
3. Security and Compliance Risks
SaaS security incidents are increasingly common, with 55% of organizations experiencing an incident in the past two years. The distributed nature of SaaS adoption—56% of purchases happening outside IT—creates visibility gaps that attackers can exploit. Misconfigurations, rather than sophisticated attacks, cause the majority of incidents.
Compliance requirements are intensifying across multiple dimensions. Data residency requirements mandate that certain data remain within specific geographic boundaries. Industry regulations—HIPAA for healthcare, PCI-DSS for payments, SOX for public companies—impose specific controls that SaaS vendors must support. And emerging AI regulations are creating new compliance obligations around algorithmic transparency and bias.
Only 28% of organizations have a dedicated SaaS security team, indicating that many are under-resourced for the challenges they face. As SaaS platforms become more central to business operations, security and compliance capabilities will increasingly drive vendor selection decisions.
Opportunities and Growth Strategies
The challenges facing the SaaS industry simultaneously represent opportunities for vendors that can address them effectively. Several growth strategies are proving particularly effective in the current market environment.
1. AI-Native Product Development
AI-native SaaS companies are growing at double the rate of traditional providers, capturing premium valuations and market share. The opportunity extends beyond adding AI features to existing products to reimagining entire categories around AI capabilities. Companies that can deliver genuine productivity improvements through AI—rather than superficial feature additions—are winning in the market.
Successful AI strategies focus on specific, high-value use cases where AI can deliver measurable outcomes. Code generation, content creation, customer service automation, and predictive analytics represent particularly fertile ground. The key is delivering capabilities that are both powerful and accessible to non-technical users.
2. Vertical Market Specialization
Vertical SaaS expansion offers a proven path to growth with superior unit economics. By focusing on specific industries, vendors can deliver superior functionality, command premium pricing, and build deep moats through domain expertise. The healthcare, financial services, legal, and construction verticals all represent multi-billion dollar opportunities.
Success in vertical SaaS requires genuine industry expertise—not just repackaging horizontal functionality with industry branding. Vendors must understand regulatory requirements, workflow nuances, and integration needs specific to their target vertical. Those that achieve this depth can build highly defensible market positions.
3. International Expansion
Geographic expansion represents a significant growth opportunity, particularly into Asia-Pacific and emerging markets. These regions combine rapid technology adoption with less saturated competitive landscapes. However, successful expansion requires more than translation—it demands localization of functionality, compliance with regional regulations, and adaptation to local business practices.
India’s SaaS ecosystem demonstrates the potential, with 250 companies achieving $10M+ ARR and private equity investment exceeding $1.38 billion in just seven months of 2025. Similar opportunities exist across Southeast Asia, Latin America, and Africa as digital
transformation accelerates.
Case Studies and Success Stories
Real-world examples illuminate how leading SaaS companies are navigating the current landscape and achieving exceptional results. These case studies demonstrate effective strategies for growth, efficiency, and market positioning.
TestGorilla: Efficient Growth Through Marketing Innovation
TestGorilla, an HR tech platform specializing in skills-based hiring assessments, achieved remarkable efficiency metrics in 2026. The company reached an 80-day CAC payback period while scaling to over 5,000 customers—a performance that helped secure a $70 million Series A funding round.
The company’s strategy focused on competitor-focused campaigns and optimized landing pages that clearly communicated value propositions. By targeting high-intent keywords and delivering compelling comparison content, TestGorilla was able to acquire customers at significantly lower costs than industry averages. The 80-day payback period compares favorably to the B2B SaaS median of 15-18 months, demonstrating the power of efficient go-to-market execution.
TestGorilla’s success illustrates several principles applicable to other SaaS companies: the importance of clear positioning against alternatives, the value of optimized conversion funnels, and the competitive advantage of efficient customer acquisition. For companies seeking to improve their own metrics, TestGorilla’s approach offers a replicable model.
Microsoft: AI Integration Driving Premium Positioning
Microsoft’s FY2025 results demonstrate how AI investments can reinforce market leadership and drive pricing power. The company generated $245.1 billion in total revenue, with its cloud segment growing 16% year-over-year. The integration of Copilot AI capabilities across the Microsoft 365 suite has enabled premium pricing while increasing customer stickiness.
Microsoft’s strategy of embedding AI throughout its product portfolio—rather than offering it as a separate add-on—has created a comprehensive value proposition that competitors struggle to match. The company’s ability to leverage its existing distribution channels and customer relationships has accelerated AI adoption across its user base.
The financial results validate this approach: customers are willing to pay premium prices for AI-enhanced productivity, and the incremental revenue more than justifies the substantial R&D investments required. For other SaaS vendors, Microsoft’s example suggests that AI integration should be comprehensive rather than peripheral.
Indian SaaS Ecosystem: Emerging Market Success
India’s SaaS ecosystem represents one of the most dynamic growth stories in the industry. With 250 companies achieving $10 million or more in ARR and private equity investment of $1.38 billion in the first seven months of 2025, the region demonstrates the potential of emerging market expansion.
Indian SaaS companies have grown at a 24% compound annual rate since FY19, outpacing global averages. These companies often focus on serving global markets from India, leveraging lower cost structures to compete effectively on price while maintaining quality. The success of companies like Zoho, Freshworks, and Postman has created a template that others are following.
The Indian example illustrates how geographic diversification can create significant value. For SaaS vendors seeking growth beyond saturated developed markets, emerging ecosystems offer opportunities for expansion with favorable competitive dynamics.
Future Outlook and Predictions: 2026-2030
The SaaS industry stands at the threshold of its next major evolution. Based on current trajectories and emerging trends, several predictions can be made about how the market will develop through 2030.
Market Size Projections
By 2030, the global SaaS market is projected to reach $819-908 billion depending on the research firm, with Fortune Business Insights forecasting $908 billion at an 18.7% CAGR. The market will cross the $1 trillion threshold between 2030 and 2032, with Precedence Research projecting $1.37 trillion by 2035.
These projections assume continued digital transformation across industries, sustained AI investment, and the expansion of SaaS into new use cases and geographies. While economic downturns could temporarily slow growth, the structural shift toward cloud delivery appears irreversible.
AI Transformation Acceleration
By 2028, AI capabilities will be considered table stakes for SaaS products across all major categories. Vendors without meaningful AI features will face significant competitive disadvantage, while those with superior AI implementations will capture disproportionate market share. The AI SaaS market will exceed $200 billion by 2030, representing a significant portion of total SaaS revenue.
Agentic AI—autonomous systems that can execute complex workflows without human intervention—will emerge as a major category. Salesforce’s Agentforce platform represents an early entry in this space, but significant innovation remains ahead. Companies that can deliver reliable, trustworthy autonomous agents will create entirely new software categories.
Industry Consolidation
The SaaS market will experience significant consolidation as customers seek to reduce vendor complexity and larger players acquire specialized capabilities. The top 10 vendors’ market share will increase from 35% to 45% by 2030. Point solutions that fail to achieve category leadership or differentiate clearly will face acquisition or obsolescence.
This consolidation will create opportunities for vendors that can deliver comprehensive platforms addressing multiple related use cases. Companies that can successfully expand from single products to integrated suites will capture disproportionate value.
Regulatory Evolution
AI regulation will reshape SaaS development and deployment practices. Requirements for algorithmic transparency, bias auditing, and human oversight will become standard in regulated industries. Vendors that proactively address these requirements will gain competitive advantage in enterprise sales cycles.
Data residency requirements will intensify, requiring vendors to maintain infrastructure in an expanding set of jurisdictions. This will favor larger vendors with resources for geographic expansion while creating challenges for smaller players.
Key Takeaways
- The global SaaS market reached $465 billion in 2026 and is projected to exceed $1.37 trillion by 2035, growing at a 12-18% CAGR.
- AI integration has become foundational, with 75% of SaaS companies shipping AI features and AI-native companies growing at double the rate of traditional providers.
- Vertical SaaS is outpacing horizontal solutions, with industry-specific platforms growing 31% annually versus 28% for general-purpose software.
- Usage-based pricing adoption has reached 61%, with companies employing these models growing 38% faster than peers.
- Significant inefficiencies persist, with 44% of SaaS licenses unused and $18 billion in annual waste across the industry.
- Security and compliance have become primary concerns, with 55% of organizations experiencing SaaS security incidents in the past two years.
- North America dominates with 46.9% of global revenue, but Asia-Pacific represents the fastest-growing region with India’s SaaS ecosystem leading expansion.
- Microsoft, Salesforce, Adobe, SAP, and Oracle lead the market, with the top 10 vendors accounting for 35% of total revenue.
Sources and Citations
- Precedence Research – SaaS Market Size and Forecast 2025-2034: https://www.precedenceresearch.com/software-as-a-service-market
- Grand View Research – Software as a Service Market Report: https://www.grandviewresearch.com/industry-analysis/saas-market-report
- Fortune Business Insights – SaaS Market Size, Share & Industry Analysis: https://www.fortunebusinessinsights.com/software-as-a-service-saas-market-102222
- Gartner – Worldwide IT Spending Forecast: https://www.gartner.com/en/newsroom/press-releases/2025-10-22-gartner-forecasts-worldwide-it-spending-to-grow-9-point-8-percent-in-2026
- Zylo – 2026 SaaS Management Index: https://zylo.com/reports/2026-saas-management-index/
- Quantumrun – SaaS Industry Growth Statistics 2026: https://www.quantumrun.com/consulting/saas-industry-growth-statistics/
- Colorlib – 130+ SaaS Statistics: https://colorlib.com/wp/saas-statistics/
- Phoenix Strategy Group – Benchmarking SaaS KPIs 2026: https://www.phoenixstrategy.group/blog/benchmarking-saas-kpis-industry-standards-2026
- Geekflare – Top 41 SaaS Companies 2026: https://geekflare.com/guide/top-saas-companies/
- Innovecs – Top 7 SaaS Trends Shaping Business in 2026: https://innovecs.com/blog/the-top-7-saas-trends/
- OpenView Partners – SaaS Benchmarks: https://openviewpartners.com/saas-benchmarks/
- SaaS Capital – B2B SaaS Retention Benchmarks: https://www.saas-capital.com/
- AppOmni – SaaS Security Statistics: https://appomni.com/
- IBM – Cost of a Data Breach Report: https://www.ibm.com/reports/data-breach
SaaS Funding and Investment Landscape
The funding environment for SaaS companies has evolved significantly, with investors becoming more selective while still backing high-quality opportunities. Understanding the current investment landscape is essential for founders seeking capital and for tracking industry health.
Venture Capital Trends
Global SaaS VC investment reached $45 billion in 2024, down from a peak of $90 billion but still representing substantial capital availability. The decline reflects broader market conditions and increased investor discipline rather than diminished opportunity. Median seed rounds now average $3.5 million, while Series A rounds fall in the $12-15 million range.
AI-native SaaS companies are capturing disproportionate funding, with 35% of total SaaS investment flowing to companies building AI-first products. This concentration reflects investor conviction that AI represents a transformative platform shift comparable to cloud or mobile. Companies that can demonstrate clear AI differentiation and measurable customer value are commanding premium valuations.
Private Equity Activity
Private equity has emerged as a major force in SaaS M&A, with $85+ billion in PE acquisitions during 2024 according to Bain research. PE firms are attracted to SaaS businesses for their predictable recurring revenue, high gross margins, and expansion potential. The median acquisition multiple has moderated to 7-8x ARR, down from 12x at the market peak, creating more attractive entry points.
PE investment in Indian SaaS reached $1.38 billion in just seven months of 2025, demonstrating the geographic expansion of buyout activity. As developed markets become more competitive, emerging ecosystems are attracting increasing attention from global investors seeking growth opportunities.
Public Market Performance
The median time to IPO for SaaS companies now stands at 10.5 years, reflecting the extended private market funding environment and increased scrutiny of public market readiness. Only 30% of SaaS companies are profitable at IPO, down from historical norms, as investors prioritize growth over near-term profitability.
Public SaaS valuations have recovered from 2022 lows but remain below peak levels. The Rule of 40 has become a key valuation driver, with companies scoring above 60% commanding significant premiums. Net Revenue Retention above 120% similarly drives valuation multiples, reflecting the importance of expansion revenue in SaaS economics.
SaaS Churn and Retention Benchmarks
Retention metrics are the foundation of SaaS business health, with small improvements in churn rates translating to dramatic valuation impacts. Understanding industry benchmarks helps companies set appropriate targets and identify improvement opportunities.
Churn Rate Benchmarks by Segment
Churn rates vary significantly by customer segment. SMB-focused SaaS companies experience 3-5% monthly churn (30-45% annual), reflecting the higher volatility of small business customers. Mid-market companies achieve 1-2% monthly churn (12-20% annual), while enterprise SaaS typically sees less than 1% monthly churn (under 10% annual).
Best-in-class performers achieve under 5% annual logo churn regardless of segment. These companies typically share characteristics: strong product-market fit, proactive customer success programs, and continuous value delivery that makes switching costs prohibitive.
Industry-Specific Churn Patterns
Churn rates vary by industry vertical. Media and entertainment SaaS experiences the highest churn at 6.1% monthly, reflecting the project-based nature of many customer relationships. Healthcare SaaS achieves the lowest churn at 2.6% monthly, driven by regulatory complexity and high switching costs.
Annual contracts demonstrate 30% lower churn than month-to-month arrangements, justifying the discounts typically offered for annual commitments. Involuntary churn—failed payments rather than active cancellations—represents 20-40% of total churn, indicating opportunities for improvement through better payment processes and dunning management.
Net Revenue Retention Leaders
Top quartile SaaS companies achieve 120%+ Net Revenue Retention, meaning expansion revenue from existing customers more than offsets any churn. The median public SaaS company achieves 110% NRR, while bottom quartile performers fall below 100%—indicating that churn exceeds expansion.
Companies with 120%+ NRR command 2.3x higher valuations than peers with lower retention, reflecting investor confidence in their long-term revenue stability. Expansion revenue now accounts for 40% of new ARR at median SaaS companies, rising to over 50% for companies above $50M ARR.