SaaS Valuation Statistics 2026: Market Multiples, Data & Trends (Comprehensive Report)
The SaaS valuation landscape has undergone a dramatic transformation. In 2021, public SaaS companies traded at a median of 18.6x EV/Revenue. By March 2026, the SaaS Capital Index had compressed to 3.8x ARR—a 79% decline from the peak. Yet beneath these headline figures lies a more nuanced story: the gap between premium and average SaaS businesses has never been wider.
This report compiles data from 2,700+ M&A transactions, 100+ public SaaS companies, and surveys of 1,500+ private B2B SaaS firms to give you the definitive picture of SaaS valuation in 2026. Whether you’re a founder planning an exit, an investor evaluating opportunities, or an executive benchmarking your company, these are the numbers that matter.
Key Statistics at a Glance
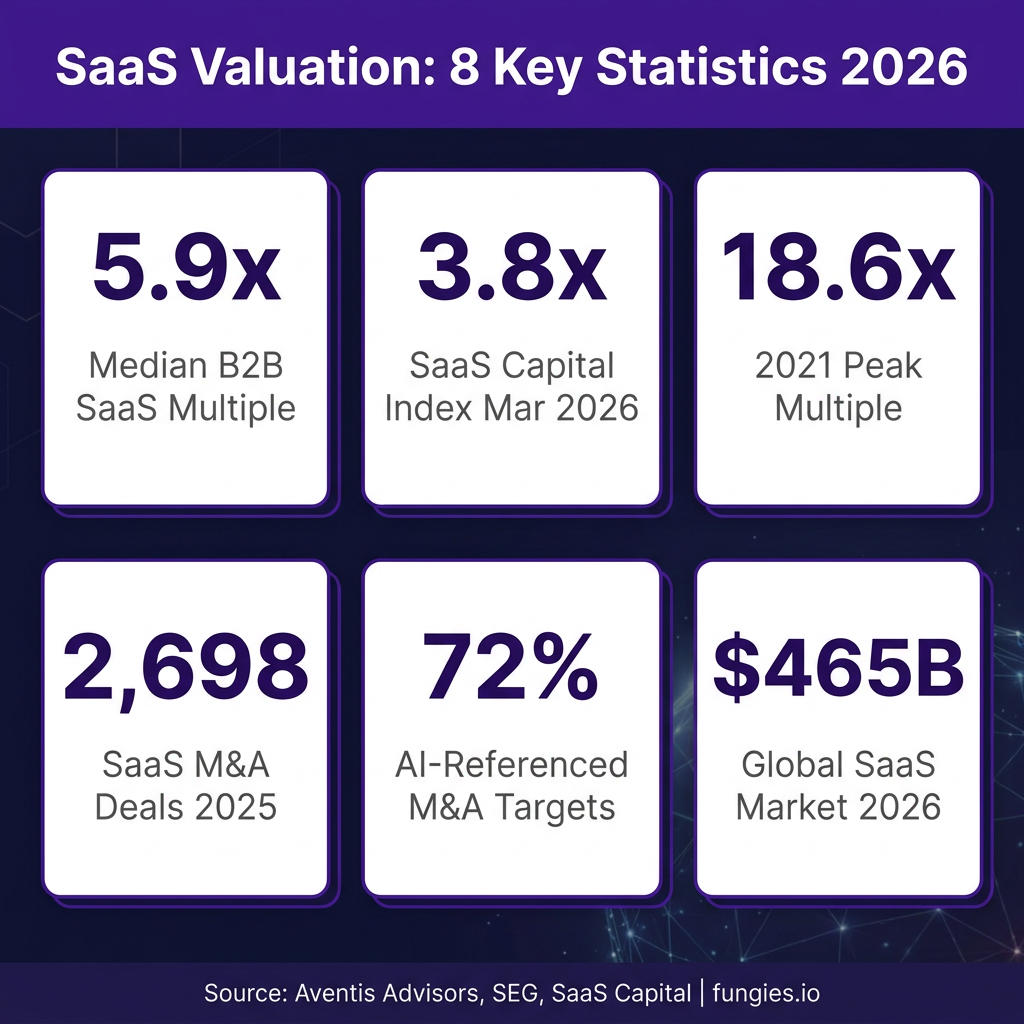
- 5.9x — Median B2B SaaS revenue multiple in 2025 (Finerva)
- 3.8x — SaaS Capital Index median ARR multiple (March 2026)
- 18.6x — Peak median EV/Revenue multiple (2021)
- 2,698 — SaaS M&A transactions closed in 2025 (SEG)
- 72% — Share of SaaS M&A targets referencing AI capabilities
- $465 billion — Global SaaS market size (2026)
- 12.5x — Median EV/Revenue for AI-native SaaS companies
- 4.5x — Median ARR multiple for lower middle market SaaS
- 101% — Median Net Revenue Retention across private B2B SaaS
- 26% — Median revenue growth rate for private SaaS companies
Market Size & Growth
The global Software-as-a-Service market has reached unprecedented scale. According to Mordor Intelligence, the SaaS market is estimated at $435.41 billion in 2026, growing from $370.4 billion in 2025. Precedence Research provides a slightly higher estimate of $465.03 billion for 2026, projecting the market to reach $1.37 trillion by 2035 at a 12.85% CAGR.
This growth trajectory reflects the continued digital transformation of enterprise operations. North America accounts for approximately 48% of global SaaS revenue, making the United States the single most important market. However, European SaaS companies with strong metrics increasingly command global-benchmark multiples, particularly those achieving Net Revenue Retention above 110% and Rule of 40 scores above 50.
| Metric | 2024 | 2025 | 2026 | 2030/2031 Forecast | CAGR |
|---|---|---|---|---|---|
| Global SaaS Market Size | $340.7B | $370.4B | $435-465B | $820B-$977B | 12-17.5% |
| Public SaaS Median Multiple | 6.7x | 5.9x | 6-7x | — | — |
| SaaS Capital Index | 7.0x | 5.2x | 3.8x | — | — |
| SaaS M&A Deal Volume | 2,100 | 2,698 | — | — | +28% |
The valuation compression from 2021’s peak has fundamentally reset market expectations. According to Aventis Advisors, what remains is “a more disciplined market where the spread between premium and average SaaS businesses has widened meaningfully.” This bifurcation means that while average companies trade at compressed multiples, exceptional businesses can still command premium valuations.
Valuation Multiples by Company Stage
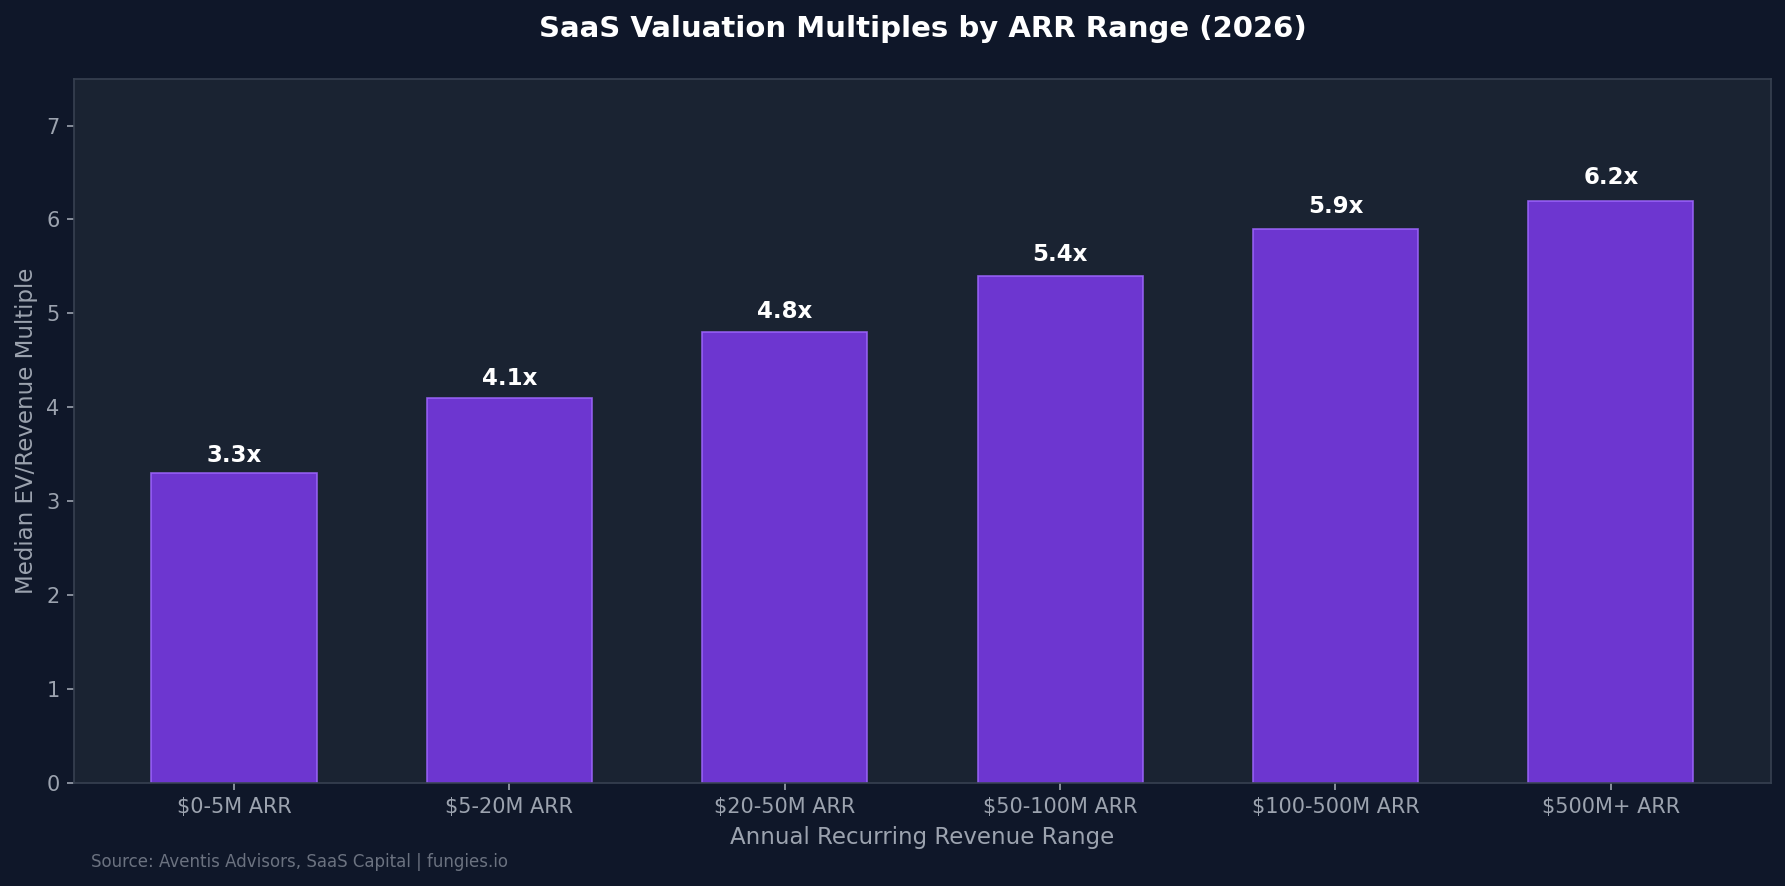
Company size—measured by Annual Recurring Revenue—remains one of the strongest predictors of valuation multiple. According to Aventis Advisors’ analysis of private SaaS transactions, median multiples increase steadily with ARR scale:
| ARR Range | Median EV/Revenue Multiple | Key Characteristics |
|---|---|---|
| $0-5M | 3.3x | Higher risk, unproven scale |
| $5-20M | 4.1x | Early product-market fit |
| $20-50M | 4.8x | Scaling go-to-market |
| $50-100M | 5.4x | Proven execution |
| $100-500M | 5.9x | Market leadership |
| $500M+ | 6.2x | Enterprise scale |
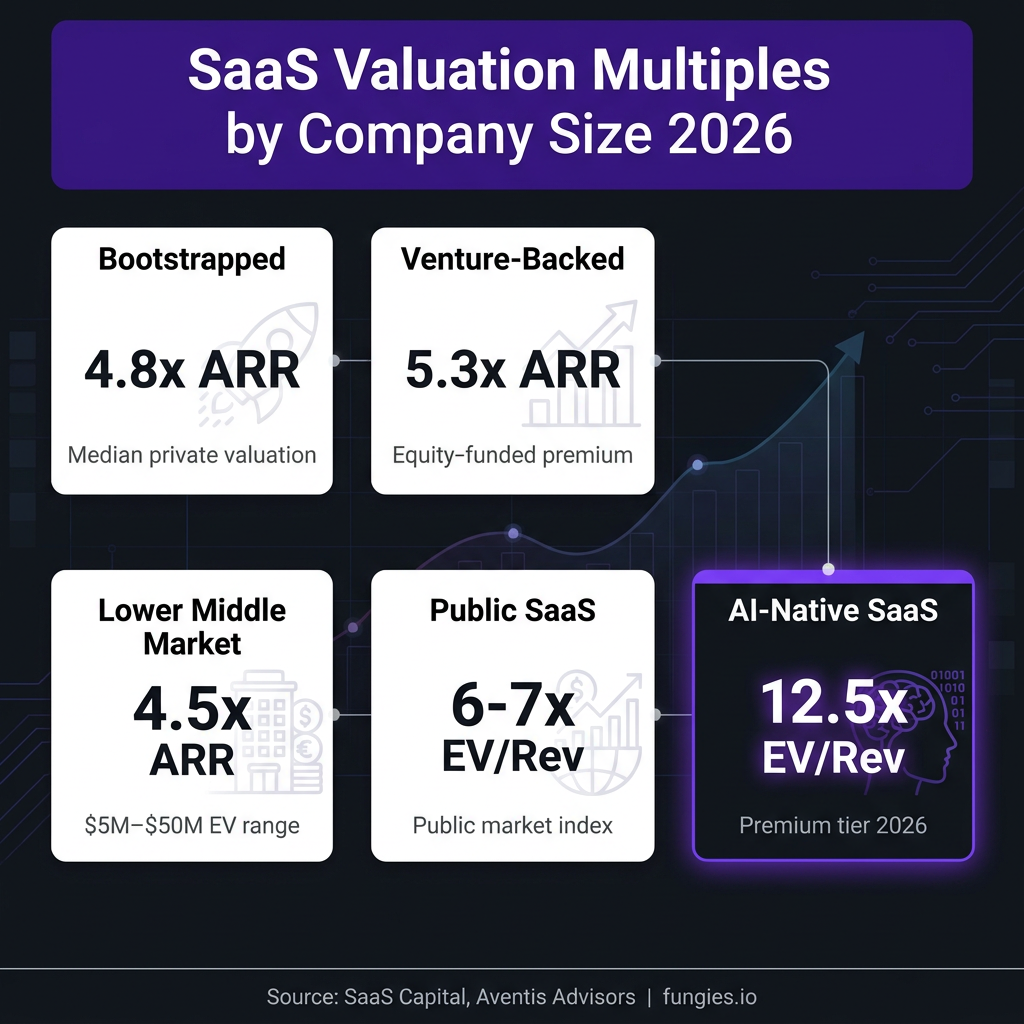
These figures represent median transactions. Companies with exceptional metrics—particularly Net Revenue Retention above 120% and Rule of 40 scores above 50—can command multiples 2-3x higher than these medians. According to SaaS Capital’s 2025 survey, bootstrapped companies with $3M-$20M ARR trade at a median 4.8x ARR, while venture-backed peers achieve 5.3x ARR.
Public vs. Private Market Valuations
The relationship between public and private SaaS valuations has shifted significantly. As of late 2025, public SaaS companies traded at approximately 6-7x EV/Revenue—roughly where they stood in 2015-2016. Private lower middle market companies—those in the $5M-$50M enterprise value range—trade at a 30-50% discount to public peers.
This discount reflects several factors: lower liquidity, higher information asymmetry, and greater execution risk. However, the discount also creates opportunity. Strategic and financial buyers with long-term horizons can acquire private SaaS assets at attractive entry points relative to public market equivalents.
| Market Segment | Median Multiple | Data Source |
|---|---|---|
| Public SaaS Index | 6-7x EV/Revenue | Windsor Drake, Q4 2025 |
| Public B2B SaaS | 5.9x EV/Revenue | Finerva, 2025 |
| Private M&A (Median) | 3.8x EV/Revenue | Aventis Advisors, 2025 |
| Lower Middle Market | 4-5x ARR | Windsor Drake |
| Bootstrapped SaaS | 4.8x ARR | SaaS Capital, 2025 |
| Venture-Backed SaaS | 5.3x ARR | SaaS Capital, 2025 |
| AI-Native SaaS | 12.5x EV/Revenue | LinkedIn/Pawel Maj, Jan 2026 |
The AI Valuation Premium
Artificial intelligence has created a distinct valuation tier within SaaS. According to data from Pawel Maj published in January 2026, SaaS companies with AI at their core command median EV/Revenue multiples of 12.5x—more than double the median for traditional SaaS businesses. This premium reflects investor expectations that AI-native companies will capture disproportionate value as enterprise AI adoption accelerates.
The AI premium extends beyond public markets. According to Software Equity Group’s 2026 Annual SaaS Report, AI-referenced targets accounted for approximately 72% of all SaaS M&A transactions in 2025. This doesn’t mean all these companies were AI-native—but it does indicate that AI positioning has become table stakes for achieving premium valuations.
However, the AI premium is not uniform. According to multiples.vc data from May 2026, public AI software companies show wide valuation dispersion—a sign of “creative destruction” as investors distinguish between genuine AI differentiation and marketing veneer. The median AI software multiple of 3.9x EV/Revenue and 11.0x EV/EBITDA suggests that profitability remains a critical factor even for AI-enabled businesses.
Key Operating Benchmarks
Valuation multiples don’t exist in isolation—they reflect underlying business performance. The following benchmarks from SaaS Capital’s 2026 survey and Benchmarkit’s 2025 data provide context for what drives these multiples:
| Metric | Median | Top Quartile | 90th Percentile |
|---|---|---|---|
| Revenue Growth (YoY) | 26% | 50% | 60%+ |
| Net Revenue Retention | 101% | 110% | 120%+ |
| Gross Revenue Retention | 91% | 95% | 97%+ |
| Rule of 40 Score | 30% | 40% | 50%+ |
| CAC Payback Period | 15 months | 12 months | <10 months |
| Sales & Marketing % Revenue | 47% (VC-backed) | 33% (PE-backed) | — |
| R&D % Revenue | 34% | — | — |
The Rule of 40—combining revenue growth rate and profit margin—remains the single best summary metric for SaaS company health. Companies achieving Rule of 40 scores above 40% command significant valuation premiums. According to Aventis Advisors, a 10-percentage-point improvement in NRR (from 100% to 110%) is associated with a 2-3x increase in EV/ARR multiple.
Net Revenue Retention by Segment
Net Revenue Retention has emerged as perhaps the most important single metric for SaaS valuation. According to Optifai’s Pipeline Study (2026, N=939 B2B SaaS companies), NRR benchmarks vary significantly by customer segment:
| Customer Segment | ACV Range | Median NRR | Best-in-Class |
|---|---|---|---|
| Enterprise | >$100K | 118% | >130% |
| Mid-Market | $25K-$100K | 108% | >120% |
| SMB | <$25K | 97% | >110% |
Companies with NRR above 100% can grow without acquiring new customers. A company with 115% NRR grows 15% annually from existing customers alone. This expansion efficiency translates directly into valuation premiums, as it reduces customer acquisition costs and improves unit economics.
M&A Market Activity
SaaS M&A activity reached its highest level on record in 2025. According to Software Equity Group’s 2026 Annual SaaS Report, 2,698 SaaS M&A transactions closed in 2025—a 28% increase from 2024. SaaS accounted for approximately 58% of total software M&A activity.
Technology M&A overall reached approximately $1.08 trillion in 2025, up 66% year-over-year, according to Windsor Drake. Global M&A value rose 41% to $4.8 trillion—making it the second-highest year on record. This activity reflects record private equity dry powder, enterprise demand for fewer vendors, and AI-driven deal theses.
Vertical SaaS represented 54% of all SaaS M&A in Q3 2025, up from 43% a year earlier. Analytics & Data Management and Content & Workflow Management were the two most active product categories, accounting for nearly 38% of total deal volume.
5 Trends Shaping SaaS Valuation 2026-2030
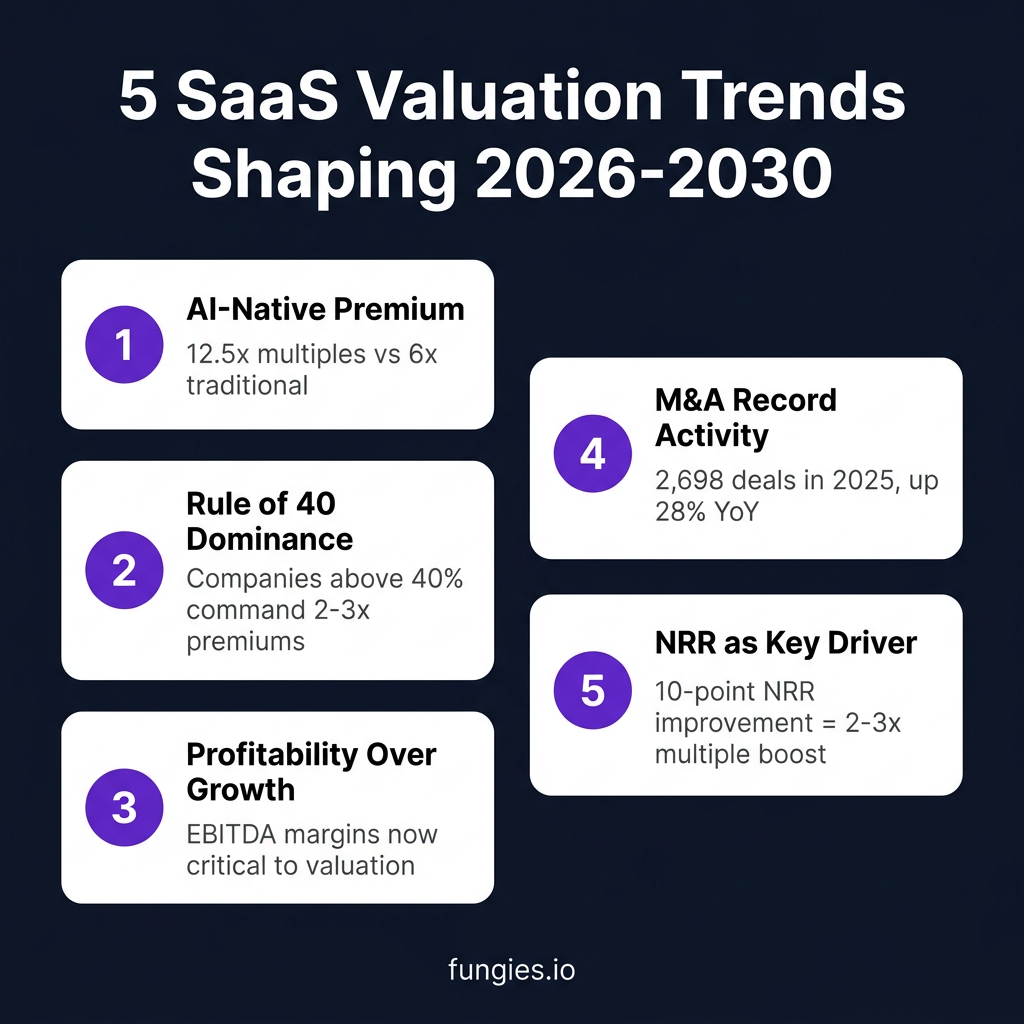
1. The AI-Native Premium
AI-native SaaS companies command 12.5x EV/Revenue multiples—more than double traditional SaaS. This premium reflects investor conviction that AI will reshape software markets, with first-movers capturing disproportionate value. However, the premium is narrowing for companies without clear AI differentiation.
2. Rule of 40 Dominance
The market has shifted from “growth at all costs” to balanced growth and profitability. Companies with Rule of 40 scores above 40 command 2-3x valuation premiums versus those below 20. This metric has become the primary lens through which investors evaluate SaaS business quality.
3. Profitability Over Growth
EBITDA margins now matter as much as growth rates. The median YoY revenue growth for SaaS companies is now 17%—the lowest since 2014 and far from the +30% growth that fueled higher multiples previously. Investors increasingly prioritize sustainable unit economics over top-line expansion.
4. Record M&A Activity
With 2,698 deals in 2025, SaaS M&A has never been more active. Private equity firms are deploying record dry powder, and strategic buyers are consolidating around platform ecosystems. This activity creates exit opportunities but also increases competition for premium assets.
5. NRR as the Key Value Driver
Net Revenue Retention has become the most valuation-accretive metric to improve. A 10-percentage-point NRR improvement (from 100% to 110%) correlates with a 2-3x multiple increase. Companies are investing heavily in customer success and expansion revenue to drive NRR higher.
Methodology
This report synthesizes data from multiple authoritative sources to provide a comprehensive view of SaaS valuation in 2026. Primary data sources include:
- Aventis Advisors: Analysis of 100+ public SaaS companies and private M&A transactions (2015-2026)
- Software Equity Group (SEG): 2026 Annual SaaS Report covering 2,700+ M&A transactions and 100+ public companies
- SaaS Capital: Annual survey of 1,500+ private B2B SaaS companies
- Benchmarkit: 2025 SaaS Performance Metrics across 2,100+ companies
- Optifai: Pipeline Study of 939 B2B SaaS companies (2026)
- Finerva: B2B SaaS Valuation Multiples Report 2026
- Windsor Drake: SaaS Valuation Report Q1 2026
- Mordor Intelligence & Precedence Research: Global SaaS market sizing
All figures represent medians unless otherwise specified. Valuation multiples are EV/Revenue (Enterprise Value divided by Annual Recurring Revenue or trailing twelve-month revenue) unless noted as ARR multiples. Data reflects market conditions as of Q1-Q2 2026.
Frequently Asked Questions
What is a good SaaS valuation multiple in 2026?
For private B2B SaaS companies, median multiples range from 3.3x EV/Revenue for sub-$5M ARR businesses to 6.2x for $500M+ companies. However, “good” depends on your metrics. Companies with NRR above 120%, Rule of 40 above 50, and strong growth can command 7-9x ARR or higher. AI-native companies are seeing 12.5x multiples.
How has the SaaS Capital Index changed?
The SaaS Capital Index stood at 3.8x ARR as of March 2026, down from 7.0x at the start of 2025 and 16.9x at the 2021 peak. This 79% decline from peak reflects a fundamental repricing of SaaS valuations as interest rates normalized and growth expectations reset.
What is the Rule of 40 and why does it matter?
The Rule of 40 states that a healthy SaaS company’s combined revenue growth rate and profit margin should equal or exceed 40%. It matters because it balances growth and profitability—the two dimensions that drive sustainable value creation. Companies above 40 command significant valuation premiums; those below 20 trade at discounts.
How does AI impact SaaS valuations?
AI-native SaaS companies command 12.5x EV/Revenue multiples—more than double traditional SaaS. Even AI-enabled features can drive premiums. However, the market is becoming more discerning; genuine AI differentiation commands premiums while “AI-washing” is increasingly penalized.
What NRR should a SaaS company target?
Best-in-class SaaS companies achieve NRR above 120%. Median NRR varies by segment: Enterprise (>$100K ACV) 118%, Mid-Market ($25K-$100K) 108%, SMB (<$25K) 97%. Companies should target at least 100% NRR to ensure growth from existing customers offsets churn.
Sources & Citations
- Aventis Advisors — SaaS Valuation Multiples 2015-2026: https://aventis-advisors.com/saas-valuation-multiples
- Software Equity Group — 2026 Annual SaaS Report: https://softwareequity.com/research/annual-saas-report
- SaaS Capital — SaaS Valuation Multiples Survey 2025: https://www.saas-capital.com/blog-posts/saas-valuation-multiples-understanding-the-new-normal
- Finerva — B2B SaaS 2026 Valuation Multiples: https://finerva.com/report/b2b-saas-2026-valuation-multiples
- Windsor Drake — SaaS Valuation Multiples 2026: https://windsordrake.com/saas-valuation-multiples
- Benchmarkit — 2025 SaaS Performance Metrics: https://www.benchmarkit.ai/2025benchmarks
- Optifai — CAC Payback Period Benchmarks 2026: https://optif.ai/learn/questions/cac-payback-period-benchmark
- Optifai — Net Revenue Retention Benchmark: https://optif.ai/learn/questions/b2b-saas-net-revenue-retention-benchmark
- Mordor Intelligence — Software as a Service Market Report: https://www.mordorintelligence.com/industry-reports/software-as-a-service-market
- Precedence Research — SaaS Market Size 2026-2035: https://www.precedenceresearch.com/software-as-a-service-market
- Multiples.vc — Public Software Valuation Multiples June 2026: https://multiples.vc/insights/software-saas-valuation-multiples
- SaaS Mag — SaaS Consolidation Wave 2026: https://www.saasmag.com/saas-consolidation-ma-wave-2026
- High Alpha — Mastering the SaaS Tightrope 2026: https://www.highalpha.com/blog/mastering-the-saas-tightrope-between-growth-efficiency-and-ai-costs-in-2026
- LinkedIn/Pawel Maj — SaaS Revenue Multiples January 2026: https://www.linkedin.com/posts/maj-pawel_saas-revenue-multiples-january-2026
At Fungies.io, we help SaaS companies streamline their payment operations and reduce churn through better checkout experiences. While valuation multiples matter for exits, sustainable growth comes from strong unit economics—and that starts with efficient revenue operations.
”’ with open(‘/tmp/article.html’, ‘w’) as f: f.write(content) print(“Article saved successfully”) print(f”Word count: {len(content.split())}”)Understanding these stage-specific multiples is crucial for founders planning fundraising or exit strategies. A company at $15M ARR should not benchmark against the 6-7x multiples of public SaaS companies, but rather against the 4.1x median for its stage. However, exceptional metrics can push companies above these medians—sometimes significantly.
The progression from 3.3x to 6.2x reflects decreasing risk as companies scale. Larger companies have proven product-market fit, established go-to-market motions, and more predictable revenue streams. They also tend to have more professionalized management teams and clearer paths to profitability—all factors that reduce investor risk and justify higher multiples.
CAC Payback Period Benchmarks
Customer Acquisition Cost (CAC) payback period has become a critical metric for SaaS valuation. According to Optifai’s Sales Ops Benchmark (N=939 companies), the median CAC payback period across B2B SaaS is 15 months. However, this varies significantly by customer segment:
| Customer Segment | ACV Range | CAC Payback Period |
|---|---|---|
| SMB | <$15K | 8-12 months |
| Mid-Market | $15K-$100K | 14-18 months |
| Enterprise | >$100K | 18-24 months |
Best-in-class companies recover acquisition costs in under 12 months, while venture-backed companies at Series B+ typically target under 18 months for capital efficiency. Companies with payback periods exceeding 24 months face significant valuation discounts as investors worry about capital efficiency and unit economics.
The CAC payback formula is straightforward: CAC divided by (ARPA × Gross Margin). For B2B SaaS companies, payback periods under 12 months count as strong, and high-performing teams often land between 5 and 7 months. At Fungies.io, we’ve observed that SaaS companies with optimized checkout experiences and streamlined onboarding typically achieve faster payback periods by reducing friction in the customer acquisition funnel.
Spending Benchmarks for SaaS Companies
SaaS Capital’s 2026 spending benchmarks reveal how private B2B SaaS companies allocate their resources. These figures provide context for evaluating operational efficiency and comparing against peers:
| Expense Category | Median % of ARR | YoY Change |
|---|---|---|
| Sales & Marketing | 15% | +2pp |
| Marketing (standalone) | 8% | Unchanged |
| Customer Support/Success | 9% | +1pp |
| Hosting/Infrastructure | 5% | Unchanged |
| Professional Services CoGS | 5% | Unchanged |
The increase in sales and customer success spending reflects a market shift toward retention and expansion over pure new customer acquisition. With median NRR compressing to 101%, companies are investing more in customer success to drive expansion revenue and reduce churn.
Notably, R&D spending remains elevated at 34% of revenue for private SaaS companies—significantly higher than the 23% for public SaaS companies. This reflects the ongoing investment required to build competitive products and the pressure to integrate AI capabilities.
Regional Variations in SaaS Valuation
While SaaS is inherently global, regional variations in valuation persist. According to Masynergy’s analysis of European SaaS valuations, European software companies continue to command premium multiples relative to traditional industries, though they often trade at modest discounts to US peers.
Key regional insights include:
- European SaaS with NRR above 110% command global-benchmark multiples; those below 90% face significant discounts
- French SaaS valuations have converged with broader European benchmarks, though domestic market focus can limit multiple potential
- UK SaaS companies benefit from London’s financial center status and strong M&A activity
- North American SaaS continues to command the highest multiples due to market depth and exit opportunity
For European SaaS companies with NRR above 120% and Rule of 40 scores above 50, the discount to US peers effectively disappears. Quality SaaS commands global-benchmark multiples regardless of headquarters location.
The Future of SaaS Valuation
Looking ahead to 2027-2030, several factors will shape SaaS valuations:
AI Integration: The gap between AI-native and traditional SaaS will likely persist, but the definition of “AI-native” will evolve. Companies that successfully embed AI to deliver measurable customer value will command premiums; those that merely bolt on AI features will see premiums compress.
Profitability Focus: The market’s emphasis on the Rule of 40 and unit economics is unlikely to reverse. Even if interest rates decline, investors have learned the lessons of 2021-2022 and will continue to prioritize sustainable business models.
Consolidation: With 2,698 M&A transactions in 2025 and record private equity dry powder, consolidation will continue. This creates both opportunities (exit options) and risks (increased competition) for SaaS companies.
Vertical SaaS: The shift toward vertical SaaS (54% of M&A in Q3 2025) reflects investor preference for deep specialization over horizontal platforms. Companies serving specific industries with tailored solutions increasingly command premium multiples.
The global SaaS market is projected to reach $1.37-1.48 trillion by 2034-2035, representing a CAGR of 12-17.5%. This growth will create enormous value for companies that can capture market share while maintaining strong unit economics.