E-commerce Statistics 2026: Global Market Size, Data & Trends (Comprehensive Report)
The global e-commerce market has evolved from a convenient alternative to brick-and-mortar retail into the dominant force shaping how the world shops. With over 2.7 billion online shoppers worldwide and annual sales projected to exceed $6.88 trillion in 2026, understanding the data behind this transformation isn’t just useful—it’s essential for any business looking to compete in the digital economy.
Whether you’re a merchant evaluating payment solutions, a SaaS founder analyzing market opportunities, or a digital creator exploring new revenue streams, this report delivers the authoritative statistics you need. We’ve compiled data from Grand View Research, Statista, Mordor Intelligence, the U.S. Census Bureau, and Baymard Institute to give you a comprehensive view of where e-commerce stands today and where it’s heading.
Key E-commerce Statistics at a Glance
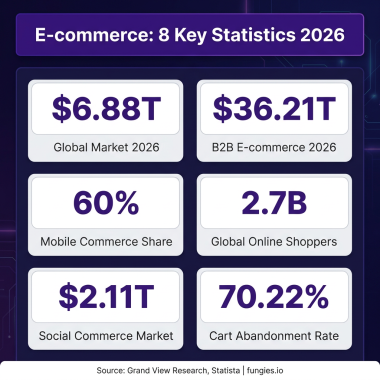
Before diving into the analysis, here are the most critical figures shaping the e-commerce landscape in 2026:
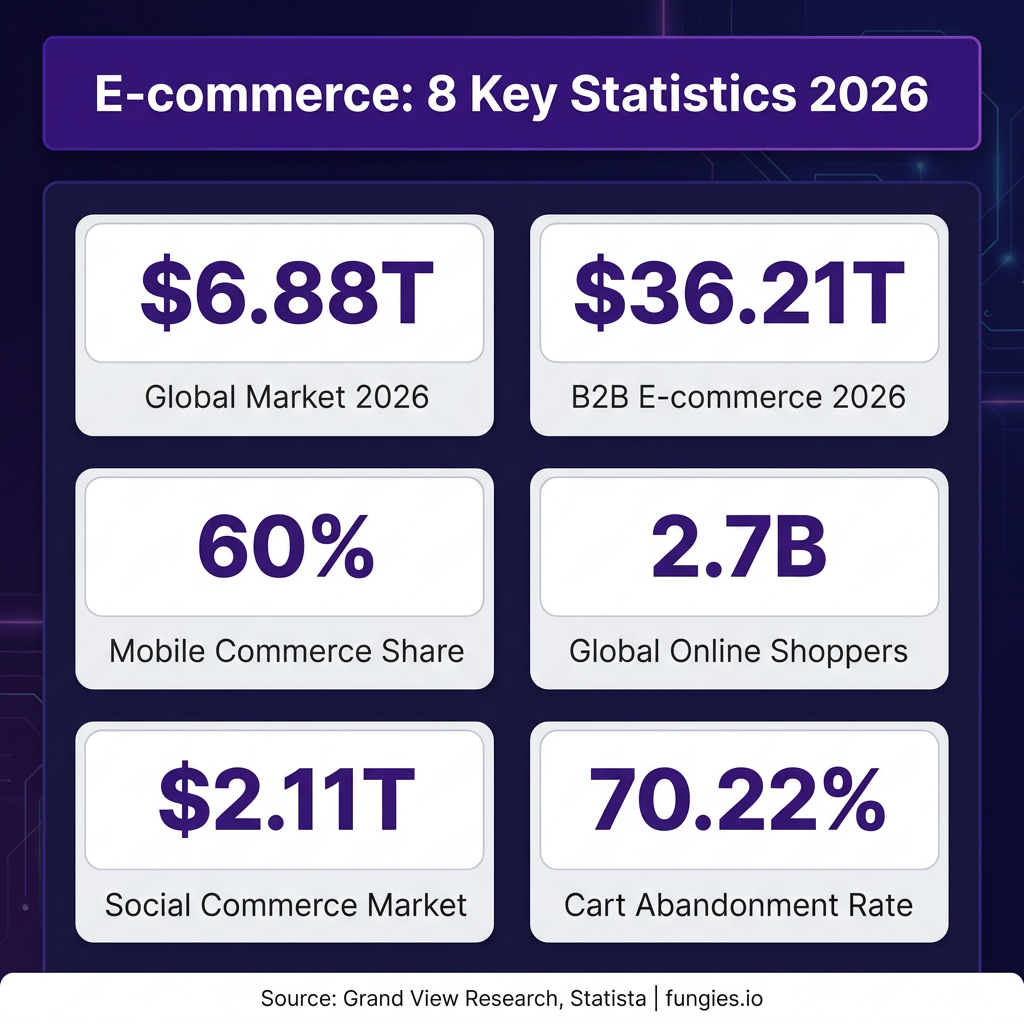
- $6.88 trillion — Projected global e-commerce revenue for 2026 (Grand View Research)
- $36.21 trillion — Global B2B e-commerce market size in 2026 (Mordor Intelligence)
- 2.7 billion — Total number of online shoppers worldwide (Shopify)
- 60% — Share of e-commerce transactions completed on mobile devices (Ringly.io)
- $2.11 trillion — Global social commerce market value in 2026 (Mordor Intelligence)
- 70.22% — Average online shopping cart abandonment rate (Baymard Institute)
- 21.1% — E-commerce share of total global retail sales (Shopify)
- $260 billion — Recoverable revenue through checkout optimization (Baymard Institute)
- 40.5% — Amazon’s market share among U.S. online retailers (Statista)
- 11.7% — Projected CAGR for retail e-commerce through 2033 (Coherent Market Insights)
Global E-commerce Market Size & Growth
The e-commerce market has demonstrated remarkable resilience and growth, even as the post-pandemic landscape normalized. According to Grand View Research, the global e-commerce market reached $33.91 trillion in 2025 and is expected to grow to $39.70 trillion in 2026. However, other analysts paint an even more expansive picture.
Mordor Intelligence estimates the e-commerce market size at $36.21 trillion in 2026, projecting it will reach $77.58 trillion by 2031—representing a compound annual growth rate (CAGR) of 16.46%. Meanwhile, Coherent Market Insights forecasts the retail e-commerce segment specifically at $8.14 trillion in 2026, growing to $15.82 trillion by 2033 at an 11.7% CAGR.
These variations reflect different methodologies and scope definitions, but the trend is unambiguous: e-commerce is experiencing sustained double-digit growth that shows no signs of slowing.
Historical Growth Trajectory
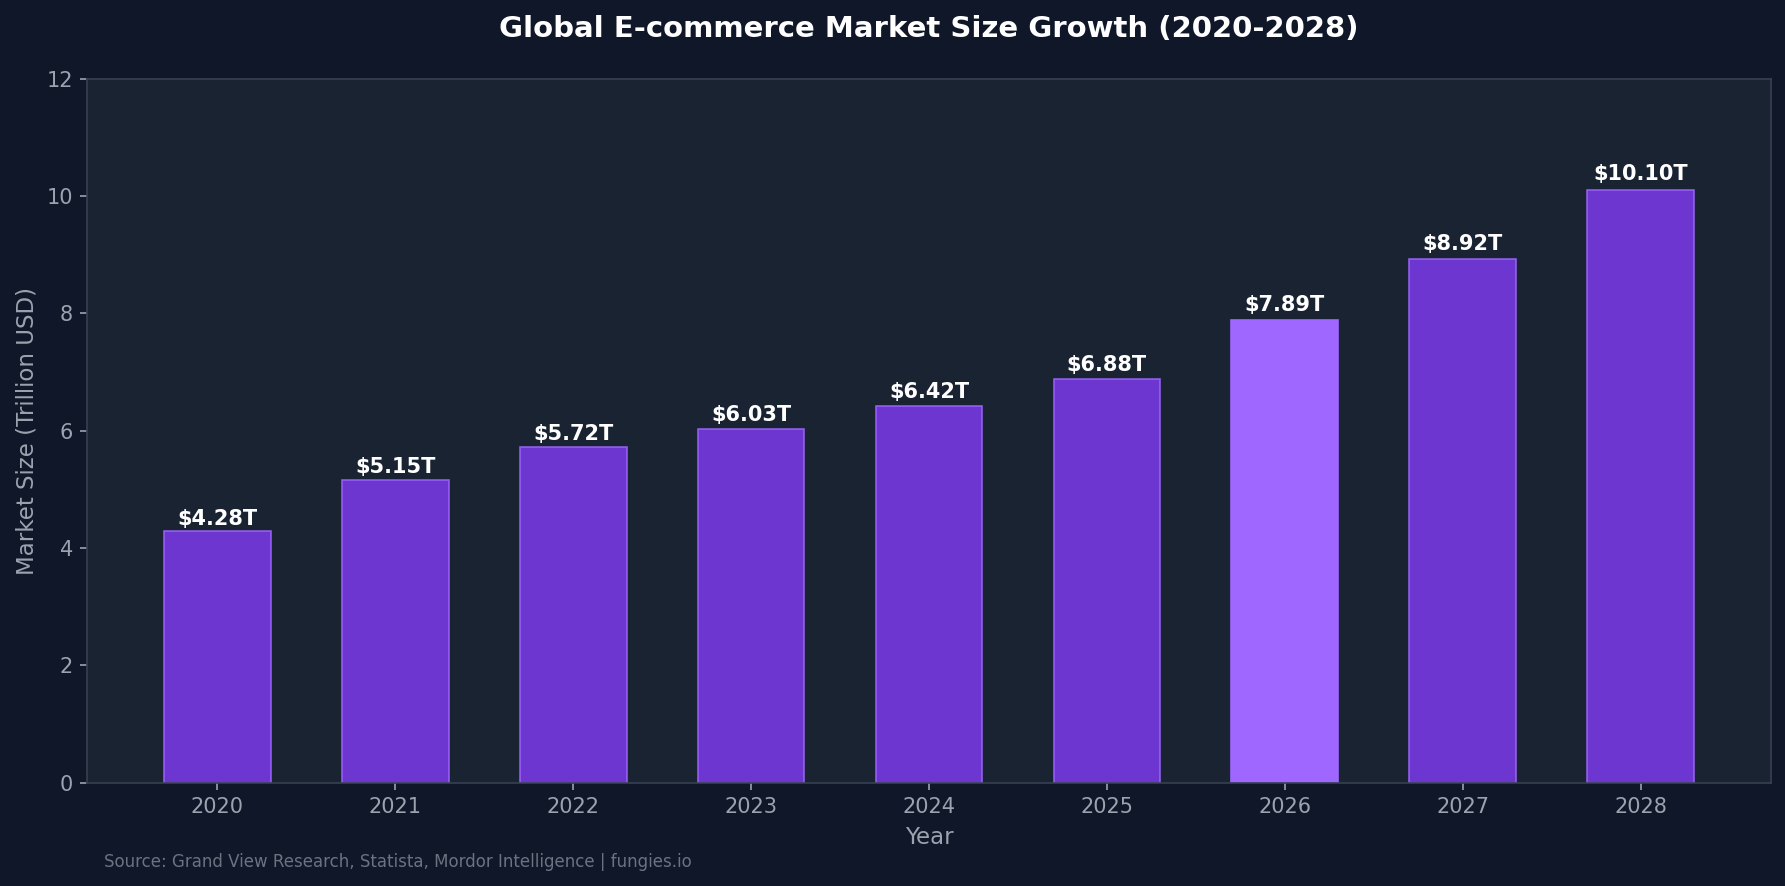
The e-commerce market has more than doubled since 2020. According to data compiled from multiple sources, global e-commerce sales grew from approximately $4.28 trillion in 2020 to an estimated $6.42 trillion in 2025. The COVID-19 pandemic accelerated adoption by 3-5 years, with 2020 seeing an unprecedented 88.5% year-over-year growth spike.
| Year | Global E-commerce Revenue | YoY Growth |
|---|---|---|
| 2020 | $4.28 trillion | +88.5% |
| 2021 | $5.15 trillion | +20.3% |
| 2022 | $5.72 trillion | +11.1% |
| 2023 | $6.03 trillion | +5.4% |
| 2024 | $6.42 trillion | +6.5% |
| 2025 | $6.88 trillion | +7.2% |
| 2026 (proj.) | $7.89 trillion | +14.7% |
| 2028 (proj.) | $10.1 trillion | +13.0% |
E-commerce Market Share by Region
The global e-commerce landscape remains geographically concentrated, with three regions—China, the United States, and Western Europe—accounting for over $5.17 trillion in combined sales in 2025, according to Shopify.
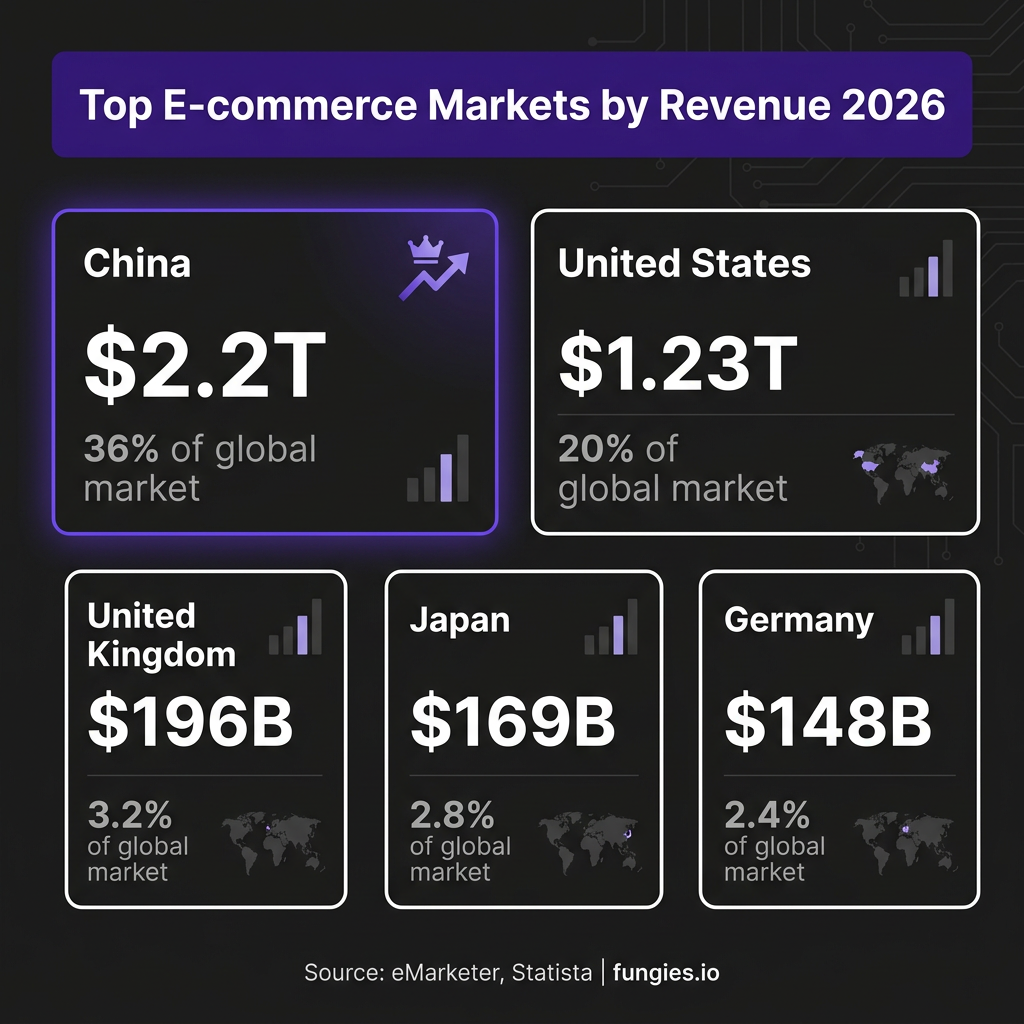
China: The Dominant Force
China remains the world’s largest e-commerce market by a significant margin. According to eMarketer and eCommerceDB, China’s online retail sales are estimated at approximately $2.2–$2.4 trillion in 2025, representing roughly 36% of the global market. With platforms like Alibaba (939 million active users), JD.com, and Pinduoduo leading the charge, China’s e-commerce penetration rate exceeds 50% of total retail sales.
United States: Steady Growth
The U.S. e-commerce market reached $1.2337 trillion in 2025, according to the U.S. Census Bureau, representing a 5.4% year-over-year increase. E-commerce now accounts for 16.4% of total U.S. retail sales, up from 16.1% in 2024. Forrester projects U.S. retail e-commerce will reach $1.8 trillion by 2030, representing 29% of total retail.
Europe and Emerging Markets
Europe represents over $900 billion in e-commerce revenue, with the United Kingdom leading at approximately $196 billion. The UK is notable for having one of the highest e-commerce penetration rates globally—online sales are expected to account for more than 28% of all UK retail sales in 2026, rising to nearly 30% by 2030.
| Country | 2026 E-commerce Revenue | Global Market Share |
|---|---|---|
| China | $2.2–$2.4 trillion | ~36% |
| United States | $1.23 trillion | ~20% |
| United Kingdom | $196 billion | ~3.2% |
| Japan | $169 billion | ~2.8% |
| Germany | $148 billion | ~2.4% |
| South Korea | $112 billion | ~1.8% |
Key Players & Market Share
The e-commerce landscape is dominated by a handful of global giants, though regional players maintain significant positions in their home markets.
Amazon’s Continued Dominance
Amazon remains the undisputed leader in Western e-commerce. According to Statista, Amazon captured 40.5% of the U.S. e-commerce market in 2025. The company’s U.S. branch generated nearly $500 billion in sales, with global revenue reaching approximately $574.8 billion. Amazon’s marketplace model, with approximately 2 billion live listings and millions of active sellers, continues to set the standard for online retail.
Alibaba’s Asian Stronghold
Alibaba dominates Chinese e-commerce with its Taobao and Tmall platforms, serving 939 million active users. The company holds approximately 41% market share in China’s B2B e-commerce sector and is actively expanding into Southeast Asia, Europe, and Latin America through platforms like Lazada and AliExpress.
| Company | 2025 Revenue | Primary Market | Key Strength |
|---|---|---|---|
| Amazon | $574.8 billion | Global (US-led) | Marketplace + Logistics |
| Alibaba | $130+ billion | China/Asia | B2B + B2C Ecosystem |
| JD.com | $150+ billion | China | Direct Sales + Delivery |
| eBay | $19+ billion | Global | C2C Marketplace |
| Shopify | $8+ billion | Global | Merchant Platform |
Industry Benchmarks & KPIs
Understanding how your e-commerce performance compares to industry benchmarks is crucial for identifying optimization opportunities. Here’s what the data shows:
Conversion Rates by Channel
The average e-commerce conversion rate in 2026 sits between 2.5% and 3% globally, according to multiple industry studies. However, this varies significantly by traffic source and device:
| Traffic Source | Avg. Conversion Rate |
|---|---|
| Email Marketing | 5.3% |
| Referral Traffic | 5.4% |
| Organic Search | 3.0% |
| Paid Search | 2.9% |
| Desktop Overall | 2.8% |
| Mobile Overall | 2.8% |
| Social Media | 0.7% |
Cart Abandonment: The $260 Billion Problem
According to Baymard Institute’s analysis of 50 studies, the average documented online shopping cart abandonment rate is 70.22%. This means more than 7 out of 10 shoppers who add products to their cart leave without completing the purchase.
The financial impact is staggering. Baymard estimates that $260 billion worth of lost orders are recoverable solely through better checkout flow and design. The top reasons for abandonment include:
- Extra costs too high (shipping, tax, fees) — 48%
- Forced account creation — 24%
- Too long/complicated checkout process — 18%
- Couldn’t see/calculate total cost up-front — 16%
- Website errors/crashes — 13%
Mobile Commerce Metrics
Mobile commerce (m-commerce) now accounts for 60% of total global e-commerce sales, generating approximately $2.4 trillion in 2026. However, mobile conversion rates lag desktop despite higher traffic volumes:
| Device | Traffic Share | Conversion Rate | Cart Abandonment |
|---|---|---|---|
| Mobile | ~65% | 2.8% | 75–85% |
| Desktop | ~30% | 2.8% | 69–73% |
| Tablet | ~5% | 2.9% | 68–80% |
E-commerce Trends & Predictions (2026-2030)
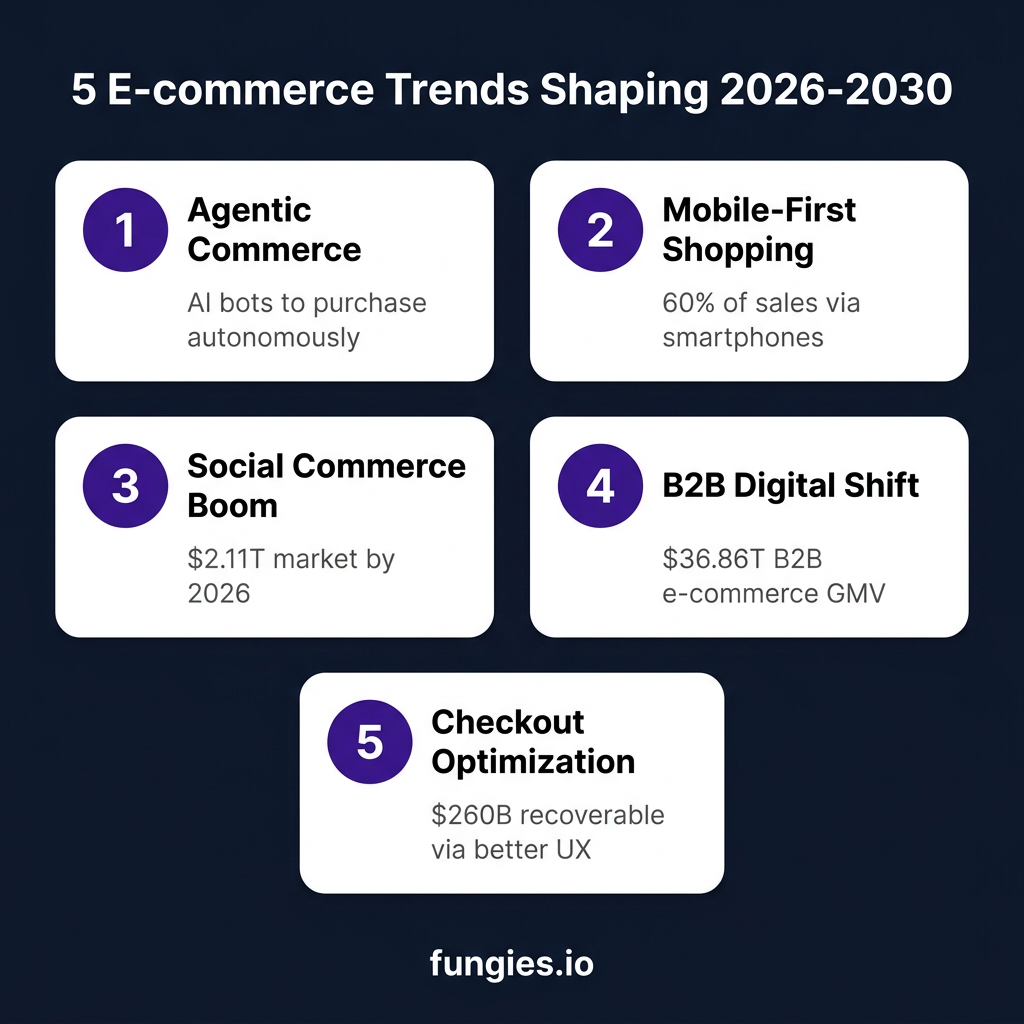
The e-commerce landscape is undergoing fundamental shifts driven by technology, changing consumer behavior, and evolving business models. Here are the five trends that will define the next five years:
1. Agentic Commerce and AI Automation
According to Signifyd’s 2026 Commerce Report, “agentic commerce”—where AI agents research, negotiate, and purchase on behalf of consumers—is emerging as a significant channel. While still nascent, this trend represents a shift from click-based purchasing to intent-based automated transactions. By 2030, AI-driven product recommendations and automated purchasing could handle a meaningful percentage of routine e-commerce transactions.
2. Social Commerce Explosion
The global social commerce market is projected to grow from $2.11 trillion in 2026 to $7.55 trillion by 2031, representing a 29.12% CAGR according to Mordor Intelligence. Platforms like TikTok Shop, Instagram Shopping, and Pinterest Buyable Pins are transforming social media from discovery channels into direct purchase points. TikTok Shop alone reached $23 billion in U.S. sales, demonstrating the power of integrated social shopping.
3. B2B Digital Transformation
B2B e-commerce is experiencing explosive growth, with the market expected to reach $36.86 trillion in 2026 and $61.66 trillion by 2031 (Mordor Intelligence). Manufacturing, distribution, and wholesale sectors account for over 60% of global B2B e-commerce transactions. The digitization of complex supply chains and demand for streamlined procurement processes are driving this transformation.
4. Mobile-First Optimization
With mobile accounting for 60% of e-commerce sales, merchants are shifting from mobile-responsive to mobile-first design. Mobile apps convert at 3.5% compared to just 2% for mobile websites, with cart abandonment rates significantly lower (20% vs. 85%). Progressive Web Apps (PWAs) and native app experiences are becoming table stakes for competitive e-commerce operations.
5. Checkout Experience as Competitive Advantage
With $260 billion in recoverable revenue at stake, checkout optimization is moving from back-office function to strategic priority. Baymard Institute’s research shows that the average large-sized e-commerce site can gain a 35.26% increase in conversion rate through better checkout design. One-click checkout, digital wallets, and guest checkout options are becoming essential features.
B2B E-commerce: The Bigger Opportunity
While B2C e-commerce captures headlines, B2B e-commerce represents a significantly larger market opportunity. According to Grand View Research, the global B2B e-commerce market reached $24.08 trillion in 2025 and is projected to hit $28.03 trillion in 2026.
The long-term projections are even more impressive: the market is expected to reach $105.85 trillion by 2033, growing at a 20.9% CAGR. This growth is driven by:
- Digital-native procurement teams replacing traditional buyers
- Integration of e-commerce platforms with ERP and inventory systems
- Rise of vertical marketplaces serving specific industries
- Demand for self-service ordering and real-time pricing
| Segment | 2026 Market Size | 2033 Projection | CAGR |
|---|---|---|---|
| B2B E-commerce (Grand View) | $28.03 trillion | $105.85 trillion | 20.9% |
| B2B E-commerce (Mordor) | $36.86 trillion | $61.66 trillion | 10.84% |
| B2C E-commerce | $6.88 trillion | $15.82 trillion | 11.7% |
Methodology
This report synthesizes data from authoritative sources including Grand View Research, Mordor Intelligence, Coherent Market Insights, Statista, the U.S. Census Bureau, Baymard Institute, Shopify, and eMarketer. Market size figures vary across sources due to differing methodologies, scope definitions, and geographic coverage.
Where sources provide conflicting figures, we’ve noted the range or prioritized the most recent and comprehensive analysis. All projections are based on analyst forecasts current as of January-June 2026. Historical data has been cross-referenced across multiple sources to ensure accuracy.
Frequently Asked Questions
What is the size of the e-commerce market in 2026?
The global e-commerce market is projected to reach between $6.88 trillion and $39.70 trillion in 2026, depending on methodology and scope. B2C retail e-commerce specifically is estimated at $6.88 trillion, while broader e-commerce definitions including B2B reach significantly higher figures.
What is the average e-commerce conversion rate?
The average e-commerce conversion rate in 2026 is between 2.5% and 3% globally. However, this varies significantly by industry—food and beverage can exceed 6%, while luxury goods often fall below 1%. Email marketing converts at 5.3%, while social media typically stays under 1%.
What percentage of e-commerce is mobile?
Mobile commerce accounts for 60% of total global e-commerce sales in 2026, up from 43% in 2018. This share is projected to reach 63% by 2028. Mobile apps convert at 3.5% compared to 2% for mobile websites.
What is the cart abandonment rate?
The average documented online shopping cart abandonment rate is 70.22%, according to Baymard Institute’s analysis of 50 studies. Mobile abandonment rates are higher (75–85%) compared to desktop (69–73%). An estimated $260 billion in revenue is recoverable through checkout optimization.
Which country has the largest e-commerce market?
China has the largest e-commerce market with approximately $2.2–$2.4 trillion in annual sales, representing about 36% of global e-commerce. The United States follows at $1.23 trillion (20% of global market), with the United Kingdom, Japan, and Germany rounding out the top five.
Sources & Citations
- Grand View Research — E-commerce Market Size Report 2026: https://www.grandviewresearch.com/industry-analysis/e-commerce-market
- Mordor Intelligence — E-commerce Market Analysis 2026-2031: https://www.mordorintelligence.com/industry-reports/global-ecommerce-market
- Coherent Market Insights — Retail E-commerce Forecast 2026-2033: https://www.coherentmarketinsights.com/industry-reports/retail-e-commerce-market
- Statista — E-commerce Worldwide Statistics: https://www.statista.com/topics/871/online-shopping
- U.S. Census Bureau — Quarterly Retail E-commerce Sales: https://www.census.gov/retail/ecommerce.html
- Baymard Institute — Cart Abandonment Rate Statistics: https://baymard.com/lists/cart-abandonment-rate
- Shopify — Global Ecommerce Sales Growth Report: https://www.shopify.com/blog/global-ecommerce-sales
- Forrester — US Retail E-commerce Forecast 2025-2030: https://www.forrester.com/blogs/us-retail-in-2030-e-commerce-expands-stores-still-matter
- Signifyd — State of Commerce Report 2026: https://www.signifyd.com/ecommerce-trends-report
- Dynamic Yield — E-commerce Conversion Rate Benchmarks: https://marketing.dynamicyield.com/benchmarks/conversion-rate
- eMarketer — Global E-commerce Forecast: https://www.emarketer.com
- Ringly.io — Mobile Commerce Statistics 2026: https://www.ringly.io/blog/mobile-commerce-statistics-2026
Last updated: June 19, 2026. Statistics reflect the most recent available data as of publication date.