Payment Gateway Statistics 2026: Market Size, Data & Trends (Comprehensive Report)
The global payment gateway market is experiencing explosive growth, projected to reach $58.77 billion in 2026 alone—representing a 22% year-over-year increase. For businesses, developers, and investors navigating the digital payments landscape, understanding these numbers isn’t optional—it’s essential for strategic decision-making.
This comprehensive report compiles the latest payment gateway statistics from authoritative sources including Grand View Research, Mordor Intelligence, Global Market Insights, and Fortune Business Insights. Whether you’re evaluating payment infrastructure for your SaaS, comparing gateway providers, or analyzing market opportunities, this data-driven analysis provides the benchmarks you need.
Key Statistics at a Glance
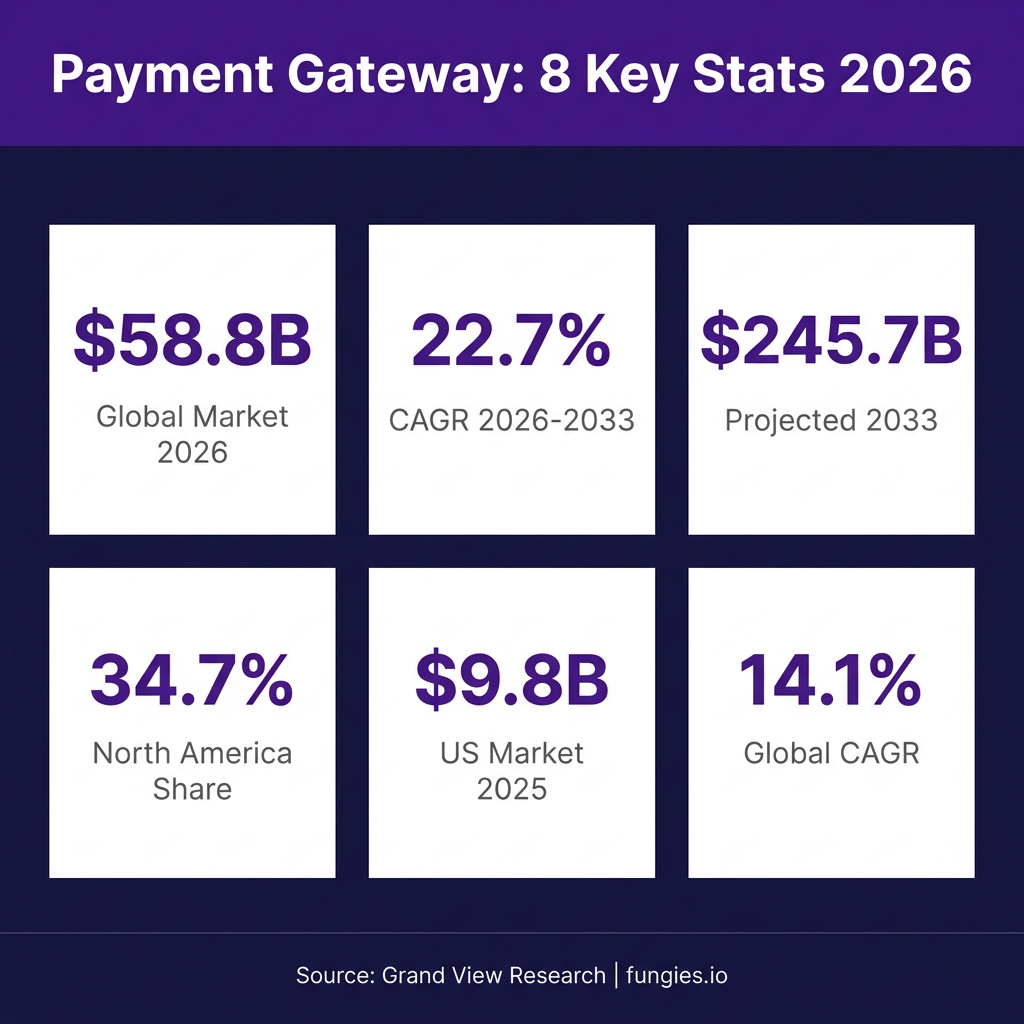
- The global payment gateway market will reach $58.77 billion in 2026, up from $48.17 billion in 2025 (Grand View Research)
- Long-term projection: $245.71 billion by 2033 at a CAGR of 22.7%
- Alternative estimate: Global Market Insights values the market at $32.7 billion in 2025, projecting $116.7 billion by 2035
- The U.S. payment gateway market alone was valued at $9.8 billion in 2025 (Yahoo Finance)
- North America dominates with 34.7% market share, but Asia-Pacific is the fastest-growing region
- Hosted payment gateways lead with 68% market share in the United States
- The top 20 global payment companies generated a combined $280 billion in revenue in 2025
- Shift4 Payments and Adyen are growing at 25.5% and 23.7% respectively—outpacing larger competitors
Global Payment Gateway Market Size & Growth
The payment gateway market is one of the fastest-growing segments in fintech, driven by the accelerating shift toward digital commerce and cashless transactions. According to Grand View Research, the market was valued at $48.17 billion in 2025 and is expected to reach $58.77 billion in 2026.
The long-term projection is even more impressive: the market is forecast to reach $245.71 billion by 2033, expanding at a compound annual growth rate (CAGR) of 22.7%. This trajectory reflects sustained enterprise investment in digital payment infrastructure and increasing merchant adoption across retail, hospitality, healthcare, and financial services sectors.
Global Market Insights offers a more conservative estimate, valuing the market at $32.7 billion in 2025 with projections to reach $116.7 billion by 2035 at a 14.1% CAGR. Fortune Business Insights estimates the market at $30.58 billion in 2025, projecting growth to $90.28 billion by 2034 at a 12.78% CAGR. Mordor Intelligence places the 2025 market at $18.32 billion, forecasting $41.11 billion by 2031 at a 14.42% CAGR.
| Source | 2025 Market Size | 2033/2035 Projection | CAGR |
|---|---|---|---|
| Grand View Research | $48.17 billion | $245.71 billion (2033) | 22.7% |
| Global Market Insights | $32.7 billion | $116.7 billion (2035) | 14.1% |
| Fortune Business Insights | $30.58 billion | $90.28 billion (2034) | 12.78% |
| Mordor Intelligence | $18.32 billion | $41.11 billion (2031) | 14.42% |
| Research and Markets | $44.55 billion | $53 billion (2026) | 19% |
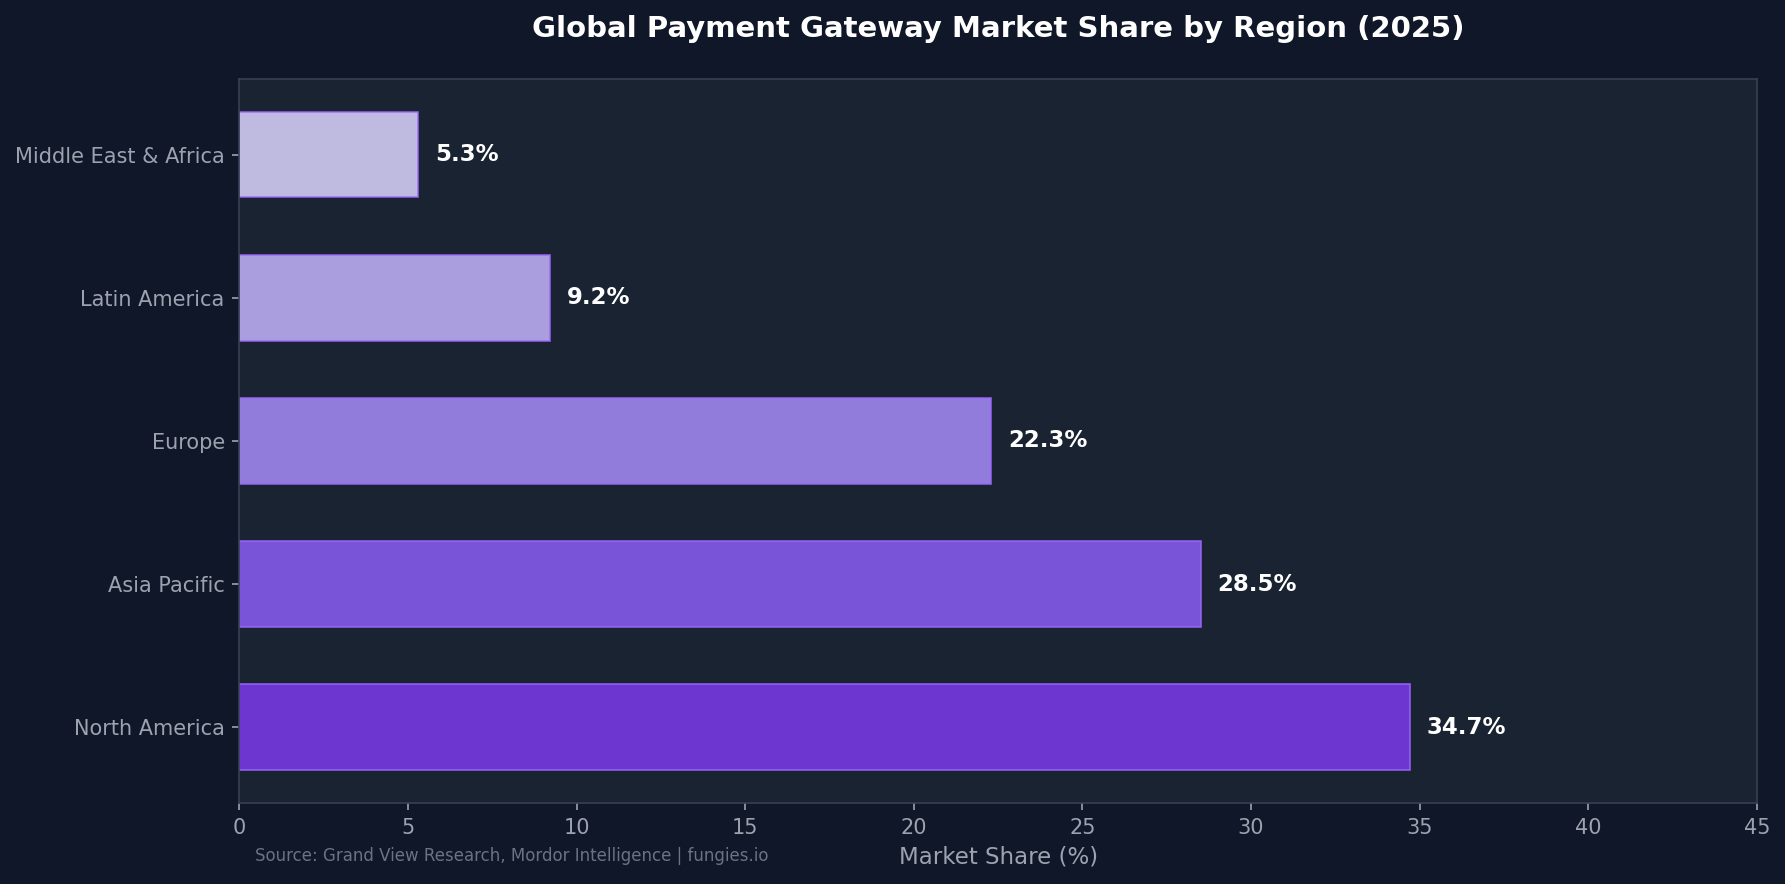
Regional Market Breakdown
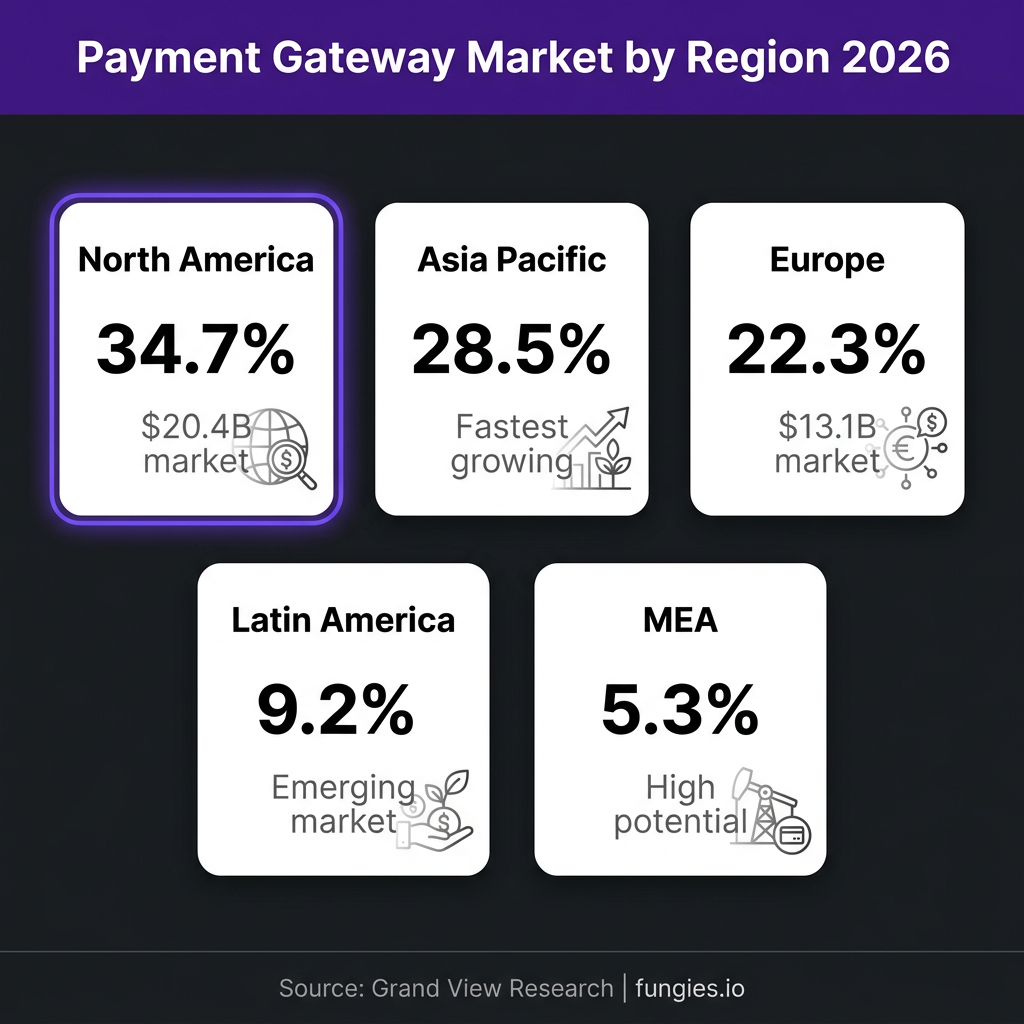
North America currently dominates the global payment gateway landscape, accounting for 34.7% of total revenue in 2025 according to Grand View Research. The region’s leadership stems from advanced digital infrastructure, high card penetration rates, and mature e-commerce adoption.
The United States payment gateway market specifically was valued at $9.8 billion in 2025 according to Yahoo Finance, with expectations to grow at a CAGR of 12.4% through 2035. IMARC Group provides a more conservative estimate, placing the U.S. market at $6.1 billion in 2025 with projections to reach $8.83 billion by 2034.
Asia-Pacific is the fastest-growing regional market, driven by explosive e-commerce expansion in China, India, and Southeast Asia. The region’s growth is fueled by increasing smartphone penetration, rising digital payment adoption, and government initiatives promoting cashless economies.
| Region | Market Share (2025) | Key Characteristics |
|---|---|---|
| North America | 34.7% | Mature market, high card penetration, omnichannel commerce |
| Asia Pacific | 28.5% | Fastest-growing, mobile-first adoption |
| Europe | 22.3% | Strong regulatory framework, open banking |
| Latin America | 9.2% | Emerging market, high growth potential |
| Middle East & Africa | 5.3% | Underbanked populations, mobile money growth |
Key Players & Market Share
The global payments industry delivered another year of expansion in 2025, with the world’s 20 largest listed payment companies generating a combined revenue base of $280 billion, according to GlobalData. Growth is increasingly concentrated among firms exposed to cross-border transactions, digital commerce, and software-integrated payments.
While incumbents like Visa and Mastercard maintain dominant positions, mid-tier challengers are outpacing them in growth rates. Shift4 Payments grew 25.5% in 2025, while Adyen expanded 23.7%—growth rates that dwarf those of larger competitors above them in revenue rankings.
Mastercard’s growth reflects a deliberate pivot into value-added services: data analytics, cybersecurity solutions, and open banking APIs now account for a growing share of revenue. This diversification strategy is being emulated across the industry as payment gateways seek to differentiate beyond transaction processing.
| Company | 2025 Growth Rate | Strategic Focus |
|---|---|---|
| Shift4 Payments | +25.5% | Software-integrated payments, hospitality |
| Adyen | +23.7% | Unified commerce, global expansion |
| Mastercard | Steady | Value-added services, open banking APIs |
| Visa | Steady | Cross-border commerce, network expansion |
Payment Gateway Types & Enterprise Adoption
The payment gateway market is segmented by deployment type, with hosted (cloud-based) solutions leading adoption. According to IMARC Group, hosted payment gateways command 68% of the U.S. market in 2025, reflecting merchant preferences for reduced infrastructure burden and faster time-to-market.
Self-hosted (on-premise) gateways remain relevant for large enterprises with specific security requirements or complex integration needs. API-hosted solutions are gaining traction among tech-savvy merchants seeking customization while maintaining cloud benefits.
By enterprise size, large enterprises currently represent the majority of payment gateway revenue, but small and medium enterprises (SMEs) are the fastest-growing segment. The democratization of payment technology and the rise of no-code integration options are enabling smaller merchants to access enterprise-grade payment infrastructure.
| Gateway Type | U.S. Market Share | Best For |
|---|---|---|
| Hosted (Cloud) | 68% | SMEs, rapid deployment, lower IT burden |
| Self-Hosted (On-Premise) | 22% | Large enterprises, specific compliance needs |
| API-Hosted | 10% | Tech-savvy merchants, customization needs |
Industry Benchmarks & KPIs
Payment success rate is the most fundamental KPI for any payment gateway—measuring how reliably transactions convert from attempted to completed. Industry benchmarks vary by region and payment method, but top-performing gateways achieve authorization rates above 95%.
According to BlueSnap, up to 40% of online sales are currently being lost due to shortcomings in payment gateway performance or friction in the checkout process. This represents a significant revenue recovery opportunity for merchants optimizing their payment stack.
Chargeback rates serve as a critical risk indicator. High-risk merchants typically pay 4-8% in processing fees compared to 2-3% for standard accounts. Every $1 of fraud costs U.S. merchants $4.61 in total losses when accounting for fees, operational costs, and merchandise replacement.
| KPI | Benchmark | Source |
|---|---|---|
| Payment Success Rate | 95%+ | Industry standard |
| Authorization Rate | 92-97% | IXOPAY |
| Chargeback Rate (Standard) | <0.9% | Card network guidelines |
| Chargeback Rate (High-Risk) | 1-3% | Swell |
| Processing Fees (Standard) | 2-3% | Industry average |
| Processing Fees (High-Risk) | 4-8% | Swell |
| Average Transaction Time | <3 seconds | Industry benchmark |
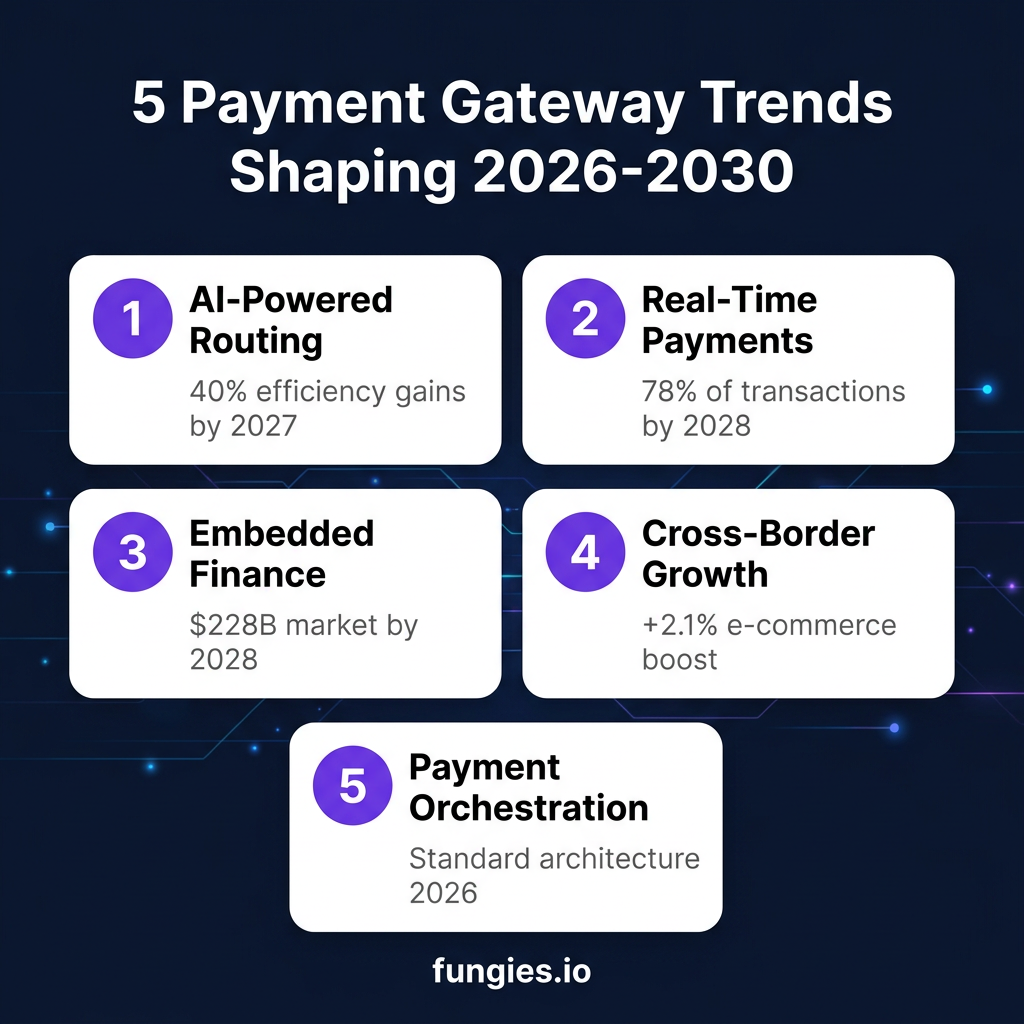
5 Payment Gateway Trends Shaping 2026-2030
Based on analysis from Mastercard, J.P. Morgan, GR4VY, and industry experts, these five trends will define the payment gateway landscape through 2030:
1. AI-Powered Payment Orchestration
In 2026 and 2027, AI models will increasingly decide which payment processor should handle each transaction, optimizing for cost, speed, and success probability. According to Getnet, 39% of consumers—and more than half of Gen Z—are already using AI tools for product discovery, signaling broader acceptance of AI-mediated commerce.
2. Real-Time Payments as Standard
Real-time payments are quickly becoming the norm rather than the exception. J.P. Morgan projects that instant payments will become a viable alternative to cards for international transactions, with infrastructure investments accelerating globally.
3. Embedded Finance Expansion
Embedded banking is perceived as highly valuable by treasury professionals, according to J.P. Morgan research. Payment gateways are evolving from standalone services to embedded components within SaaS platforms, marketplaces, and vertical software solutions.
4. Cross-Border E-Commerce Growth
Mordor Intelligence identifies cross-border e-commerce growth as a key driver, contributing +2.1% to market expansion in Europe and North America, with South America emerging as the next frontier. Payment gateways that simplify multi-currency acceptance and local payment methods will capture disproportionate value.
5. Agentic Commerce & Automated Payments
Agentic commerce—where AI agents make purchases on behalf of consumers—will expand significantly in 2026. This shift requires new payment infrastructure with robust authentication controls, spending limits, and audit trail monitoring to ensure security and compliance.
Methodology
This report compiles data from authoritative market research firms including Grand View Research, Mordor Intelligence, Global Market Insights, Fortune Business Insights, Research and Markets, and IMARC Group. Market size figures represent the most recent available estimates as of July 2026.
Figures vary across sources due to differing methodologies, geographic scopes, and market definitions. Grand View Research and Global Market Insights focus on gateway technology revenue, while broader payment processing estimates may include ancillary services. Regional breakdowns are derived from Grand View Research’s geographic segmentation.
Growth projections (CAGRs) are based on analyst forecasts considering factors including e-commerce penetration, digital payment adoption, regulatory developments, and technological advancement. All currency figures are in USD unless otherwise specified.
Frequently Asked Questions
What is the size of the payment gateway market in 2026?
The global payment gateway market is projected to reach $58.77 billion in 2026 according to Grand View Research, representing approximately 22% year-over-year growth from $48.17 billion in 2025. Alternative estimates from Global Market Insights place the 2026 market at $35.6 billion.
Which region has the largest payment gateway market share?
North America leads with 34.7% of global payment gateway market revenue in 2025, driven by mature digital infrastructure and high e-commerce adoption. However, Asia-Pacific is the fastest-growing region, fueled by mobile-first payment adoption and expanding e-commerce markets.
What is the average payment gateway processing fee?
Standard merchant accounts typically pay 2.9% + $0.30 per transaction, though high-risk merchants may pay 4-8%. Enterprise merchants with significant volume can negotiate rates below 2.5%. Additional fees may include monthly gateway fees ($25-50), chargeback fees ($15-25), and PCI compliance fees.
What is a good payment success rate benchmark?
Top-performing payment gateways achieve authorization rates above 95%. A healthy payment success rate indicates reliable transaction processing, while rates below 90% suggest issues with gateway configuration, fraud filtering, or acquirer relationships that require attention.
How fast is the payment gateway market growing?
The payment gateway market is growing at a CAGR of 14-23% depending on the source and forecast period. Grand View Research projects the highest growth at 22.7% CAGR through 2033, while more conservative estimates range from 12.78% to 14.42%.
Sources & Citations
- Grand View Research – Payment Gateway Market Size & Share Report, 2026-2033: https://www.grandviewresearch.com/industry-analysis/payment-gateway-market
- Mordor Intelligence – Payment Gateway Market Size & Trends: https://www.mordorintelligence.com/industry-reports/payment-gateway-market
- Global Market Insights – Payment Gateway Market Analysis: https://www.gminsights.com/industry-analysis/payment-gateway-market
- Fortune Business Insights – Payment Gateway Market Size: https://www.fortunebusinessinsights.com/payment-gateway-market-111411
- Research and Markets – Payment Gateway Market Report 2026: https://www.researchandmarkets.com/reports/5865944/payment-gateway-market-report
- IMARC Group – US Payment Gateway Market: https://www.imarcgroup.com/united-states-payment-gateways-market
- Yahoo Finance – Payment Gateway Market Opportunity Report 2026: https://sg.finance.yahoo.com/news/payment-gateway-market-opportunity-report-093600492.html
- GlobalData/Electronic Payments International – Top 20 Global Payment Companies: https://www.electronicpaymentsinternational.com/news/top-20-global-payments-companies-revenue-rises-8percent
- J.P. Morgan – Payments Outlook: Five Trends Powering Payments in 2026: https://www.jpmorgan.com/insights/payments/trends-innovation/payments-outlook-trends-2026
- Mastercard – The Future of Payments: Six Industry Trends Shaping 2026: https://www.mastercard.com/us/en/news-and-trends/stories/2025/2026-payment-trends.html
- GR4VY – Global Payment Trends for 2026 and 2027: https://gr4vy.com/posts/global-payment-trends-for-2026-and-2027-whats-changing-next
- Getnet – The Future of Payments, 2026 Vision: https://www.getnetworld.com/content/dam/getnetworld/documents/white-papers/Getnet_Key%20Payments%20Trends_2026.pdf
- BlueSnap – Payment Process Performance KPIs: https://www.bluesnap.com/payment-metrics
- Swell – High-Risk Payment Gateway Statistics: https://www.swell.is/content/high-risk-payment-gateway-statistics
Last updated: July 1, 2026. Data represents the most recent available market research as of publication date.