Digital Goods Tax Statistics 2026: Global VAT, Compliance Costs & Digital Services Tax (Comprehensive Report)
The taxation of digital goods has become one of the most complex challenges facing global businesses in 2026. With the EU VAT gap reaching €128 billion and 25 US states now taxing SaaS products, understanding digital tax obligations isn’t optional—it’s a business imperative. This comprehensive report presents 40+ verified statistics on digital goods taxation, from VAT compliance gaps to Digital Services Tax revenues, giving you the data you need to navigate this evolving landscape.
Key Statistics at a Glance
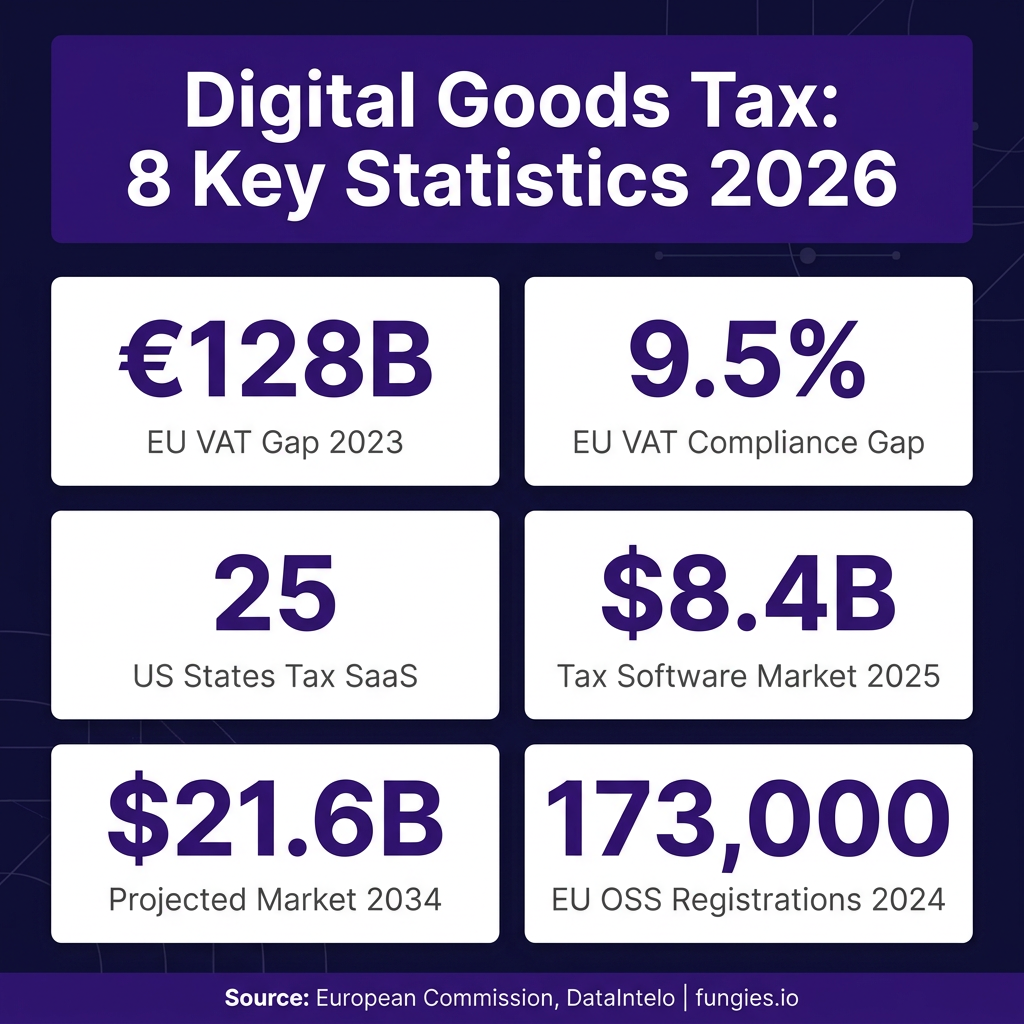
- €128 billion — EU VAT compliance gap in 2023 (9.5% of total VAT liability)
- 25 US states — now tax SaaS in some form (up from 22 in early 2024)
- $8.4 billion — Global indirect tax compliance software market size (2025)
- $21.6 billion — Projected tax compliance software market by 2034 (11.1% CAGR)
- 173,000 — EU One-Stop Shop (OSS) registrations by end of 2024
- €1.5 billion — DST revenue collected by Austria, France, Italy, and Spain in 2023
- $97.6 billion — Annual compliance costs for US companies from EU digital regulations
- €10,000 — EU-wide threshold for cross-border B2C digital sales
- 100+ countries — now require foreign sellers to register for VAT/GST
- $536 billion — Annual US tax compliance cost (7.1 billion hours)
Market Size & Growth: The Digital Tax Compliance Industry
The global tax management software market has emerged as a critical infrastructure sector for the digital economy. According to Grand View Research, the market was valued at $23.9 billion in 2025 and is projected to reach $55.6 billion by 2033, growing at a compound annual growth rate (CAGR) of 11.3%. This growth is driven by escalating regulatory complexity, the proliferation of e-invoicing mandates, and the widespread adoption of cloud-native tax automation platforms.
The indirect tax compliance software segment—specifically focused on VAT, GST, and sales tax—was valued at $8.4 billion in 2025 and is projected to reach $21.6 billion by 2034, expanding at a CAGR of 11.1% according to DataIntelo. This segment specifically addresses the needs of businesses selling digital goods and services across multiple jurisdictions.
By component, the software segment dominated the market with 73% share in 2025, while professional services accounted for the remaining 27%. Cloud deployment models are gaining significant traction, with organizations increasingly preferring SaaS-based tax solutions over on-premises installations for their scalability and real-time update capabilities.
The Tax Tech Market, which includes AI and machine learning capabilities for tax automation, was valued at $20.13 billion in 2025 and is expected to reach $66.05 billion by 2035, growing at a CAGR of 12.62% according to SNS Insider. This rapid growth reflects the increasing need for automated solutions to handle complex, multi-jurisdictional tax compliance requirements.
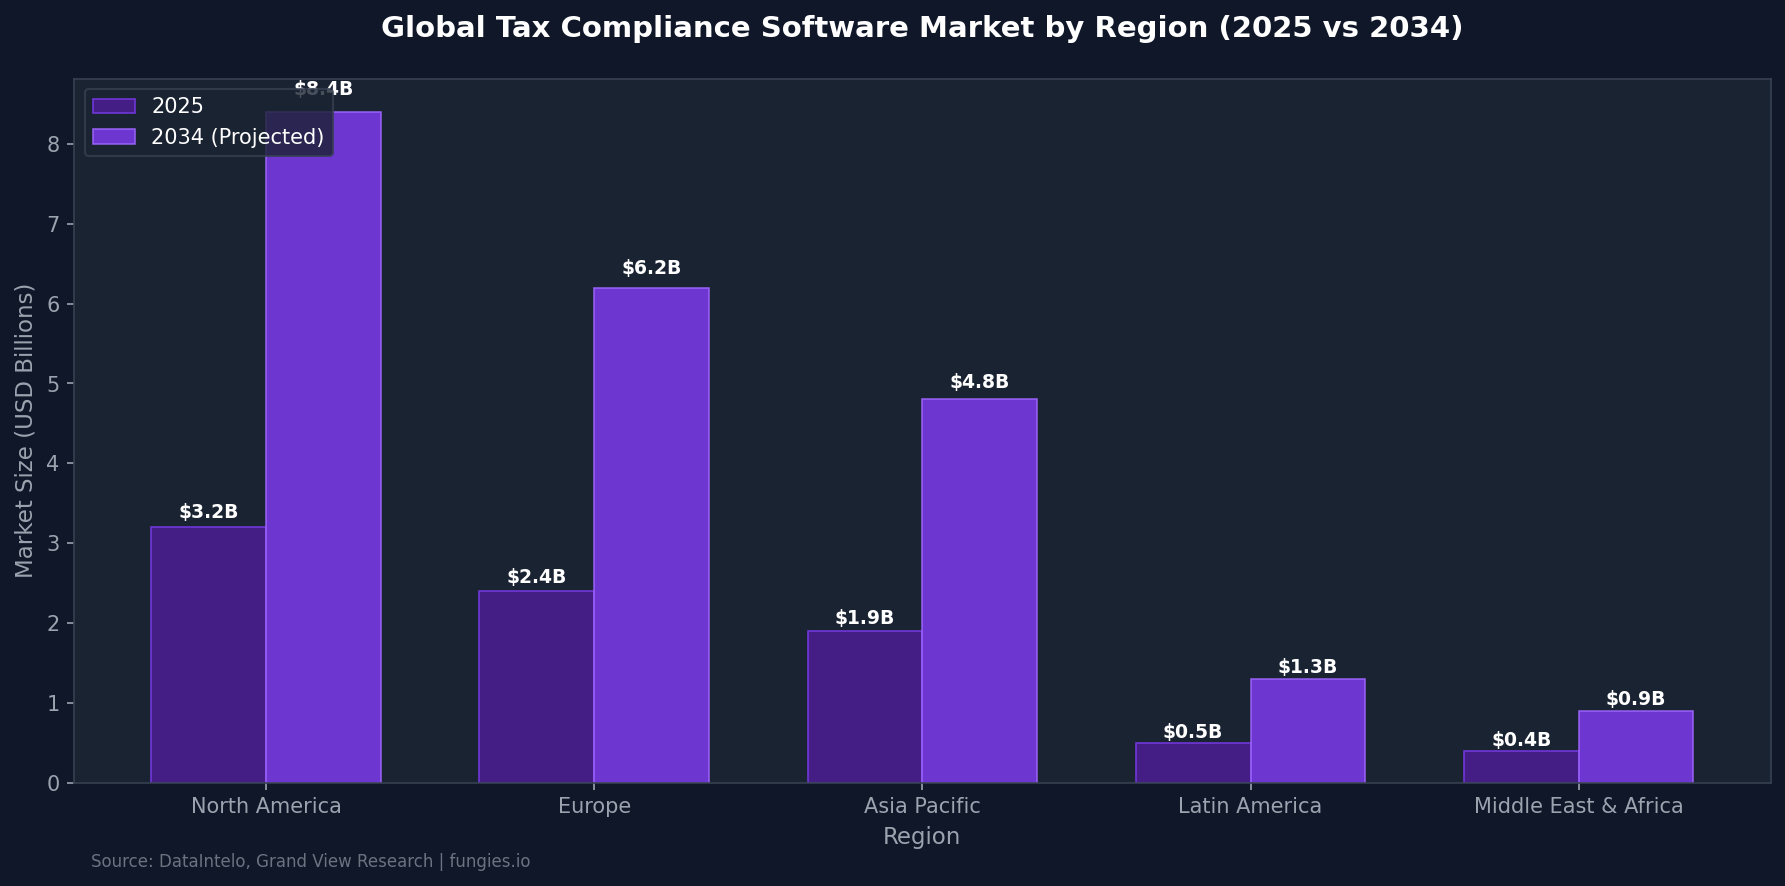
Regional breakdowns reveal North America leading the market with approximately $3.2 billion in 2025, followed by Europe at $2.4 billion and Asia Pacific at $1.9 billion. By 2034, North America is projected to reach $8.4 billion, maintaining its position as the largest market for tax compliance software. The Asia Pacific region shows the fastest growth trajectory, driven by rapid digitalization in countries like India, China, and Southeast Asian markets.
| Market Segment | 2025 Value | 2034 Projection | CAGR |
|---|---|---|---|
| Global Tax Management Software | $23.9 billion | $55.6 billion | 11.3% |
| Indirect Tax Compliance Software | $8.4 billion | $21.6 billion | 11.1% |
| Tax Tech Market (AI/RPA enabled) | $20.1 billion | $66.0 billion | 12.6% |
| Tax Compliance Software (all types) | $22.5 billion | $75.9 billion | 12.9% |
The EU VAT Gap: A €128 Billion Challenge
The European Commission’s 2025 VAT Gap Report reveals a concerning trend in tax compliance. The EU VAT compliance gap—the difference between expected VAT revenue and actual collections—increased to €128 billion in 2023, representing approximately 9.5% of total VAT liability. This marks a significant increase from €101 billion (7.9%) in 2022, representing a year-over-year growth in the gap of €27 billion.
The VAT gap is attributed to several factors: fraud (including missing trader intra-community fraud), tax evasion, tax avoidance, bankruptcies, insolvencies, and administrative errors. The report also introduces the “VAT policy gap” for the first time—representing revenue foregone due to reduced rates and exemptions—which increased from 26.1% in 2022 to 27.1% in 2024.
Country-level variations are substantial. Romania recorded the highest compliance gap at 30%, followed by Malta at 24.2%, Poland at 16%, Lithuania at 15.1%, and Italy at 15%. At the other end of the spectrum, Austria achieved a remarkable 1% gap, with Finland at 3%, Cyprus at 3.3%, and Portugal at 3.6%. These variations point to differences in tax compliance culture, fraud prevention measures, and the performance of tax administrations across member states.
The European Commission’s “Mind the Gap” report, released alongside the VAT Gap analysis, provides a comprehensive assessment of tax gaps in the EU. According to the Commission, the findings “reveal critical insights into tax compliance challenges and policy choices, which impact fiscal sustainability and competitiveness.” The report emphasizes that closing the VAT gap is essential for maintaining public finances and ensuring fair competition among businesses.
| Country | VAT Compliance Gap | Estimated Loss (€ millions) |
|---|---|---|
| Romania | 30.0% | €8,900 |
| Malta | 24.2% | €340 |
| Poland | 16.0% | €9,200 |
| Lithuania | 15.1% | €890 |
| Italy | 15.0% | €28,500 |
| Austria | 1.0% | €280 |
| Finland | 3.0% | €520 |
| Cyprus | 3.3% | €95 |
US Digital Goods Taxation: The Expanding State Patchwork
The United States presents a uniquely complex environment for digital goods taxation. Unlike the EU’s harmonized VAT system, the US operates a patchwork of state-level sales tax laws with no federal standard. As of 2025, SaaS is taxable in 25 US jurisdictions—a 14% increase from 22 jurisdictions at the beginning of 2024.
With approximately 50% of US states now taxing SaaS in some form, compliance complexity has reached unprecedented levels. Economic nexus thresholds—triggering tax obligations based on revenue or transaction volume rather than physical presence—vary significantly by state. Most states have aligned around a $100,000 annual revenue threshold or 200 transactions, though Alabama maintains a higher $250,000 threshold and California requires $500,000.
Louisiana enacted significant changes effective January 1, 2025, expanding sales tax to explicitly include SaaS, digital products, and information services. This follows a broader trend of states modernizing tax codes to capture revenue from the digital economy. According to the Sales Tax Institute, “the economic shift from a goods-based to a service-based economy has made it necessary for states to modernize their tax codes to avoid tax base erosion.”
The 2018 South Dakota v. Wayfair Supreme Court decision fundamentally changed the landscape by allowing states to require sales tax collection based on economic nexus rather than physical presence. This ruling has had profound implications for digital goods sellers, who may now have tax obligations in dozens of states despite having no physical operations there. As Anrok notes, “proactive compliance has never been more critical, especially for companies planning fundraising, M&A, or multi-state expansion.”
| State | Economic Nexus Threshold | SaaS Taxable |
|---|---|---|
| Alabama | $250,000 | Yes |
| Alaska | $100,000 or 200 transactions | Varies by locality |
| Arizona | $100,000 | Yes |
| Arkansas | $100,000 or 200 transactions | Yes |
| California | $500,000 | No (generally) |
| Colorado | $100,000 | Yes |
| Louisiana | $100,000 or 200 transactions | Yes (as of 2025) |
| New York | $500,000 and 100 transactions | Yes |
| Texas | $500,000 | Yes |
| Washington | $100,000 | Yes |
Digital Services Taxes (DST): The Transatlantic Tension
Digital Services Taxes represent one of the most contentious areas of international tax policy. These taxes target revenue from specific digital business activities—primarily online advertising, digital marketplaces, and data transmission—typically applied to large multinational tech companies.
According to research from CEPS and the Tax Foundation, four EU countries—Austria, France, Italy, and Spain—collected approximately $1.5 billion in DST revenues in 2023, with the majority coming from US-based companies. France alone generated €680 million from its 3% DST, while Italy collected €434 million, Spain €303 million, and Austria €103 million.
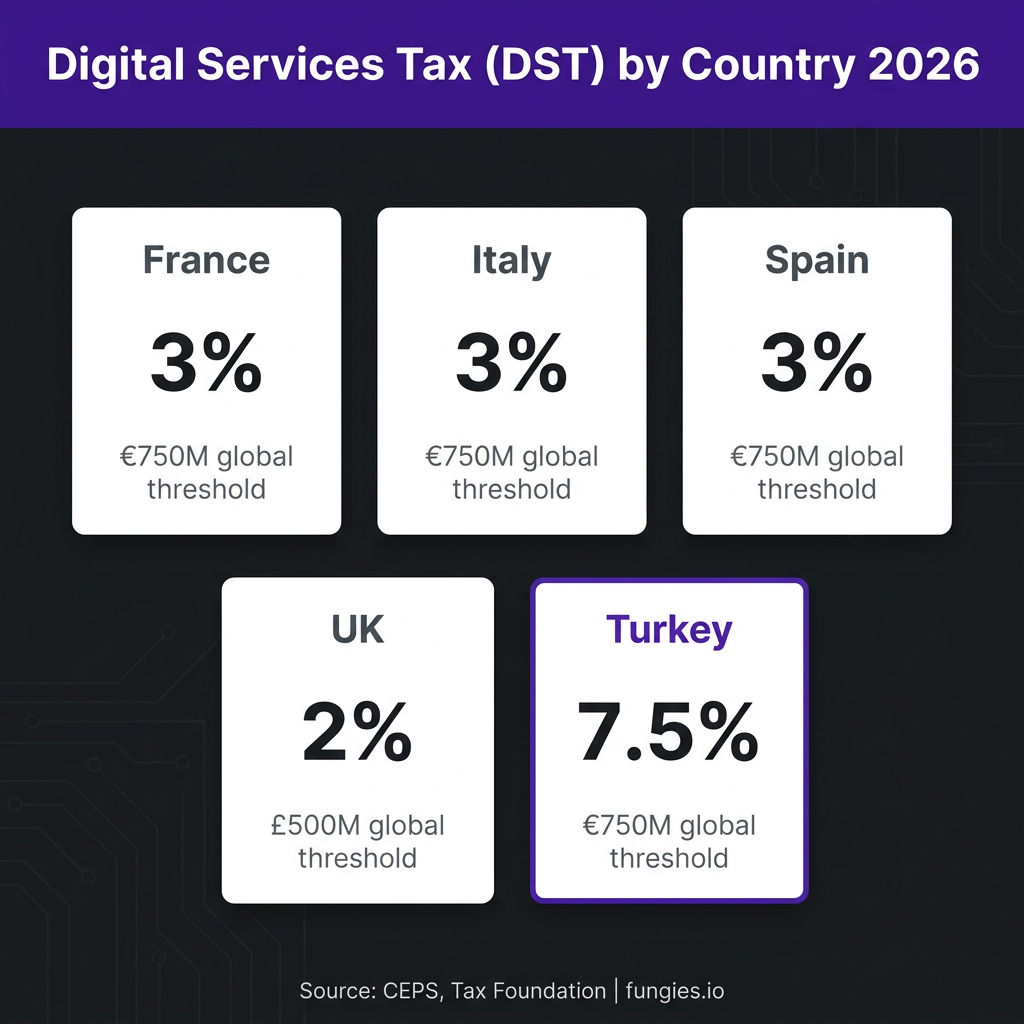
The DST landscape varies significantly by country. France applies a 3% tax on digital services revenue with thresholds of €750 million global revenue and €25 million French revenue. Italy and Spain also apply 3% rates with €750 million global thresholds, though domestic thresholds differ (€5.5 million for Italy, €3 million for Spain). The United Kingdom applies a 2% rate with a £500 million global threshold, while Turkey has the highest rate at 7.5%.
Austria’s DST differs from others in that it applies specifically to online advertising services at a 5% rate, rather than the broader base used by France, Italy, and Spain. Denmark’s DST applies only to streaming services, demonstrating the variety of approaches countries have taken.
The OECD’s Two-Pillar Framework was intended to replace unilateral DSTs with a coordinated approach, but implementation has stalled. As the Cato Institute observes, “It is now clear that the agreement was unworkable and undesirable.” The US Treasury has signaled it wants to reassess Pillar 1 “from first principles,” suggesting DSTs will remain in place for the foreseeable future.
| Country | DST Rate | Global Revenue Threshold | Domestic Threshold | 2023 Revenue |
|---|---|---|---|---|
| France | 3% | €750 million | €25 million | €680 million |
| Italy | 3% | €750 million | €5.5 million | €434 million |
| Spain | 3% | €750 million | €3 million | €303 million |
| Austria | 5% | €750 million | €25 million | €103 million |
| United Kingdom | 2% | £500 million | £25 million | Not disclosed |
| Turkey | 7.5% | €750 million | €20 million | Not disclosed |
Global VAT/GST on Digital Services: The 100+ Country Club
The global landscape for digital services taxation has expanded dramatically. According to Avalara and Bloomberg Tax, more than 100 countries now require foreign sellers to register for VAT or GST when serving local consumers. This represents a fundamental shift from the physical presence requirements that historically governed tax obligations.
The EU’s One-Stop Shop (OSS) system has emerged as a model for simplified compliance. By the end of 2024, approximately 173,000 businesses had registered with the OSS, with the vast majority using the Union scheme. The OSS allows businesses to register once, submit one quarterly return, and pay VAT due on cross-border B2C sales across all 27 EU member states through a single portal.
The EU’s uniform €10,000 threshold for cross-border digital sales applies to all member states. Below this threshold, businesses can apply their domestic VAT rate; above it, they must charge VAT based on the customer’s location. Non-EU businesses selling digital products to EU consumers remain liable for VAT regardless of sales volume.
Beyond the EU, countries continue to implement new digital tax regimes. Bhutan launched a new GST system on January 1, 2026, replacing its old sales tax regime. Brazil established new crypto-asset reporting obligations aligned with OECD standards. Australia will implement the Crypto-Asset Reporting Framework in 2027. These developments reflect a global trend toward greater transparency and compliance requirements for digital transactions.
According to KPMG’s tracking of digitalized economy taxation, numerous countries implemented DAC8 (Crypto-Asset Reporting Framework) rules in late 2025 and early 2026, including Austria, Belgium, Germany, France, Croatia, Cyprus, and Estonia. This coordinated implementation reflects the OECD’s broader efforts to increase transparency in digital transactions.
Industry Benchmarks: Compliance Costs and Complexity
The cost of tax compliance has become a significant business expense, particularly for companies operating across multiple jurisdictions. According to the Tax Foundation, Americans spend approximately $148 billion annually in out-of-pocket costs to comply with the tax code, plus an estimated 7.1 billion hours completing IRS paperwork—representing a total economic cost exceeding $536 billion annually.
For US companies operating in Europe, compliance costs are even more substantial. Research from the CCIA Research Center indicates that EU digital services regulation costs US companies up to $97.6 billion annually in compliance costs, revenue losses, and financial penalties. This figure includes not only tax compliance but also broader regulatory requirements such as the Digital Services Act and GDPR.
The introduction of Making Tax Digital (MTD) regimes in the UK and other jurisdictions represents another layer of compliance complexity. Under MTD for Income Tax, penalties for late filing follow a points-based system, with taxpayers receiving a £200 penalty when they reach the points threshold, plus additional £200 penalties for each subsequent failure.
According to the Low Incomes Tax Reform Group, the earliest late payment penalties under MTD for Income Tax could apply to tax payments due on January 31, 2028. This delayed implementation reflects the significant challenges businesses face in adapting to new digital reporting requirements.
| Compliance Metric | Value | Source |
|---|---|---|
| US annual tax compliance cost | $536 billion | Tax Foundation |
| US out-of-pocket compliance costs | $148 billion | OIRA/IRS |
| Annual compliance hours (US) | 7.1 billion hours | White House OIRA |
| EU digital regulation costs (US companies) | $97.6 billion | CCIA Research |
| MTD late filing penalty (UK) | £200 | HMRC |
| EU OSS registrations (2024) | 173,000 | EU Commission |
Trends & Predictions: The Future of Digital Taxation
Several major trends are shaping the future of digital goods taxation through 2030:
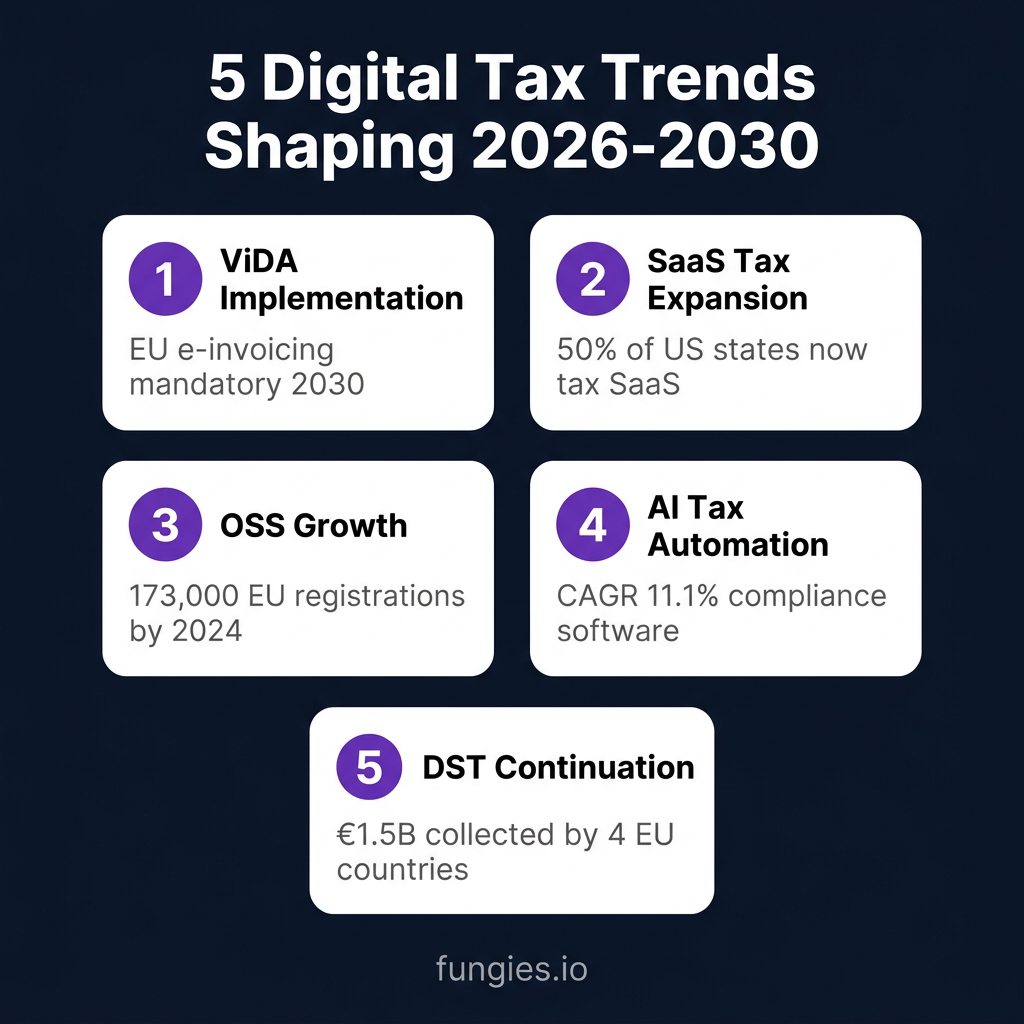
1. VAT in the Digital Age (ViDA) Implementation
The EU’s VAT in the Digital Age (ViDA) reforms, adopted by the Council of the European Union on March 11, 2025, represent the most significant overhaul of EU VAT rules in decades. From July 1, 2030, electronic invoicing (e-invoicing) in accordance with the European e-invoicing standard (EN 16931) will be mandatory for intra-Community transactions. This will require businesses to fundamentally restructure their invoicing and reporting systems.
2. Continued SaaS Tax Expansion in the US
The trend toward taxing digital services at the state level shows no signs of slowing. With 25 states now taxing SaaS and more considering similar legislation, businesses should expect compliance obligations to expand. States are increasingly looking to digital taxes as a way to modernize their tax bases and capture revenue from the growing digital economy.
3. AI-Powered Tax Automation
The tax tech market is increasingly driven by AI and machine learning capabilities. According to SNS Insider, the Tax Tech Market was valued at $20.13 billion in 2025 and is expected to reach $66.05 billion by 2035, growing at a CAGR of 12.62%. AI-powered solutions are becoming essential for managing the complexity of multi-jurisdictional tax compliance.
4. Digital Services Tax Continuation
Despite OECD efforts to implement a global framework through Pillar 1, Digital Services Taxes are likely to remain in place for the foreseeable future. The Cato Institute notes that “DSTs have reemerged as part of the transatlantic debate over how to tax the digital economy,” with the US Treasury signaling it wants to reassess Pillar 1 “from first principles.”
5. E-Invoicing Mandates Proliferation
From Brazil to Poland to South Africa, tax authorities are expanding the use of electronic invoices that make transaction data consistent and machine-readable. This enables automated collection of VAT and other indirect taxes while reducing fraud. By 2030, e-invoicing will likely be mandatory in most major economies.
Methodology
This report compiles data from authoritative sources including the European Commission’s VAT Gap Report 2025, the Tax Foundation, Grand View Research, DataIntelo, CEPS, CCIA Research Center, and official government publications. Statistics are drawn from reports published between 2024 and 2026, with a focus on verified, primary data sources.
Market size figures are based on analyst reports using consistent methodology across forecast periods. Tax rate and threshold data are verified against official government sources. Currency conversions use exchange rates current as of publication. Some figures may reflect most recent available data where 2026 figures are not yet published.
Frequently Asked Questions
What is the EU VAT gap?
The EU VAT gap is the difference between the VAT revenue that should be collected under full compliance and the amount actually collected by tax authorities. In 2023, this gap reached €128 billion, representing 9.5% of total VAT liability across EU member states.
How many US states tax SaaS products?
As of 2025, 25 US states tax SaaS (Software-as-a-Service) products in some form—up from 22 states in early 2024. This represents approximately 50% of US states, with more considering similar legislation.
What is the EU One-Stop Shop (OSS)?
The EU One-Stop Shop (OSS) is a simplified VAT reporting system that allows businesses to register once, submit one quarterly return, and pay VAT due on cross-border B2C sales across all 27 EU member states through a single portal. By end of 2024, approximately 173,000 businesses had registered.
What is a Digital Services Tax (DST)?
A Digital Services Tax is a tax on revenue from specific digital business activities, typically targeting large multinational tech companies. DSTs usually apply to online advertising, digital marketplaces, and data transmission services. Rates range from 2% (UK) to 7.5% (Turkey), with most EU countries applying 3%.
How much does tax compliance cost US businesses?
According to the Tax Foundation, Americans spend approximately $148 billion annually in out-of-pocket costs for tax compliance, plus 7.1 billion hours completing paperwork—representing a total economic cost exceeding $536 billion annually. For US companies operating in Europe, EU digital regulation compliance costs can reach $97.6 billion annually.
Sources & Citations
- European Commission. (2025). VAT Gap in Europe Report 2025. https://taxation-customs.ec.europa.eu/taxation/vat/fight-against-vat-fraud/vat-gap_en
- Grand View Research. (2026). Tax Management Software Market Size, Growth Report, 2026-2033. https://www.grandviewresearch.com/industry-analysis/tax-management-software-market-report
- DataIntelo. (2025). Indirect Tax Compliance Software Market Research Report 2034. https://dataintelo.com/report/indirect-tax-compliance-software-market
- Tax Foundation. (2026). Digital Services Taxes in Europe, 2026. https://taxfoundation.org/data/all/eu/digital-services-taxes-europe
- CEPS. (2025). Towards a European Digital Services Tax. https://cdn.ceps.eu/wp-content/uploads/2025/04/2025_04_FMI-Toward-a-European-digital-tax-1-1.pdf
- Anrok. (2026). 6 Sales Tax Statistics to Know Going Into 2026. https://www.anrok.com/resources/sales-tax-statistics
- CCIA Research Center. (2025). Costs to U.S. Companies from EU Digital Services Regulation. https://ccianet.org/research/reports/costs-to-us-companies-from-eu-digital-services-regulation
- Tax Foundation. (2025). Tax Complexity Costs the US Economy over $536 Billion Annually. https://taxfoundation.org/data/all/federal/irs-compliance-complexity-tax-costs
- Avalara. (2026). Global VAT and GST on Digital Services. https://www.avalara.com/us/en/vatlive/global-vat-gst-on-e-services.html
- Sales Tax Institute. (2025). The Expanding Digital Tax Net – How States are Taxing Digital Goods and Services in 2025. https://www.salestaxinstitute.com/resources/expanding-digital-tax-net-digital-goods-services-2025
- Banqup. (2026). EU Reaches Agreement on VAT in the Digital Age (ViDA). https://www.banqup.com/resources/blog/vat-in-the-digital-age-agreement-reached-a-milestone-in-the-eu-tax-digitalisation
- SNS Insider. (2025). Tax Tech Market Size, Share, Trends | Industry Report 2035. https://www.snsinsider.com/reports/tax-tech-market-8334
- Cato Institute. (2026). Digital Services Taxes at a Crossroads: European Perspectives. https://www.youtube.com/watch?v=RVDRxxH077k
- TaxJar. (2026). Sales Tax by State: Economic Nexus Laws. https://www.taxjar.com/sales-tax/economic-nexus
- 1StopVAT. (2025). European Commission VAT Gap Report 2025. https://1stopvat.com/european-commission-vat-gap-report-2025-eu-faces-billions-in-lost-vat-revenue
Last updated: June 26, 2026. Fungies.io helps game developers and SaaS companies handle global tax compliance automatically. Learn more at fungies.io.