The digital selling landscape has undergone a seismic transformation that few could have predicted even five years ago. In 2026, global e-commerce sales are projected to reach an astounding $6.88 trillion, representing a robust 7.2% year-over-year growth that shows no signs of slowing down despite economic headwinds, geopolitical tensions, and evolving consumer behaviors. For digital sellers—from independent creators selling their first digital download to enterprise marketplaces processing billions in transactions—this represents both unprecedented opportunity and increasingly intense competition.
What does it truly take to succeed as a digital seller in 2026? The rules have fundamentally changed. Consumer expectations have evolved beyond simple transactions to demand experiences, community, and values alignment. Technology has advanced to the point where artificial intelligence handles tasks that previously required entire teams. And the barriers between physical and digital commerce have all but disappeared, creating hybrid models that blur traditional categories. This comprehensive analysis examines the complete digital seller ecosystem: market size, key statistics, emerging trends, major players, challenges, opportunities, and what the future holds through 2030.

Market Overview: The $6.88 Trillion Digital Commerce Ecosystem
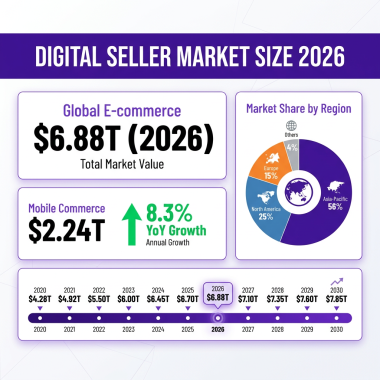
The digital seller market in 2026 represents one of the largest economic sectors globally, rivaling the GDP of major nations. With $6.88 trillion in projected sales, digital commerce now accounts for over 20% of total global retail sales—a figure that would have seemed impossible just two decades ago. This staggering number encompasses everything from individual creators selling $5 digital downloads on platforms like Gumroad and Whop, to enterprise B2B marketplaces processing billions in industrial equipment transactions.
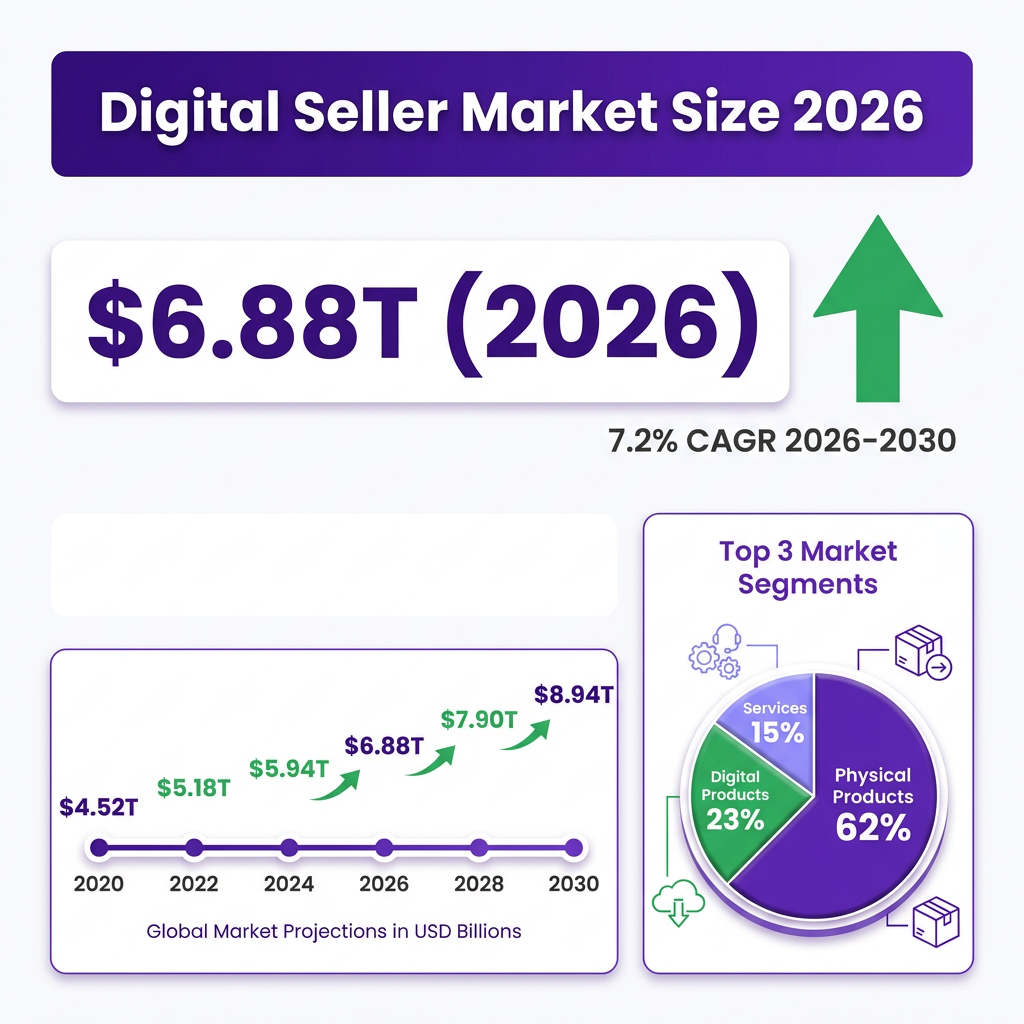
The market’s growth trajectory tells an equally compelling story of resilience and adaptation. From $5.7 trillion in 2022, the market has grown steadily despite facing unprecedented challenges including global inflation concerns, persistent supply chain disruptions, labor shortages, and shifting consumer spending patterns. The compound annual growth rate (CAGR) of 7.2% projected through 2030 suggests the market will exceed $9 trillion by the decade’s end, creating trillions in new opportunities for sellers who position themselves correctly.
Breaking down the market composition reveals important insights for digital sellers planning their strategies. Physical products still dominate with approximately 62% of total sales, but digital products and services represent the fastest-growing segments with significantly higher margins. Digital products alone—including online courses, digital templates, software licenses, ebooks, stock photography, music, and creative assets—generated an estimated $560 billion in 2025, with growth rates exceeding 12.5% annually, nearly double the overall e-commerce growth rate.
The B2B digital commerce segment deserves special attention from sellers considering their target markets. While B2C transactions often capture media headlines and public imagination, B2B digital sales reached $1.8 trillion in 2025, growing at nearly 20% annually—nearly triple the consumer market growth rate. This segment’s digital transformation accelerated dramatically during the pandemic and has maintained remarkable momentum as businesses of all sizes recognize the efficiency gains, cost savings, and competitive advantages of digital procurement and automated selling systems.
Geographic distribution of digital sales reveals both mature markets with high penetration and emerging markets with explosive growth potential. North America and Europe remain the largest markets by absolute volume, with mature infrastructure, high consumer spending power, and established digital shopping behaviors. However, Asia-Pacific leads in growth rates, with countries like India, Indonesia, Vietnam, and the Philippines experiencing digital commerce growth above 25% annually as internet penetration increases and middle classes expand. Cross-border selling has become a critical growth strategy for ambitious sellers, with 29% of digital sellers now reporting international sales as a significant revenue stream, up from just 12% in 2020.
Platform concentration remains a defining characteristic of the digital seller market, creating both opportunities and risks for participants. Amazon alone accounts for approximately 35.7% of all U.S. e-commerce sales, with its third-party seller community contributing an estimated $440 billion to Amazon’s marketplace gross merchandise value. This concentration gives sellers access to hundreds of millions of active shoppers but also creates dependency risks and margin pressures as platform fees increase and competition intensifies. However, platform diversification is accelerating as savvy sellers seek to reduce dependency risks and reach different customer segments through specialized marketplaces, independent storefronts, and social commerce channels.
Key Statistics and Data: Understanding the Digital Seller Landscape
Data-driven decision making separates successful digital sellers from those who struggle to gain traction. In an environment where margins can be thin and competition fierce, understanding the numbers behind the market is essential for strategic planning, resource allocation, and competitive positioning. Here are the key statistics every digital seller should know and understand in 2026:
Market Size and Growth Metrics: Global e-commerce sales will reach $6.88 trillion in 2026, representing growth from $6.42 trillion in 2025. The digital commerce platform market—encompassing the software and infrastructure that powers online selling—is growing at an impressive 19.1% CAGR, reflecting continued investment in selling technology and infrastructure. Mobile commerce has achieved dominance, accounting for 73% of all e-commerce sales, up from just 59% in 2021, making mobile optimization non-negotiable for serious sellers.
Digital Products Market Specifically: The digital products market reached $560 billion in global sales during 2025. Online courses and educational content generated $119 billion globally as professionals seek continuous learning and skill development. Digital templates, creative assets, and design resources sold through platforms like Etsy, Creative Market, and Gumroad exceeded $13.3 billion. Software and SaaS products represent the largest digital product category at $234.65 billion annually, with subscription models dominating revenue generation.
Seller Demographics and Scale: Amazon hosts over 9.5 million active sellers globally, with 2.5 million actively selling in the U.S. marketplace alone. Shopify powers over 4.5 million online stores across 175 countries. Etsy hosts 5.4 million active sellers, primarily in handmade and vintage categories. The average successful digital seller now operates across 2.8 different platforms simultaneously, recognizing that diversification reduces risk and expands reach.
Consumer Behavior Insights: 24.3% of all retail purchases now happen online, with this figure reaching 35%+ in developed markets. The average cart abandonment rate stands at 70.19%, representing billions in lost revenue that sellers address through retargeting and checkout optimization. Free shipping increases conversion rates by 47%, making it a powerful tool despite the cost. Product videos increase purchase likelihood by 85%, demonstrating the importance of multimedia content. 54% of consumers have made at least one purchase directly through social media platforms.
Platform Performance Metrics: Amazon’s third-party sellers generate $440 billion in annual sales, representing 60% of Amazon’s total GMV. Shopify merchants collectively processed $235.9 billion in gross merchandise volume in 2025. eBay’s active seller base of 18 million generated $74 billion in transactions. Walmart Marketplace grew 26.6% year-over-year, reaching $82 billion in third-party sales as sellers diversify beyond Amazon.
Profitability and Unit Economics: The average digital product profit margin ranges from 70-95%, compared to 20-40% for physical products, explaining the attraction of digital goods. Subscription-based digital products show 6.2% average monthly churn rates, with top performers achieving under 3%. Customer acquisition costs have risen 15% year-over-year across major advertising platforms, putting pressure on unit economics. The average customer lifetime value for digital sellers is $187, though top performers achieve $500+ through effective retention.
Marketing and Customer Acquisition: Email marketing delivers $42 ROI for every $1 spent, making it the highest-ROI channel for most sellers. SEO drives 53.3% of all website traffic for e-commerce sites, emphasizing the importance of search visibility. Paid advertising accounts for 39% of digital seller marketing budgets, though effectiveness varies widely. Influencer marketing generates $5.20 for every $1 invested when executed properly. Content marketing costs 62% less than traditional marketing while generating 3x as many leads.
Technology Adoption Rates: 67% of digital sellers now use AI-powered tools for product recommendations, with 23% higher conversion rates for those who do. 54% have implemented automated email marketing sequences. 43% use dynamic pricing algorithms to optimize revenue. 38% leverage chatbots for customer service, handling routine inquiries 24/7. 71% of high-performing sellers use analytics dashboards for data-driven decision making.
Payment and Checkout Optimization: Digital wallets (Apple Pay, Google Pay, PayPal) account for 49% of all e-commerce payments globally. Buy-now-pay-later (BNPL) options increase average order value by 45%, particularly for higher-priced items. One-click checkout reduces cart abandonment by 35% compared to multi-step processes. Local payment methods are supported by 78% of successful international sellers. Payment fraud costs digital sellers an estimated $48 billion annually, driving investment in fraud prevention.
Cross-Border Selling Statistics: 29% of digital sellers now report international sales as a meaningful revenue stream. Cross-border e-commerce represents $2.1 trillion in annual transaction volume. Currency conversion fees average 2.5-3.5% per transaction, eating into margins. VAT and sales tax compliance is cited as the #1 barrier to international expansion by 67% of sellers. Localization—including language, currency, and cultural adaptation—increases conversion rates by an average of 20%.
Major Trends Shaping Digital Selling in 2026
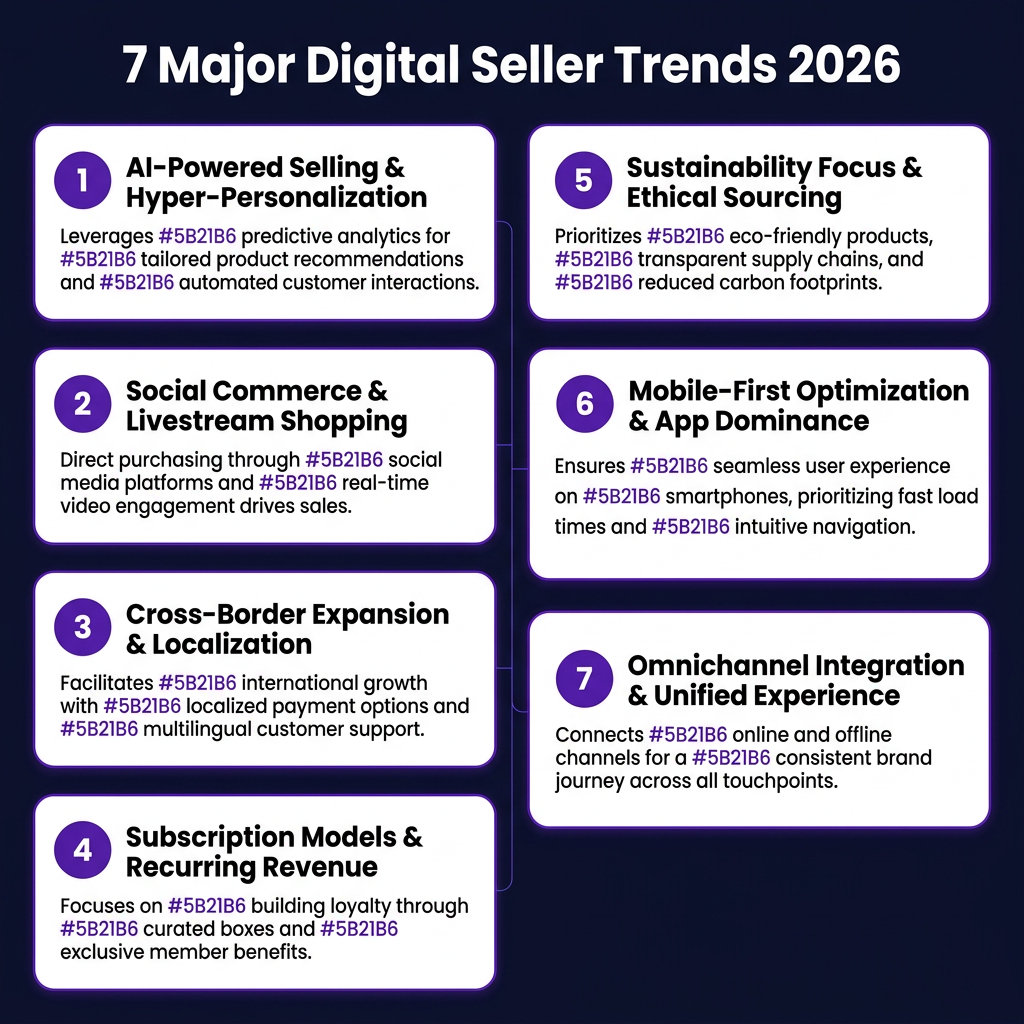
Seven major trends are fundamentally reshaping how digital sellers operate, compete, and grow their businesses. Understanding these trends—and more importantly, taking action on them—is essential for strategic positioning and long-term success in an increasingly competitive marketplace.
1. AI-Powered Selling and Intelligent Automation
Artificial intelligence has moved from experimental technology to essential business infrastructure. AI-powered tools now handle critical functions including personalized product recommendations, dynamic pricing optimization, customer service automation, marketing content generation, and demand forecasting. 67% of digital sellers now use AI for product recommendations, and those who do report 15-25% increases in average order value through improved relevance and timing.
Predictive analytics help sellers anticipate demand fluctuations, optimize inventory levels, identify trending products before competitors, and personalize marketing messages at scale. AI-generated product descriptions, email sequences, social media posts, and advertising copy have reached quality levels that match or exceed human-written content for many applications, dramatically reducing content production costs and time.
Chatbots and conversational AI now handle approximately 60% of customer service inquiries for leading digital sellers, reducing response times from hours to seconds while freeing human agents to focus on complex issues requiring empathy and judgment. Voice commerce, powered by AI assistants like Alexa and Google Assistant, now accounts for $40 billion in annual sales and is growing rapidly as smart speaker adoption increases.
2. Social Commerce and Live Selling Experiences
Social media platforms have evolved from marketing and awareness channels to complete selling ecosystems that handle the entire transaction. Instagram Shopping, TikTok Shop, Facebook Marketplace, Pinterest Shopping, and Snapchat’s commerce features now enable end-to-end transactions without customers ever leaving the platform. 54% of consumers have made at least one purchase directly through social media, with this figure reaching 70%+ among younger demographics.
Live selling—real-time video streams where sellers demonstrate products, answer questions, and take immediate orders—has exploded in popularity globally. Popular in Asian markets for years through platforms like Taobao Live and Douyin, live selling generated $480 billion globally in 2025 and is growing 35% annually in Western markets as platforms invest heavily in the format. Conversion rates for live selling events average 10-15%, compared to 2-3% for traditional e-commerce, making it extraordinarily effective when executed well.
Creator-led commerce blurs the traditional line between influencer marketing and direct selling. Creators with engaged audiences can launch product lines, sell digital products, and offer services directly to followers, bypassing traditional retail entirely and capturing higher margins. This trend has given rise to platforms like Whop, Stan Store, Beacons, and Koji that enable creators to monetize their audiences through multiple revenue streams from a single link.
3. Cross-Border Expansion and True Localization
Digital sellers increasingly look beyond their home markets for growth opportunities, recognizing that cross-border e-commerce represents access to billions of potential customers. Cross-border e-commerce now represents $2.1 trillion in annual transaction volume and offers significant growth potential for sellers willing to invest in international capabilities.
However, success requires far more than simply accepting international orders and shipping overseas. True localization—adapting language, currency, payment methods, cultural references, customer service, and marketing for specific markets—increases conversion rates by 20% on average and reduces returns and complaints. Leading sellers create market-specific storefronts with local domain names, customer service in local languages, payment methods preferred in each region, and marketing that resonates culturally.
Tax compliance remains the primary barrier to international expansion for most sellers. VAT in Europe, GST in Australia and New Zealand, sales tax in the U.S. (with 45 states having different rates and rules), consumption tax in Japan, and emerging digital services taxes each have unique requirements, registration processes, and filing obligations. Merchant of Record services like Fungies.io, Paddle, and Lemon Squeezy have emerged specifically to handle this complexity, allowing sellers to expand globally without building internal tax expertise or registering in dozens of jurisdictions.
4. Subscription and Recurring Revenue Models
The subscription economy continues to expand across product categories, business models, and price points. Software-as-a-Service (SaaS) leads with $234.65 billion in annual revenue, but subscription models have spread to physical products (subscription boxes, replenishment services), content (streaming, newsletters, podcasts), education (course memberships, coaching), and professional services. The predictability of recurring revenue makes businesses more valuable, easier to scale, and more resilient to market fluctuations.
Hybrid models combining one-time purchases with optional subscriptions are gaining significant traction. A customer might buy a fitness device once, then subscribe to premium workout content, personalized nutrition plans, and community access. This approach maximizes initial revenue while building long-term relationships and increasing customer lifetime value.
Subscription management has become increasingly sophisticated, with AI-powered churn prediction identifying at-risk customers before they cancel, personalized retention offers based on individual behavior, dynamic pricing based on usage patterns, and seamless upgrades and downgrades. The best subscription businesses achieve negative churn—revenue from existing customers grows faster than revenue lost to cancellations through expansions, upsells, and cross-sells.
5. Sustainability and Ethical Commerce Practices
Environmental and social responsibility increasingly influence purchase decisions, particularly among younger consumers who represent the future of the market. 73% of consumers say they would change their consumption habits to reduce environmental impact, and 66% are willing to pay more for sustainable products. Digital sellers respond with carbon-neutral shipping options, sustainable packaging materials, ethical sourcing certifications, transparent supply chains, and corporate social responsibility initiatives.
For digital product sellers, sustainability manifests differently but matters equally to conscious consumers. Energy-efficient hosting powered by renewable energy, carbon-neutral NFTs and blockchain transactions, ethical AI training data, and fair compensation for contributors are emerging concerns. Sellers who demonstrate genuine environmental responsibility build stronger customer loyalty, command premium pricing, and attract positive media coverage.
Certifications like B Corp, Climate Neutral, 1% for the Planet, and Fair Trade have become valuable marketing assets that differentiate sellers in crowded markets. Major platforms now highlight sustainable products in search results, dedicated sections, and special badges, giving certified sellers organic visibility advantages and conversion rate improvements.
6. Mobile-First and App-Based Selling
Mobile commerce dominance is now complete and irreversible. With 73% of e-commerce sales happening on mobile devices, sellers must optimize for small screens, touch interfaces, and on-the-go contexts or lose customers to competitors who do. This goes far beyond responsive design to include mobile-specific features like one-tap checkout, Apple Pay and Google Pay integration, mobile-optimized images and videos, and app-exclusive deals that incentivize downloads.
Progressive Web Apps (PWAs) offer app-like experiences—including offline browsing, push notifications, and home screen installation—without the friction of app store downloads and updates. Major sellers report 50% higher conversion rates on PWAs compared to traditional mobile websites, making them an attractive middle ground between websites and native apps.
Super apps—platforms combining shopping, payments, messaging, entertainment, and services in a single interface—dominate in Asian markets through platforms like WeChat, Alipay, and Grab, and are expanding globally. Sellers who integrate with super apps gain access to massive user bases, streamlined purchase flows, and reduced friction that drives conversion.
7. True Omnichannel Integration
The distinction between online and offline selling has permanently blurred. Successful sellers maintain presence across marketplaces (Amazon, eBay, Etsy, Walmart), social platforms (Instagram, TikTok, Facebook, Pinterest), their own branded websites, and physical retail locations where appropriate. Inventory, pricing, and customer data sync across all channels in real-time, creating consistent experiences regardless of how customers choose to shop.
Buy online, pick up in store (BOPIS), buy online, return in store (BORIS), and endless aisle capabilities (ordering online for in-store pickup) have become standard customer expectations rather than premium features. Unified commerce platforms enable these experiences while maintaining accurate inventory counts, preventing overselling, and preserving complete customer histories across all touchpoints.
Customer Data Platforms (CDPs) aggregate information from all channels—website, mobile app, in-store, marketplace, social—to create unified customer profiles. This enables truly personalized marketing, consistent service experiences, accurate attribution of marketing spend, and predictive analytics that anticipate customer needs before they arise.
Key Players and Competitive Landscape
The digital seller ecosystem comprises a complex web of platforms, tools, and service providers that enable selling at every scale from individual creators to multinational enterprises. Understanding the competitive landscape helps sellers choose the right partners, negotiate from positions of knowledge, and identify differentiation opportunities in crowded markets.
Marketplace Giants and Their Ecosystems
Amazon remains the dominant force in digital selling with 35.7% of U.S. e-commerce sales and significant presence in Europe, Japan, India, and other markets. Its third-party marketplace generated $440 billion in 2025, serving over 300 million active customer accounts globally. Amazon’s fulfillment network (FBA), advertising platform, Prime membership program, and logistics infrastructure create powerful advantages for sellers who can navigate the platform’s complexity and fee structure. However, increasing fees, intense competition, and policy enforcement have driven many sellers to diversify.
Shopify powers over 4.5 million online stores across 175 countries and processed $235.9 billion in gross merchandise volume in 2025. Unlike Amazon’s centralized marketplace, Shopify enables independent branded storefronts that sellers own and control. Its ecosystem includes thousands of apps for everything from email marketing to inventory management, payment processing to shipping logistics. Shopify Payments simplifies checkout while Shopify Fulfillment Network competes directly with Amazon FBA.
eBay maintains relevance with 18 million active sellers and $74 billion in annual sales across 190 markets. Its auction model differentiates it from fixed-price competitors, and its authentication services for luxury goods, sneakers, and collectibles create trust in high-value transactions. eBay’s focus on refurbished, pre-owned, and vintage items aligns with sustainability trends and attracts value-conscious consumers.
Walmart Marketplace has emerged as a serious Amazon competitor, growing 26.6% year-over-year to reach $82 billion in third-party sales. Lower fees, less competition than Amazon, and Walmart’s physical store network for returns and customer service give sellers compelling reasons to diversify. Walmart’s advertising platform and fulfillment services continue to improve, making it increasingly attractive for established sellers.
Etsy dominates handmade, vintage, and craft supplies with 5.4 million active sellers and 96 million active buyers. Its community-focused brand and search algorithm favor unique, handmade items over mass-produced goods, creating a differentiated market. Etsy’s acquisitions of Depop (fashion resale) and Elo7 (Brazilian handmade marketplace) expanded its reach into adjacent categories and geographic markets.
Digital Product Specialists and Creator Platforms
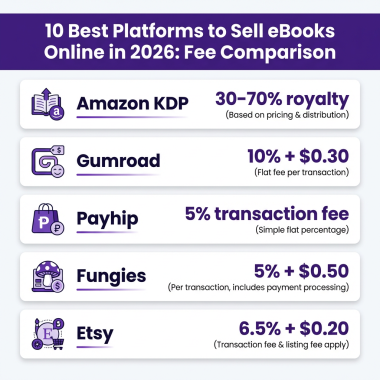
Gumroad serves creators selling digital products directly to their audiences with minimal friction. With simple setup, low fees (10% + processing), and built-in email marketing, Gumroad has become the platform of choice for independent writers, designers, developers, and educators. Its “Gumroad Discover” feature helps customers find new products, creating organic discovery opportunities for creators without marketing budgets.
Whop has grown rapidly as a marketplace specifically designed for digital products, particularly software, courses, communities, and subscriptions. Its focus on creator success, community building, and lower fees differentiates it from transaction-focused competitors. Whop’s research shows the digital products market reached $560 billion in 2025 and continues growing rapidly.
Teachable, Thinkific, and Kajabi dominate online course creation and sales. These platforms handle video hosting, payment processing, student management, progress tracking, and completion certificates, allowing creators to focus entirely on content quality. The online course market reached $119 billion in 2025, growing as professionals seek continuous learning, career advancement, and skill development.
Creative Market, Envato, and Adobe Stock serve designers, photographers, and creatives selling templates, graphics, stock photos, video footage, and creative assets. These marketplaces provide exposure to millions of potential buyers while handling licensing, delivery, and piracy protection. The template and creative asset market exceeded $13.3 billion in 2025.
Infrastructure and Service Providers
Stripe powers payments for millions of online businesses from startups to Fortune 500 companies. Its developer-friendly APIs, support for 135+ currencies, comprehensive feature set, and excellent documentation make it the default choice for custom e-commerce builds. Stripe Tax automates sales tax calculation and remittance across jurisdictions, while Stripe Atlas helps entrepreneurs incorporate and start businesses.
PayPal and Braintree remain widely used, particularly for consumer transactions where PayPal’s buyer protection and brand recognition increase conversion rates for unfamiliar sellers. Venmo integration appeals strongly to younger demographics, while PayPal Credit enables larger purchases through financing.
Merchant of Record services like Fungies.io, Paddle, and Lemon Squeezy handle the complexity of global tax compliance, payment processing, fraud prevention, and subscription management. For sellers expanding internationally, these services eliminate the need to register for VAT in dozens of countries, maintain complex tax infrastructure, or build payment systems from scratch.
Klaviyo, Mailchimp, Omnisend, and ConvertKit dominate email marketing for e-commerce. These platforms integrate with selling platforms to trigger automated sequences based on purchase behavior, cart abandonment, browsing history, and customer lifecycle stages. Email marketing delivers $42 ROI for every $1 spent, making these tools essential for profitable customer acquisition and retention.

Challenges and Pain Points
Despite the enormous opportunities, digital sellers face significant challenges that can make or break businesses. Understanding these pain points enables proactive mitigation strategies and informed decision-making about resource allocation and strategic priorities.
1. Rising Customer Acquisition Costs
Customer acquisition costs (CAC) have risen 15% year-over-year across major advertising platforms including Facebook, Instagram, Google, and TikTok. Apple’s iOS privacy changes significantly reduced targeting effectiveness on Facebook and Instagram, forcing advertisers to rely more on broad targeting and less on precise audience segmentation. Google Ads costs per click have increased as more sellers compete for limited ad inventory, particularly in high-value categories.
The solution requires diversification beyond paid advertising into channels with lower marginal costs. Search engine optimization (SEO), content marketing, email marketing, community building, and strategic partnerships offer lower CAC but require longer time horizons and consistent investment before yielding results. Successful sellers build organic traffic assets—email lists, social followings, search rankings—that reduce dependency on paid acquisition over time and improve overall unit economics.
2. Platform Dependency and Fee Pressure
Amazon has raised fulfillment fees, storage fees, referral fees, and advertising costs consistently over the past five years. Etsy increased transaction fees from 3% to 6.5% while adding payment processing fees and other charges. Shopify’s monthly plans have become more expensive, particularly for stores with high transaction volumes. Sellers who built businesses entirely on single platforms face significant margin compression as platforms optimize for their own profitability rather than seller success.
Platform policy changes can devastate businesses overnight with little recourse. Account suspensions, often automated and difficult to appeal, category restrictions that eliminate entire product lines, search algorithm updates that destroy organic visibility, and policy interpretations that retroactively prohibit previously acceptable practices have destroyed established sellers with years of history. Diversification across multiple platforms and building owned audiences through email lists and direct relationships mitigate this existential risk.
3. Tax Compliance Complexity
Digital sellers face tax obligations in every jurisdiction where they have customers, creating a compliance nightmare for businesses selling globally. U.S. sales tax applies in 45 states with varying rates, rules, and registration requirements. EU VAT requires registration, quarterly filings, and complex invoicing standards. Post-Brexit UK VAT adds complexity for European sellers. Canada, Australia, Japan, and emerging markets each have unique tax regimes for digital products and services.
Compliance costs include registration fees in multiple jurisdictions, accounting software capable of multi-jurisdictional reporting, professional services from tax accountants and lawyers, and significant time spent on filings and compliance activities. For small sellers, these costs can consume significant portions of revenue and create barriers to expansion. Merchant of Record services automate compliance but add percentage-based fees that scale with revenue, creating a different cost structure that sellers must factor into pricing.
Opportunities and Growth Strategies
Challenges create opportunities for sellers who adapt quickly and execute effectively. Here are the highest-impact growth strategies for digital sellers in 2026:
1. Strategic International Expansion
Cross-border selling opens access to billions of potential customers beyond home markets. English-speaking markets (UK, Canada, Australia, New Zealand) offer the easiest expansion path for U.S. sellers with minimal localization requirements. European markets provide high purchasing power and established digital commerce infrastructure but require VAT compliance and GDPR adherence. Asian markets offer massive scale and rapid growth but require significant localization, different platform strategies, and often local partnerships.
Success requires methodical market research, genuine localization beyond simple translation, reliable logistics and customer service, and patience during the market development phase. Start with one new market, perfect the operational model, achieve profitability, then replicate in additional markets. Use Merchant of Record services like Fungies.io to handle tax complexity while focusing internal resources on product-market fit, marketing, and customer experience.
2. Product Line Expansion and Bundling
Existing customers represent the cheapest source of new revenue. Analyze purchase data to identify complementary products that solve related problems. Bundle related items at slight discounts to increase average order value and simplify buying decisions. Create subscription offerings for consumable products or ongoing services. Launch premium versions with additional features, services, or status benefits.
Digital product sellers can expand through additional courses, templates, tools, software, and community memberships. Physical product sellers can add digital components—detailed assembly instructions, care guides, warranty registration apps, companion content—that improve customer experience at minimal marginal cost while creating additional touchpoints.
3. Community Building and Membership
Communities create defensible competitive advantages that transcend product features and price competition. Customers who feel belonging, recognition, and connection with a brand purchase more frequently, spend more per transaction, advocate for the brand to others, and remain loyal despite competitive offers. Discord servers, Facebook Groups, membership sites, exclusive content libraries, and community events create the infrastructure for genuine community.
Communities also generate invaluable product feedback, user-generated content that reduces marketing costs, and organic word-of-mouth marketing that outperforms paid channels. Customers helping other customers reduce support costs while improving satisfaction and creating social proof. The most successful digital sellers of 2026 and beyond will be community builders who happen to sell products, not merely transaction processors optimizing for conversion rates.
Case Studies and Success Stories
Case Study 1: From Side Hustle to $2M ARR Digital Product Business
A graphic designer working full-time at an agency began selling Notion templates on Gumroad in 2022 as a side project, earning just $200 in the first month. Through consistent content marketing on Twitter and LinkedIn sharing productivity tips and template previews, she built an audience of design professionals and productivity enthusiasts. By mid-2023, she had launched an email list that grew to 50,000 subscribers through lead magnets and valuable content.
Key strategies that drove growth: consistent content marketing establishing expertise, building an engaged email list of 50,000 subscribers, launching complementary products including courses and a paid community, strategically raising prices as reputation and quality improved, and expanding to multiple platforms including her own Shopify store. She now employs three full-time team members and has built a sustainable business generating $2 million in annual recurring revenue from digital products.
Case Study 2: Amazon to Omnichannel Success Story
A fitness equipment seller built a $5 million business exclusively on Amazon by 2023, leveraging Fulfillment by Amazon for logistics and Amazon Advertising for customer acquisition. When Amazon fees increased significantly and competition intensified with copycat products, the founder recognized the existential risk of platform dependency and began diversifying strategically.
The expansion strategy included launching a branded Shopify storefront to own customer relationships, expanding to Walmart Marketplace with lower fees and less competition, building a YouTube channel with workout content that attracted 200,000 subscribers, and launching a subscription box for workout supplements with recurring revenue. By 2026, Amazon represents just 40% of revenue (down from 100%), direct-to-consumer sales through Shopify account for 35%, and the subscription business contributes 25%. The business is now more profitable, more resilient, and valued significantly higher due to diversified revenue streams and owned customer relationships.
Case Study 3: B2B Digital Transformation Success
An industrial parts distributor with $20 million in traditional sales launched a B2B e-commerce platform in 2024, recognizing that their customers—maintenance managers and procurement professionals—increasingly preferred digital purchasing experiences. They invested heavily in integration capabilities, connecting their platform to customer ERP systems and implementing punchout catalogs that allowed large customers to purchase through their own procurement systems.
They offered net-30 terms through integrated financing partnerships, removing a key barrier that had prevented smaller customers from purchasing online. They built a comprehensive product information management system with detailed specifications, CAD drawings, and compatibility data that reduced customer service inquiries while improving search visibility. Online sales grew to $15 million by 2026, with 40% higher margins than traditional sales due to reduced overhead and automated processes. Their digital platform now attracts new customers who discovered them through industry-specific search terms and marketplaces, expanding their total addressable market beyond their traditional geographic footprint.
Future Outlook and Predictions (2026-2030)
The digital seller market will continue evolving rapidly through the remainder of this decade. Here are key predictions for how the landscape will change and the opportunities that will emerge:
Market Size Projections: Global e-commerce will exceed $9 trillion by 2030, maintaining the 7.2% CAGR that has characterized recent years. Digital products and services will represent an increasing share of total commerce as more categories digitize and consumers become comfortable purchasing intangibles. Cross-border e-commerce will grow to $3.5 trillion as logistics improve, payment friction decreases, and trust in international transactions increases.
AI Integration Deepens: By 2028, AI will handle 80% of customer service interactions, 60% of product photography and description creation, and 50% of marketing copy generation. Sellers who effectively leverage AI will operate with 30-40% lower overhead than competitors who rely on manual processes. AI-powered personalization will become so sophisticated that customers expect every interaction to be tailored to their preferences and history.
Platform Evolution: Social commerce will capture 30% of all e-commerce sales by 2030, up from 15% today. Super apps will expand from Asia to Western markets, consolidating shopping, payments, messaging, and entertainment. Voice commerce will grow to $150 billion as smart speaker adoption increases and natural language processing improves. Augmented reality will become standard for product visualization, particularly in furniture, fashion, and home improvement categories.
Regulatory Changes: Digital services taxes will spread to more jurisdictions as governments seek revenue from digital transactions. Data privacy regulations will tighten globally, requiring explicit consent for marketing communications and transparent data practices. Platform antitrust actions may force marketplace unbundling, creating new opportunities for independent sellers and specialized platforms. Sustainability reporting requirements will mandate disclosure of carbon footprints and supply chain practices.
Sustainability Becomes Standard: Carbon-neutral shipping will become the default expectation rather than a premium option. Blockchain-based supply chain transparency will enable consumers to verify product origins, authenticity, and environmental impact. Circular economy models—rental, resale, repair, and refurbishment—will capture 20% of market share in categories like fashion, electronics, and furniture. Sellers without sustainability credentials will face consumer backlash and competitive disadvantage.
Payment Innovation: Cryptocurrency payments will become mainstream for certain categories, particularly digital products and international transactions. Central Bank Digital Currencies (CBDCs) will launch in major economies, changing cross-border transaction dynamics. Biometric authentication—fingerprint, facial recognition, voice—will replace passwords for most purchases. Real-time payments will become standard, eliminating the delay between purchase and funds availability.
Key Takeaways
- The digital seller market reached $6.88 trillion in 2026, growing at 7.2% annually with projections to exceed $9 trillion by 2030
- Digital products specifically represent a $560 billion opportunity growing at 12.5% annually—nearly double the rate of physical goods
- AI-powered selling, social commerce, and cross-border expansion are the three most impactful trends reshaping digital selling in 2026
- Platform diversification and owned audience building through email lists and communities protect against fee increases and policy changes
- Tax compliance complexity remains the primary barrier to international expansion, solvable through Merchant of Record services like Fungies.io
- Community building creates defensible competitive advantages that transcend product features and price competition
- The sellers who thrive through 2030 will embrace AI for efficiency, build genuine customer relationships through community, and maintain flexibility across multiple platforms and channels
Sources and Citations
- Mordor Intelligence – Digital Goods Market Size, Share Analysis & Growth Report 2031: https://www.mordorintelligence.com/industry-reports/digital-goods-market
- Whop – 100+ Digital Products Statistics for 2026: https://whop.com/blog/digital-product-statistics
- Future Market Insights – Digital Commerce Platform Market Size & Growth 2026-2036: https://www.futuremarketinsights.com/reports/digital-commerce-platform-market
- Craftberry – Latest Global Ecommerce Statistics for 2025/2026: https://craftberry.co/articles/global-e-commerce-statistics
- SellersCommerce – Ecommerce Statistics In 2026: https://www.sellerscommerce.com/blog/ecommerce-statistics
- Nova Data – Amazon Seller Statistics 2026: https://novadata.io/resources/amazon-seller-statistics
- Seller Assistant – Amazon Statistics for Sellers in 2026: https://www.sellerassistant.app/blog/amazon-statistics-for-sellers-in-2026-key-insights
- Forbes Advisor – 35 Top E-Commerce Statistics: https://www.forbes.com/advisor/business/ecommerce-statistics
- Business Research Insights – Digital Platforms Market Size, Share, Growth Global Outlook 2035: https://www.businessresearchinsights.com/market-reports/digital-platforms-market
- CommerceTools – Pivotal Trends and Predictions in B2B Digital Commerce in 2026: https://commercetools.com/resources/whitepaper/pivotal-trends-and-predictions-in