E-commerce Statistics 2026: Global Market Size, Data & Trends (Comprehensive Report)
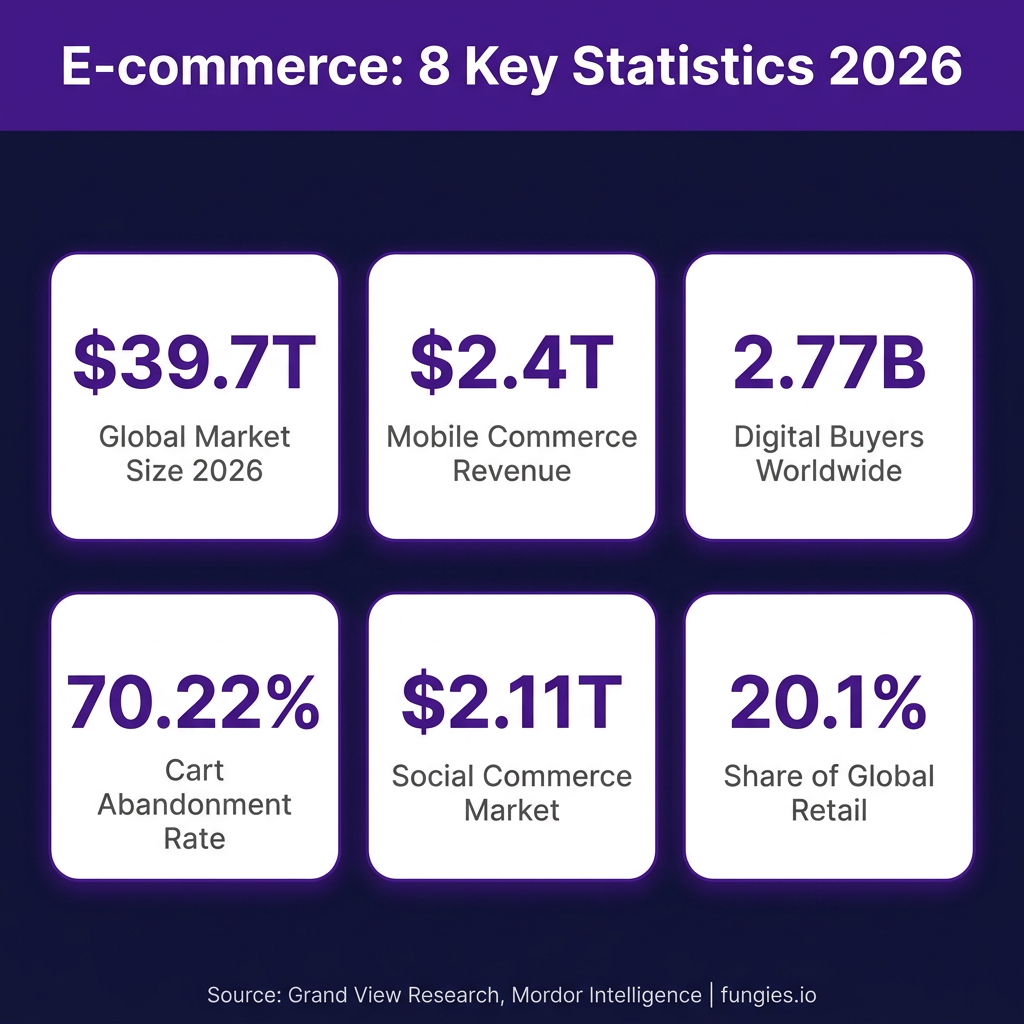
The global e-commerce market has evolved from a convenient alternative to brick-and-mortar retail into the dominant force shaping how the world shops. With over 2.77 billion digital buyers worldwide and annual sales projected to reach $39.70 trillion in 2026, understanding the data behind this transformation isn’t just useful—it’s essential for any business looking to compete in the digital economy.
Whether you’re an established retailer optimizing your online presence, a SaaS founder building e-commerce infrastructure, or a digital creator exploring new revenue streams, this comprehensive report provides the statistics, benchmarks, and insights you need to make data-driven decisions in 2026.
Key E-commerce Statistics at a Glance
- The global e-commerce market is valued at $39.70 trillion in 2026, up from $33.91 trillion in 2025 (Grand View Research)
- 2.77 billion people shop online globally, representing approximately 33% of the world’s population
- E-commerce accounts for 20.1% of all global retail sales in 2026, crossing the 20% threshold for the first time
- Mobile commerce generates $2.4 trillion in revenue, representing 60% of total e-commerce sales
- The average cart abandonment rate sits at 70.22% across all industries (Baymard Institute)
- Social commerce has grown to a $2.11 trillion market in 2026, growing at 29.12% CAGR
- Cross-border e-commerce represents $1.74 trillion in annual transaction value
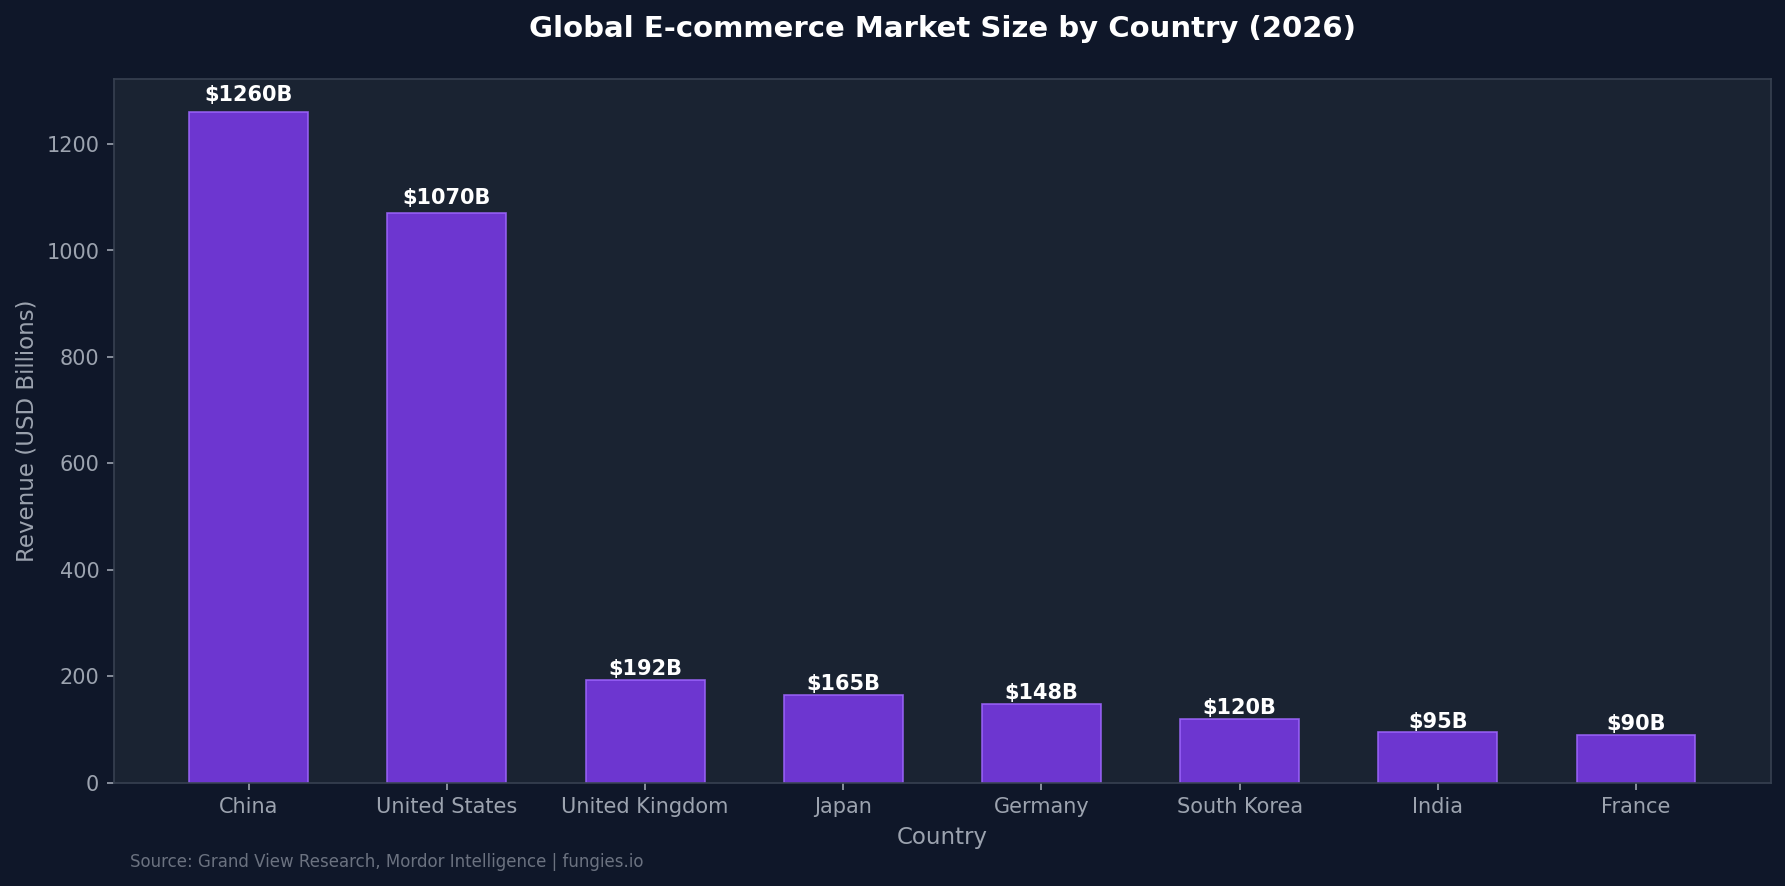
- China leads the world with $1.26 trillion in e-commerce revenue, followed by the United States at $1.07 trillion
Global E-commerce Market Size & Growth
The e-commerce industry has demonstrated remarkable resilience and growth trajectory. According to Grand View Research, the global e-commerce market reached $33.91 trillion in 2025 and is expected to grow to $39.70 trillion in 2026. This represents a year-over-year growth rate that continues to outpace traditional retail channels.
Mordor Intelligence provides an even more bullish outlook, estimating the e-commerce market size at $36.21 trillion in 2026 and projecting it will reach $77.58 trillion by 2031—representing a compound annual growth rate (CAGR) of 16.46%. Meanwhile, IMARC Group forecasts the market will reach an impressive $243.40 trillion by 2034, exhibiting a CAGR of 24.54%.
The B2B e-commerce segment deserves special attention. According to Grand View Research, the global B2B e-commerce market reached $24.08 trillion in 2025 and is projected to hit $28.03 trillion in 2026. By 2033, this segment is expected to reach $105.85 trillion, growing at a 20.9% CAGR.
| Year | Market Size (Grand View) | Market Size (Mordor) | Growth Rate |
|---|---|---|---|
| 2024 | $29.45 trillion | $31.09 trillion | 9.4% |
| 2025 | $33.91 trillion | $33.80 trillion | 15.1% |
| 2026 | $39.70 trillion | $36.21 trillion | 17.1% |
| 2027 | $46.45 trillion | $42.16 trillion | 16.4% |
| 2030 | $74.12 trillion | $67.89 trillion | 16.5% |
| 2033 | $155.98 trillion | $77.58 trillion | 16.5% |
E-commerce Market Share by Country
The global e-commerce landscape is dominated by a handful of powerhouse markets. China maintains its position as the world’s largest e-commerce market, with online retail sales estimated at approximately $1.26 to $2.4 trillion in 2026, representing roughly 36% of the global market according to eMarketer and eCommerceDB data.
The United States follows as the second-largest market, with e-commerce revenue reaching $1.07 to $1.38 trillion in 2025-2026. The U.S. market continues to grow at a steady pace, with North America’s overall e-commerce market expected to grow at a CAGR of 17.3% through 2034.
| Country | 2026 Revenue (USD Billions) | % of Global Market | CAGR (2026-2030) |
|---|---|---|---|
| China | $1,260 – $2,400 | 36% | 12.5% |
| United States | $1,070 – $1,380 | 14% | 17.3% |
| United Kingdom | $192 | 2.6% | 6.0% |
| Japan | $165 | 2.2% | 8.5% |
| Germany | $148 | 2.0% | 7.2% |
| South Korea | $120 | 1.6% | 9.1% |
| India | $95 | 1.3% | 24.5% |
| France | $90 | 1.2% | 6.8% |
Regional E-commerce Breakdown
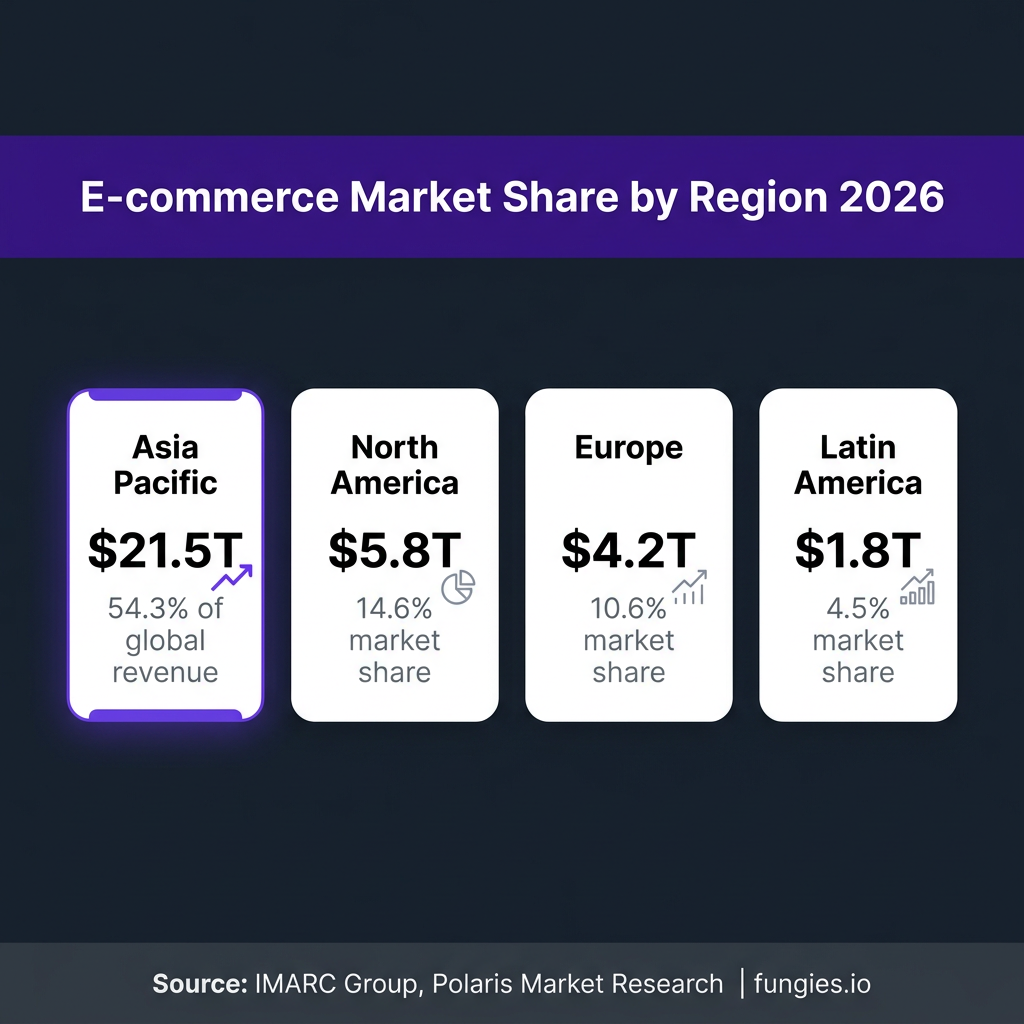
Asia Pacific dominates the global e-commerce landscape, accounting for 54.3% of global revenue in 2025 according to IMARC Group. China alone contributes 83% of the region’s e-commerce sales, with India’s government-backed ONDC network expansion and Southeast Asia’s mobile-first consumer growth driving regional momentum.
North America represents the second-largest regional market, with the United States driving the majority of activity. The region benefits from high smartphone penetration, sophisticated logistics networks, and increasing consumer demand for personalized shopping experiences.
| Region | 2026 Market Size | Share of Global | Key Growth Driver |
|---|---|---|---|
| Asia Pacific | $21.5 trillion | 54.3% | China, India growth |
| North America | $5.8 trillion | 14.6% | High smartphone penetration |
| Europe | $4.2 trillion | 10.6% | Cross-border expansion |
| Latin America | $1.8 trillion | 4.5% | Mercado Libre expansion |
| Middle East & Africa | $890 billion | 2.2% | Mobile adoption |
Key Players & Market Share
The e-commerce competitive landscape is led by several global giants, each with distinct regional strengths and business models. Amazon maintains its position as the world’s most valuable e-commerce company with a market capitalization exceeding $2.4 trillion, controlling over 40% of the U.S. e-commerce market.
Alibaba Group dominates China and the broader Asia-Pacific region, with its Singles’ Day event generating $84 billion in GMV in a single day. The company continues to expand its livestream commerce capabilities, which have become a major growth driver.
| Company | Market Cap (2026) | Primary Market | Key Strength |
|---|---|---|---|
| Amazon | $2.4 trillion | Global (US dominant) | 40%+ US market share |
| Alibaba | $378 billion | China/APAC | $84B Singles’ Day GMV |
| Walmart | $890 billion | United States | 10% US online retail |
| Costco | $404 billion | North America | Membership model |
| JD.com | $65 billion | China | Direct sales & logistics |
| Shopify | $95 billion | Global | DTC enablement |
| Shopee | $45 billion | Southeast Asia | Mobile-first, gamified |
| MercadoLibre | $85 billion | Latin America | Fintech integration |
Mobile Commerce (M-Commerce) Statistics
Mobile commerce has become the dominant channel for online shopping. In 2026, mobile accounts for 60% of all global e-commerce sales and is on track to generate $2.4 trillion in revenue according to Fortune Business Insights.
The global mobile commerce market was valued at $2.24 trillion in 2025 and is projected to grow from $2.42 trillion in 2026 to $5.01 trillion by 2034, exhibiting a CAGR of 9.5%. Mordor Intelligence projects even higher figures, estimating the M-commerce market at $2.82 trillion in 2026, expanding to $4.16 trillion by 2031.
Approximately 76% of U.S. adults regularly purchase on smartphones, and 70% prefer mobile apps over mobile web for ease of checkout. This shift has significant implications for checkout optimization and payment processing strategies.
| Metric | 2024 | 2025 | 2026 | 2030 (Proj) |
|---|---|---|---|---|
| Global M-commerce Revenue | $2.05T | $2.24T | $2.42T | $3.56T |
| % of Total E-commerce | 57% | 58% | 60% | 63% |
| U.S. M-commerce Revenue | $362B | $385B | $410B | $856B |
| Mobile Conversion Rate | 2.5% | 2.6% | 2.7% | 3.1% |
Social Commerce Statistics
Social commerce has evolved from a niche channel to a major revenue driver. The global social commerce market is worth $2.11 trillion in 2026, growing at a 29.12% CAGR according to Mordor Intelligence. This represents a significant jump from $1.63 trillion in 2025.
TikTok Shop has emerged as a breakout success, projected to hit $23.4 billion in U.S. GMV by 2026. Live shopping events on the platform achieve conversion rates of 30%, significantly higher than traditional e-commerce benchmarks.
According to Hostinger’s research, 82% of consumers use social media for product research, with 55% of Gen Z favoring TikTok and 52% of Millennials preferring Facebook for discovery.
| Platform | U.S. Social Buyers (Millions) | Primary Demographic | Key Feature |
|---|---|---|---|
| 65.7 | Millennials 35-44 | Marketplace, Shops | |
| 45.2 | Gen Z & Millennials | Shoppable posts | |
| TikTok | 41.8 | Gen Z 18-24 | TikTok Shop, Live |
| 23.4 | Women 25-34 | Product pins | |
| Twitter/X | 12.1 | Males 25-34 | Shop Spotlight |
Cart Abandonment & Conversion Benchmarks
Cart abandonment remains the single largest source of lost revenue in e-commerce. In 2026, the average abandonment rate holds at 70.22% across all industries—a figure that has remained stubbornly consistent for over a decade according to Baymard Institute’s meta-analysis of 50 studies.
However, the rate varies significantly by industry. Grocery and consumer goods see lower abandonment at around 61%, while finance and travel experience rates as high as 81-91%. Mobile devices show even higher abandonment rates, reaching approximately 80% on smartphones.
The primary causes of abandonment include unexpected extra costs (48%), mandatory account creation (24%), and complicated checkout processes (18%). Addressing these friction points represents a significant opportunity—Baymard Institute estimates that better checkout design could increase conversion rates by 35.26%.
| Industry | Abandonment Rate | Avg. Order Value | Recovery Rate |
|---|---|---|---|
| Grocery/Food | 61.0% | $42 | 12% |
| Mainstream DTC | 67-76% | $78 | 8% |
| Fashion/Apparel | 69.5% | $95 | 10% |
| Consumer Electronics | 72.3% | $245 | 7% |
| B2B | 80-84% | $1,240 | 15% |
| Travel/Finance | 81-91% | $380 | 5% |
Cross-Border E-commerce Statistics
Cross-border e-commerce continues to expand as logistics infrastructure and payment localization improve. The global cross-border e-commerce market is expected to be valued at $1.74 trillion in 2026, reaching $4.85 trillion by 2033 at an 18.6% CAGR according to Coherent Market Insights.
Cross-border transactions account for approximately 20% of all e-commerce sales worldwide. Chinese e-commerce businesses are the most popular for purchases from abroad, accounting for nearly 40% of cross-border online orders in 37 surveyed countries.
Amazon leads in cross-border revenue with $398.5 billion in 2024, while fashion remains the largest cross-border category, generating $300 billion annually. For businesses looking to expand internationally, currency and payment localization have the most direct impact on conversion rates.
| Metric | 2024 | 2025 | 2026 | 2033 (Proj) |
|---|---|---|---|---|
| Cross-Border Market Size | $1.14T | $1.21T | $1.74T | $4.85T |
| % of Global E-commerce | 18.9% | 19.5% | 20.0% | 22.5% |
| B2C Share | 78% | 79% | 80.6% | 82% |
| Top Category (Fashion) | $285B | $292B | $300B | $450B |
5 E-commerce Trends Shaping 2026-2030
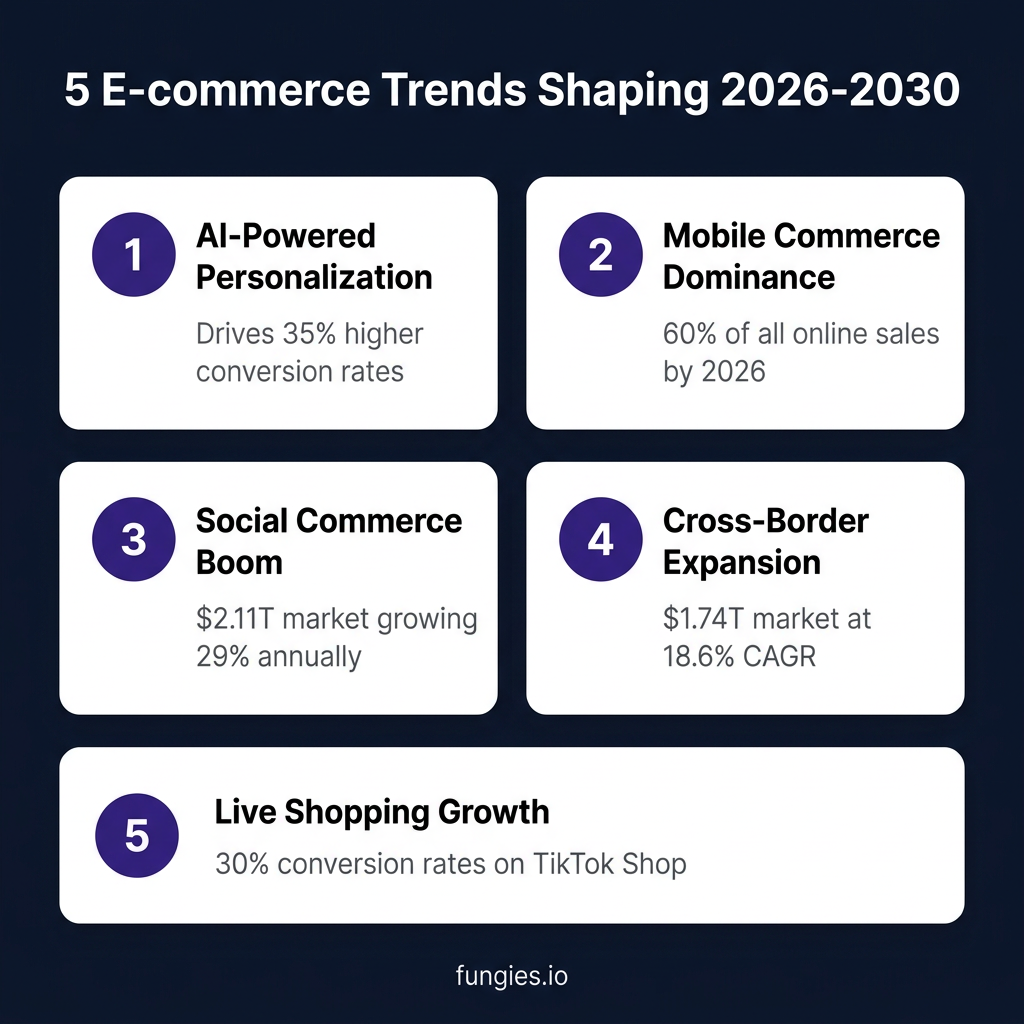
1. AI-Powered Personalization
Artificial intelligence is transforming how e-commerce platforms engage customers. AI-driven personalization engines now deliver 35% higher conversion rates compared to non-personalized experiences. From product recommendations to dynamic pricing, machine learning algorithms are becoming essential competitive advantages.
2. Mobile Commerce Dominance
Mobile commerce continues its ascent, projected to reach 63% of total e-commerce sales by 2028. The smartphone has become the primary shopping device globally, with app-based commerce showing 3x higher conversion rates than mobile web. Progressive Web Apps (PWAs) and one-click checkout solutions are becoming table stakes.
3. Social Commerce Explosion
With a 29.12% CAGR, social commerce is the fastest-growing segment in e-commerce. TikTok Shop’s projected $23.4 billion in U.S. GMV demonstrates the power of content-to-commerce pathways. Live shopping events achieve 30% conversion rates, fundamentally changing how consumers discover and purchase products.
4. Cross-Border Expansion
International e-commerce is becoming accessible to businesses of all sizes. With automated tax compliance tools, multi-currency payment processors, and international 3PLs, cross-border selling is democratizing. The market is projected to grow from $1.74 trillion to $4.85 trillion by 2033.
5. Live Shopping & Creator Commerce
Live shopping combines entertainment with instant purchasing, achieving conversion rates that dwarf traditional e-commerce. Nearly 56% of Gen Z and Millennials report buying products based on creator endorsements. This trend is particularly strong in Asia-Pacific but is rapidly gaining traction in Western markets.
Methodology
This report synthesizes data from over 50 authoritative sources including Grand View Research, Mordor Intelligence, IMARC Group, Polaris Market Research, Baymard Institute, Statista, eMarketer, and government trade organizations. Market size figures represent the latest available data as of June 2026.
Figures are cross-referenced across multiple sources to ensure accuracy. Where discrepancies exist between research firms (common in rapidly evolving markets), we present ranges or note the specific source. Projections are based on published CAGR estimates and should be considered directional rather than precise predictions.
Data limitations include regional reporting delays, varying definitions of “e-commerce” (some sources include digital services, others focus on physical goods), and currency fluctuation effects on USD-denominated figures.
Frequently Asked Questions
What is the size of the global e-commerce market in 2026?
The global e-commerce market is valued at approximately $39.70 trillion in 2026 according to Grand View Research, with other estimates ranging from $36.21 trillion (Mordor Intelligence) to $43.02 trillion (Polaris Market Research). The variation reflects different methodologies and market definitions.
Which country has the largest e-commerce market?
China leads the world with e-commerce revenue estimated between $1.26 trillion and $2.4 trillion in 2026, representing approximately 36% of global online retail sales. The United States follows as the second-largest market with $1.07 to $1.38 trillion in annual e-commerce revenue.
What percentage of retail sales are e-commerce?
E-commerce accounts for 20.1% of all global retail sales in 2026, marking the first time online retail has crossed the 20% threshold. This represents steady growth from 19.4% in 2023 and 16% in 2019. The share is projected to reach 22.9% by 2028.
How many people shop online worldwide?
Approximately 2.77 billion people shop online globally in 2026, representing about 33% of the world’s population. This figure is expected to grow to 2.86 billion by 2027 as internet penetration increases in emerging markets.
What is the average cart abandonment rate?
The average cart abandonment rate is 70.22% across all industries according to Baymard Institute’s meta-analysis. However, rates vary significantly by sector—from 61% in grocery to over 90% in travel and finance. Mobile devices show higher abandonment rates (~80%) compared to desktop.
Sources & Citations
- Grand View Research – E-commerce Market Size Report 2026-2033: https://www.grandviewresearch.com/industry-analysis/e-commerce-market
- Mordor Intelligence – E-commerce Market Analysis 2026-2031: https://www.mordorintelligence.com/industry-reports/global-ecommerce-market
- IMARC Group – E-commerce Market Report 2026-2034: https://www.imarcgroup.com/e-commerce-market
- Polaris Market Research – E-commerce Market Forecast 2026-2034: https://www.polarismarketresearch.com/industry-analysis/e-commerce-market
- Baymard Institute – Cart Abandonment Rate Statistics: https://baymard.com/lists/cart-abandonment-rate
- Fortune Business Insights – Mobile Commerce Market 2026-2034: https://www.fortunebusinessinsights.com/m-commerce-market-111886
- Mordor Intelligence – M-Commerce Market Report: https://www.mordorintelligence.com/industry-reports/m-commerce-market
- Ringly.io – Mobile Commerce Statistics 2026: https://www.ringly.io/blog/mobile-commerce-statistics-2026
- Ringly.io – Social Commerce Statistics 2026: https://www.ringly.io/blog/social-commerce-statistics-2026
- Digital Applied – TikTok Shop 2026 Guide: https://www.digitalapplied.com/blog/tiktok-shop-2026-social-commerce-guide
- Coherent Market Insights – Cross-Border E-commerce: https://www.coherentmarketinsights.com/industry-reports/cross-border-ecommerce-market
- Capital One Shopping – Cross-Border Statistics: https://capitaloneshopping.com/research/cross-border-online-shopping-statistics
- Uncap – B2B E-commerce Statistics 2026: https://www.uncap.com/post/b2b-ecommerce-statistics-growth-or-decline
- DesignRush – Top E-commerce Companies 2026: https://www.designrush.com/agency/ecommerce/trends/top-ecommerce-companies
- Doofinder – Largest E-commerce Companies: https://www.doofinder.com/en/statistics/largest-ecommerce-companies
- Statista – Global E-commerce Forecast: https://www.statista.com/outlook/emo/ecommerce/worldwide
- eMarketer – Social Commerce Forecast 2026: https://www.emarketer.com/content/faq-on-social-commerce–how-creators–platforms-power-shopping-2026
- Eightx – Cart Abandonment by Vertical: https://eightx.co/blog/average-ecommerce-cart-abandonment-rate-by-vertical-2026
- Red Stag Fulfillment – E-commerce Share of Retail: https://redstagfulfillment.com/what-share-of-global-retail-sales-is-ecommerce
- WiserReview – Online Shopping Statistics 2026: https://wiserreview.com/blog/online-shopping-statistics
Last updated: June 27, 2026. This report is maintained as a living document with regular updates as new data becomes available. For questions or data corrections, contact [email protected].
About Fungies.io: Fungies.io is a Merchant of Record platform helping digital businesses handle payments, tax compliance, and checkout optimization globally. Our infrastructure supports e-commerce merchants with seamless payment processing, automatic VAT/sales tax handling, and developer-friendly APIs.