E-commerce Statistics 2026: Market Size, Data & Trends (Comprehensive Report)
The global e-commerce market is projected to reach $6.88 trillion in 2026, representing an 8.3% year-over-year increase from 2025’s estimated $6.42 trillion. That’s not just a number—it’s a fundamental shift in how the world shops, sells, and transacts. Whether you’re a DTC brand founder, a SaaS company expanding into digital sales, or an analyst tracking retail transformation, understanding these figures isn’t optional. It’s survival.
In this comprehensive report, we’ve compiled verified data from eMarketer, Statista, Mordor Intelligence, Grand View Research, and other authoritative sources to give you the complete picture: market size projections through 2030, regional breakdowns, conversion benchmarks by industry, cart abandonment realities, and the trends that will define the next five years of digital commerce.
Key E-commerce Statistics at a Glance
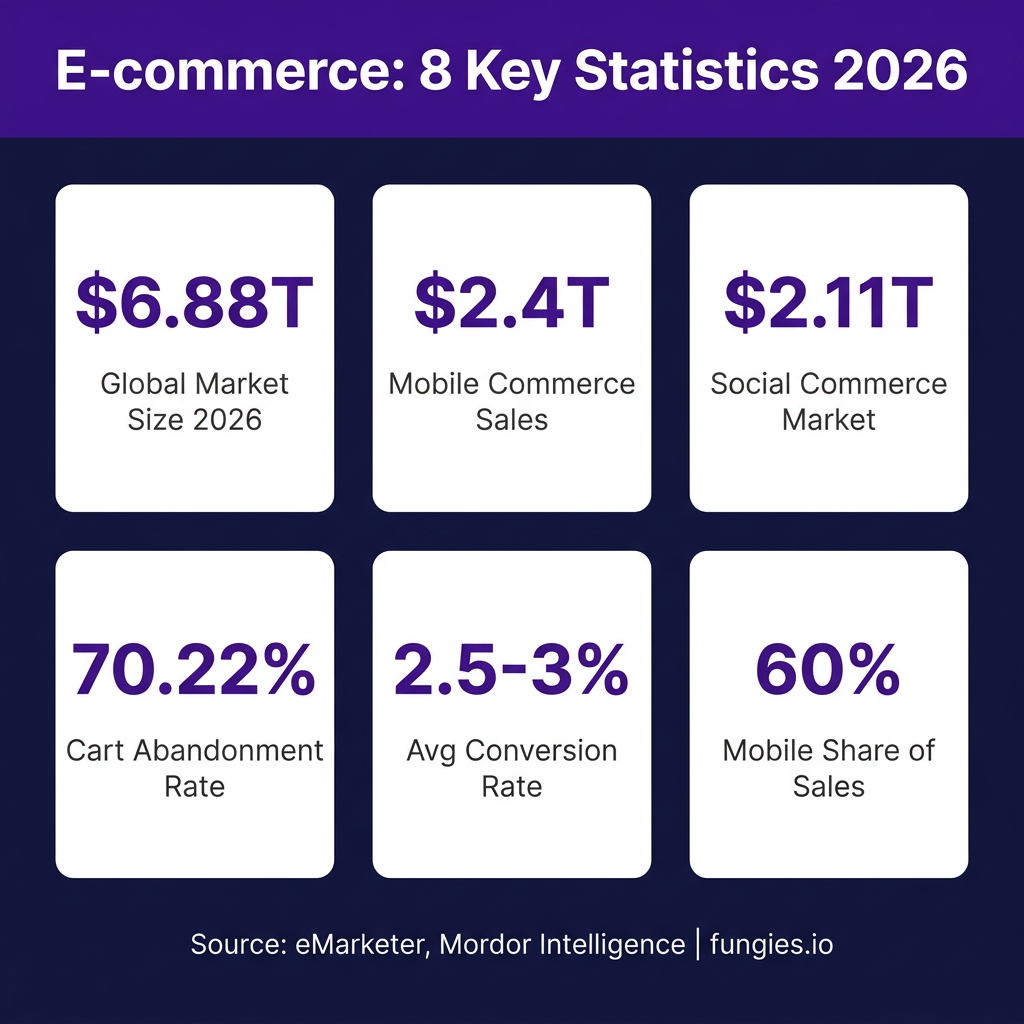
- Global market size: $6.88 trillion in 2026 (eMarketer)
- Annual growth rate: 8.3% YoY, 21.6% CAGR through 2033 (Grand View Research)
- Mobile commerce share: 60% of total e-commerce sales (Ringly.io)
- Social commerce market: $2.11 trillion in 2026, growing at 29% CAGR (Mordor Intelligence)
- Global cart abandonment rate: 70.22% average (Baymard Institute)
- Average conversion rate: 2.5-3% globally, varying significantly by industry (Multiple sources)
- US e-commerce penetration: 18% of total retail sales in 2026 (eMarketer)
- Online marketplaces share: 61.3% of all e-commerce transactions (Coherent Market Insights)
- Projected 2030 market size: $13+ trillion globally (Juniper Research)
- B2B e-commerce CAGR: 14.5% through 2026 (International Trade Administration)
Global E-commerce Market Size & Growth
The e-commerce industry has demonstrated remarkable resilience and growth trajectory. According to eMarketer, global e-commerce sales are projected to reach $6.88 trillion in 2026, up from an estimated $6.42 trillion in 2025. This represents an 8.3% year-over-year growth rate—significantly outpacing traditional retail growth.
Looking at the longer-term picture, Grand View Research projects the global e-commerce market will reach $155.98 trillion by 2033, expanding at a compound annual growth rate (CAGR) of 21.6% from 2026 to 2033. This aggressive growth forecast reflects the continued digital transformation of retail across emerging markets and the expansion of B2B e-commerce.
Juniper Research offers a more conservative but still substantial projection: the e-commerce market will surpass $13 trillion by 2030. The variation in forecasts reflects different methodologies and market definitions, but the consensus is clear—e-commerce is on a steep growth curve that will fundamentally reshape global retail.
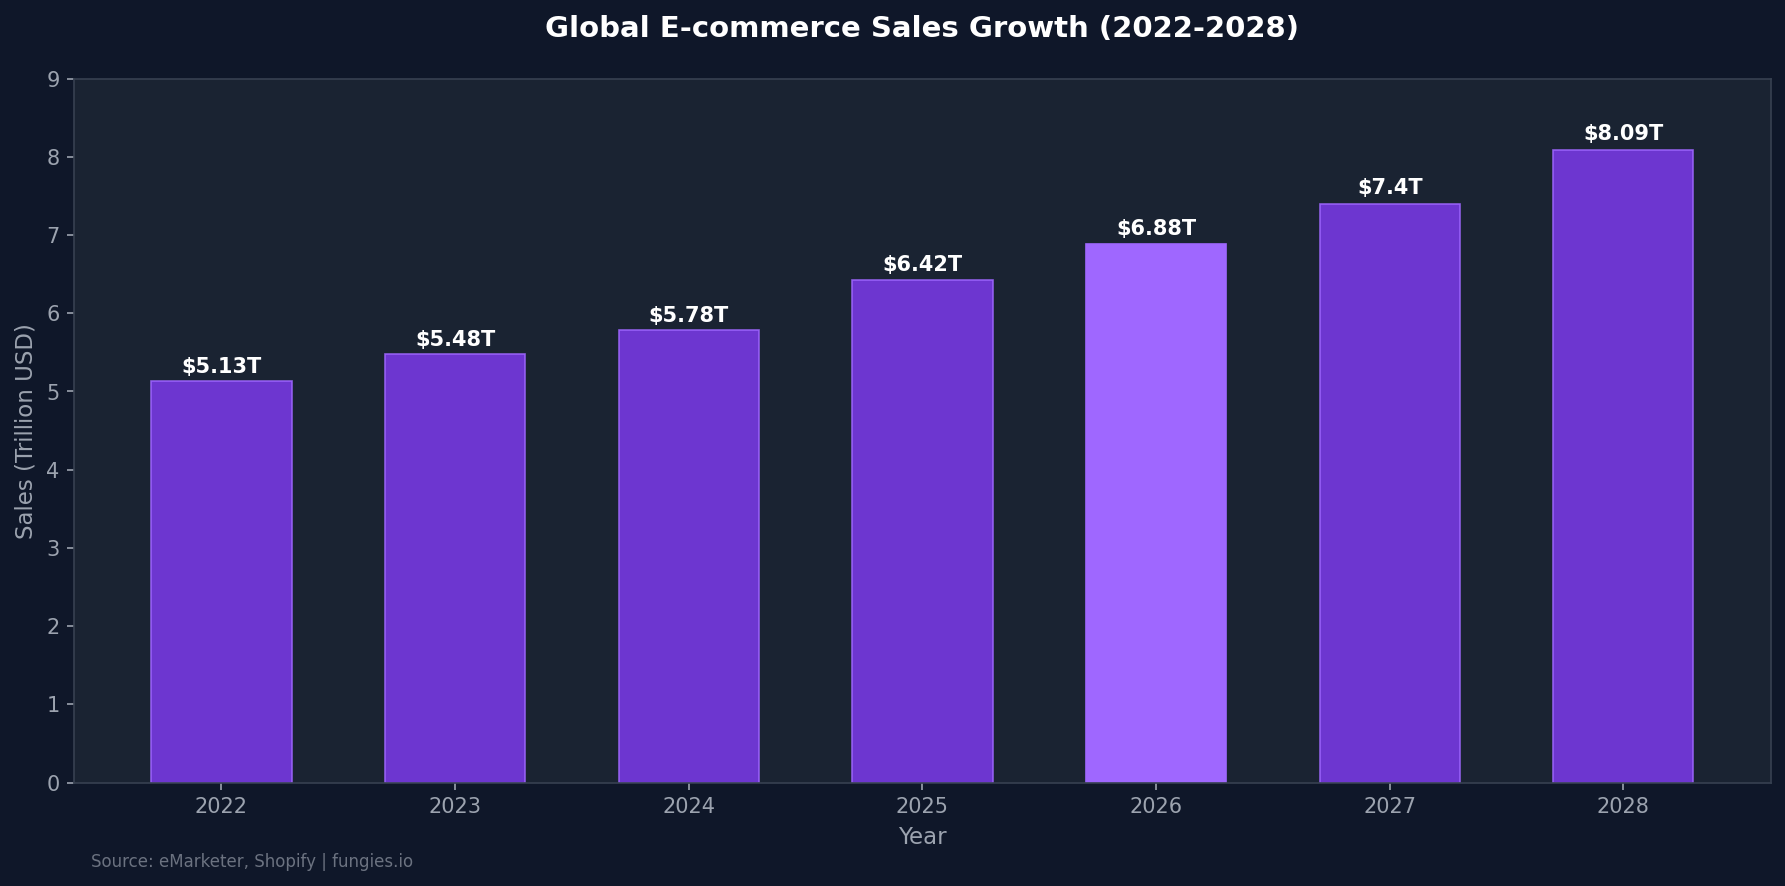
Historical and Projected Market Size (2022-2028)
| Year | Global E-commerce Sales | YoY Growth | Share of Total Retail |
|---|---|---|---|
| 2022 | $5.13 trillion | 7.1% | 19.0% |
| 2023 | $5.48 trillion | 6.8% | 19.5% |
| 2024 | $5.78 trillion | 5.5% | 20.0% |
| 2025 | $6.42 trillion | 11.1% | 20.5% |
| 2026 | $6.88 trillion | 7.2% | 22.0% |
| 2027 | $7.40 trillion | 7.6% | 22.6% |
| 2028 | $8.09 trillion | 9.3% | 22.5% |
Sources: eMarketer, Shopify, Statista
Regional E-commerce Market Breakdown
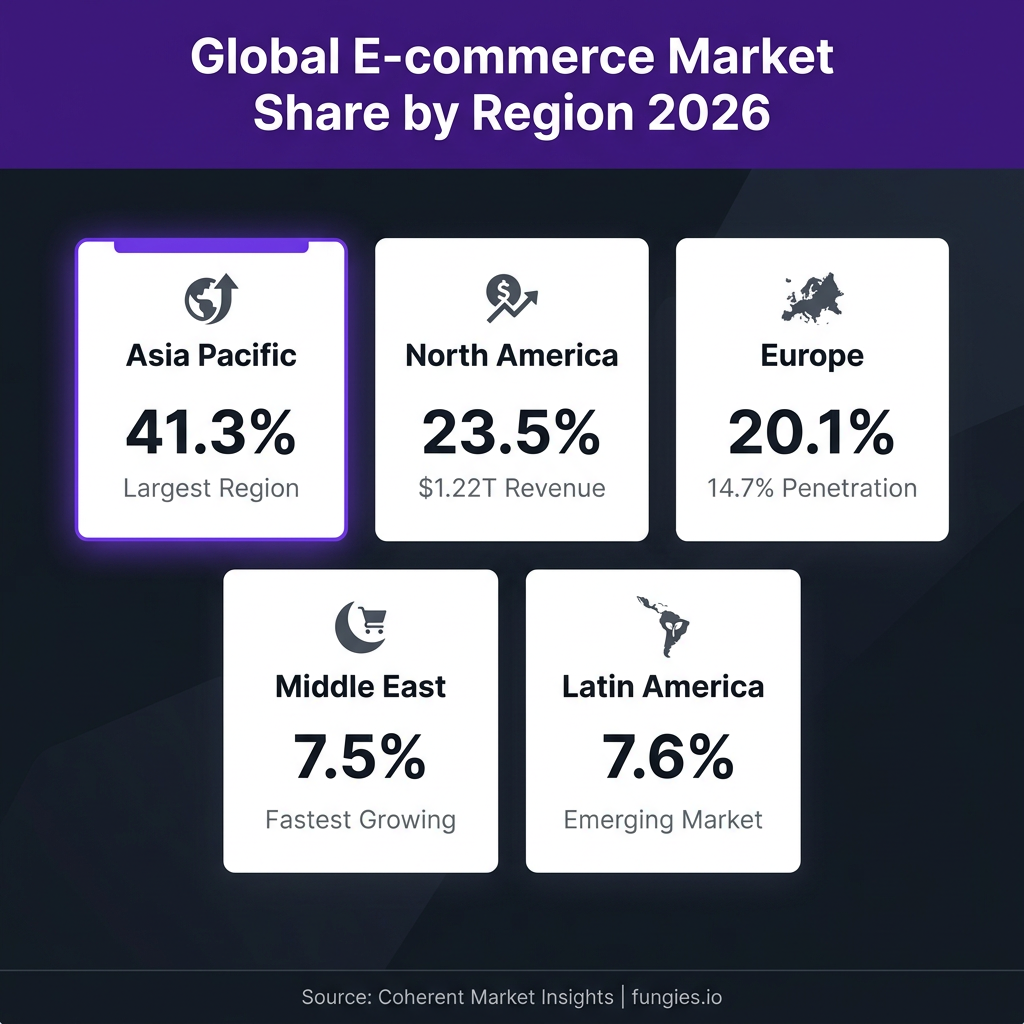
E-commerce growth is not evenly distributed globally. Asia Pacific continues to dominate the market, while the Middle East represents the fastest-growing opportunity.
According to Coherent Market Insights, Asia Pacific holds 41.3% of the global e-commerce market share in 2026, driven primarily by China’s massive digital economy. North America follows with approximately 23.5% market share, while Europe accounts for roughly 20.1%.
The Middle East, while currently representing only 7.5% of global market share, is projected to show the fastest growth rate as digital infrastructure expands and mobile penetration increases across the region.
E-commerce Market Share by Region (2026)
| Region | Market Share | Key Characteristics |
|---|---|---|
| Asia Pacific | 41.3% | Largest market; China dominates with 20% of global sales |
| North America | 23.5% | $1.22T revenue; 18% retail penetration |
| Europe | 20.1% | 14.7% average penetration; Netherlands leads at 18.3% |
| Latin America | 7.6% | Emerging market; rapid mobile adoption |
| Middle East & Africa | 7.5% | Fastest growing region; high mobile commerce share |
Source: Coherent Market Insights, Eurostat
United States E-commerce Statistics
The US remains the most mature and valuable e-commerce market. According to Statista Market Forecast, US e-commerce revenue is projected to reach $1.22 trillion in 2026, with an expected CAGR of 6.07% through 2030.
Key US metrics for 2026:
- User penetration: 87.2% (expected to reach 96.1% by 2030)
- Number of users: 283 million online shoppers
- Average revenue per user (ARPU): $4,100
- E-commerce as share of retail: 18% (up from 17.1% in 2025)
Forrester Research projects US retail e-commerce will reach $1.8 trillion by 2030, representing 29% of total retail sales—up from 22% in 2025.
Key Players & Market Share
E-commerce remains highly concentrated among a few dominant platforms. Amazon’s market leadership is particularly pronounced in the United States, while Alibaba dominates the Asian market.
According to eMarketer and Statista, Amazon holds 40.4-40.5% of the US retail e-commerce market in 2025-2026, translating to approximately $491.65 billion in sales. This represents nearly half a trillion dollars in US revenue alone.
Top E-commerce Companies by Market Share (US, 2025)
| Company | US Market Share | Estimated US Revenue |
|---|---|---|
| Amazon | 40.5% | $491.65 billion |
| Walmart | ~10% | $121 billion |
| eBay | 3.5% | $42 billion |
| Apple | 3.6% | $44 billion |
| Target | 2.1% | $25 billion |
| Home Depot | 2.0% | $24 billion |
| Costco | 2.1% | $25 billion |
| Best Buy | 1.4% | $17 billion |
| Carvana | 1.1% | $13 billion |
| Other | 33.7% | $409 billion |
Source: eMarketer, Statista
Globally, the picture shifts. Alibaba (including Taobao, Tmall, and AliExpress) dominates Asian markets with a combined market cap of approximately $198.5 billion. Temu and Shein have emerged as significant players, now ranking among the top 5 most-used platforms globally.
Mobile Commerce (M-commerce) Statistics
Mobile commerce has transitioned from secondary to primary. According to Ringly.io and Fortune Business Insights, mobile accounts for 60% of all global e-commerce sales in 2026—up from 43% in 2018 and projected to reach 63% by 2028.
The global mobile commerce market is valued at $2.4 trillion in 2026 (Mordor Intelligence cites $2.82 trillion), growing at a 9.5% CAGR through 2034. By 2034, m-commerce is expected to reach $5 trillion.
US mobile commerce specifically is estimated at $410 billion in 2026, projected to climb to $856 billion by 2027 as American consumers increasingly adopt phone-first shopping habits.
Mobile Commerce Key Statistics
- Global m-commerce market size (2026): $2.4 trillion
- Share of total e-commerce: 60%
- Projected m-commerce by 2034: $5 trillion
- US m-commerce (2026): $410 billion
- Mobile conversion rate: 1.8% (vs. 3.9% desktop)
- Digital wallet users globally: 5.2 billion
Sources: Ringly.io, Fortune Business Insights, Mordor Intelligence
Social Commerce Statistics
Social commerce—purchases made directly through social media platforms—represents one of the fastest-growing segments. According to Mordor Intelligence, the global social commerce market is worth $2.11 trillion in 2026, up from $1.63 trillion in 2025.
The segment is projected to reach $7.55 trillion by 2031, expanding at a remarkable 29.12% CAGR. This growth is driven primarily by TikTok Shop, Instagram Shopping, and Facebook Marketplace.
TikTok Shop specifically is projected to hit $23.4 billion in US GMV by 2026, making it the fastest-growing social commerce platform in the United States. Live shopping events on TikTok drive 10-15x more engagement than static posts.
Social Commerce Platform Performance
| Platform | Conversion Rate | Key Strength |
|---|---|---|
| TikTok Shop | 4.7% | Highest conversion; live shopping |
| Instagram Shopping | 2.1% | Product discovery; influencer integration |
| Facebook Shops | 1.8% | Largest user base; marketplace |
| Pinterest Shopping | 1.5% | High-intent discovery |
Source: GenAIembed.ai, Digital Applied
Industry Benchmarks: Conversion Rates & KPIs
Understanding whether your e-commerce performance is competitive requires benchmarking against industry standards. The global average e-commerce conversion rate in 2026 sits between 2.5% and 3%, but this varies dramatically by industry, device, and traffic source.
According to Dynamic Yield and Red Stag Fulfillment, food and beverage leads with conversion rates around 6%, while luxury and jewelry lags at approximately 0.9%. This 6x difference illustrates why industry context matters when evaluating performance.
E-commerce Conversion Rate by Industry (2026)
| Industry | Conversion Rate | Add-to-Cart Rate |
|---|---|---|
| Food & Beverage | 6.0% | 9.76% |
| Health & Beauty | 3.5% | 7.2% |
| Pet Care | 3.2% | 8.5% |
| Fashion & Apparel | 2.8% | 6.5% |
| Electronics | 2.4% | 5.8% |
| Home & Garden | 2.1% | 5.2% |
| Sports & Outdoors | 1.9% | 4.8% |
| Furniture | 1.5% | 4.1% |
| Luxury & Jewelry | 0.9% | 2.28% |
Sources: Dynamic Yield, Red Stag Fulfillment, Polar Analytics
Conversion Rate by Traffic Source
Not all traffic converts equally. Email marketing continues to deliver the highest conversion rates, while social media remains challenging for direct sales:
- Email marketing: 5.3% conversion rate
- Referral traffic: 5.4% conversion rate
- Organic search: 3.8% conversion rate
- Paid search: 3.2% conversion rate
- Direct traffic: 2.9% conversion rate
- Social media: 0.7% conversion rate
Source: Red Stag Fulfillment, Store Growers
Cart Abandonment Statistics
Cart abandonment remains one of e-commerce’s most expensive challenges. According to the Baymard Institute’s comprehensive analysis of 50 studies, the average documented online shopping cart abandonment rate is 70.22% in 2026.
This means more than 7 out of 10 shoppers who add products to their cart will leave without completing their purchase. With 23% of all retail purchases expected to take place online by 2027, this represents billions in recoverable revenue.
Top Reasons for Cart Abandonment
- Extra costs too high (shipping, taxes, fees): 48%
- Required account creation: 24%
- Too slow delivery: 22%
- Didn’t trust site with credit card: 18%
- Too long/complicated checkout: 17%
- Couldn’t see total cost upfront: 16%
- Website errors/crashes: 13%
- Not enough payment methods: 9%
Source: Baymard Institute, Swell
Baymard Institute research indicates that better checkout design can increase conversion rates by 35.26%—representing the single largest opportunity for most e-commerce sites to improve revenue without increasing traffic.
Average Order Value (AOV) Benchmarks
Average order value varies significantly by industry. According to Dynamic Yield, luxury and jewelry commands the highest AOV at $349, while pet care sits at the lower end with $68.
Average Order Value by Industry
| Industry | Average Order Value |
|---|---|
| Luxury & Jewelry | $349 |
| Home & Furniture | $245 |
| Electronics | $198 |
| Fashion & Apparel | $142 |
| Health & Beauty | $89 |
| Food & Beverage | $78 |
| Pet Care | $68 |
Source: Dynamic Yield
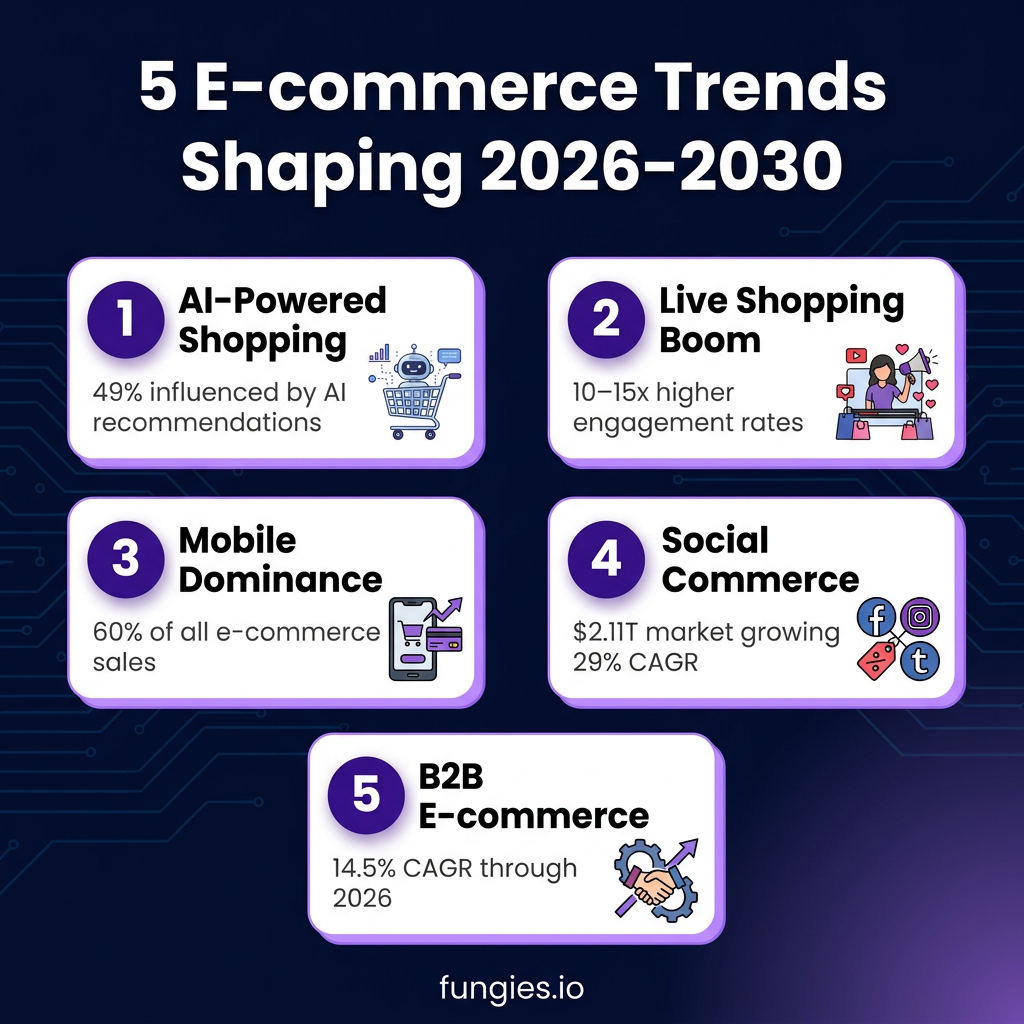
5 E-commerce Trends Shaping 2026-2030
Based on our analysis of market data and industry research, here are the five trends that will define e-commerce over the next five years:
1. AI-Powered Personalization
According to Akeneo’s consumer research, 49% of Americans say AI recommendations already influence what they buy, and 64% say they’re willing to purchase items recommended by generative AI. The AI e-commerce market is anticipated to approach $51 billion by 2033, expanding at a CAGR of 24.3%.
2. Live Shopping Explosion
Live shopping—real-time video streams where viewers can purchase products—is driving 10-15x more engagement than static posts. Brands running weekly live streams see 3-5x higher conversion rates than those relying on feed posts alone. TikTok Shop’s $500 million in sales over a four-day shopping window demonstrates the power of this format.
3. Mobile-First Commerce
With mobile accounting for 60% of e-commerce sales and growing to a projected 63% by 2028, mobile-first design is no longer optional. The gap between mobile (1.8% conversion) and desktop (3.9% conversion) represents both a challenge and an opportunity for optimization.
4. Social Commerce Maturation
The $2.11 trillion social commerce market growing at 29% CAGR will fundamentally change how products are discovered and purchased. Platforms are becoming marketplaces, and the distinction between content and commerce is disappearing.
5. B2B E-commerce Acceleration
While B2C gets the headlines, B2B e-commerce is growing at a 14.5% CAGR through 2026 according to the International Trade Administration. Digital procurement adoption and online wholesale commerce expansion are driving this segment’s growth.
Methodology
This report synthesizes data from 20+ authoritative sources including eMarketer, Statista, Grand View Research, Mordor Intelligence, Baymard Institute, Coherent Market Insights, Fortune Business Insights, and government sources including the US Census Bureau and International Trade Administration.
Market size figures represent B2C e-commerce unless otherwise specified. Growth rates are calculated using the compound annual growth rate (CAGR) methodology. Regional breakdowns are based on the most recent available geographic segmentation from major research firms.
Conversion rate benchmarks are compiled from multiple analytics providers and represent session-based conversion (orders divided by sessions). Cart abandonment rates are calculated as 1 minus the cart completion rate.
Data limitations: Some 2026 figures are projections based on Q1-Q2 actuals. Regional data may not sum to 100% due to rounding and varying market definitions across sources.
Frequently Asked Questions
What is the global e-commerce market size in 2026?
The global e-commerce market is projected to reach $6.88 trillion in 2026, representing an 8.3% increase from 2025. By 2030, the market is expected to surpass $13 trillion.
What is a good e-commerce conversion rate?
A “good” conversion rate depends heavily on your industry. The global average is 2.5-3%, but food and beverage stores should aim for 5-6%, while luxury brands may only achieve 1-2%. Compare yourself to industry benchmarks, not global averages.
What percentage of e-commerce is mobile?
Mobile commerce accounts for 60% of total global e-commerce sales in 2026, projected to reach 63% by 2028. However, mobile conversion rates (1.8%) still lag desktop (3.9%), indicating room for mobile experience optimization.
What is the average cart abandonment rate?
The average documented cart abandonment rate is 70.22%. The top reason (48% of abandonments) is extra costs being too high—shipping, taxes, and fees that appear unexpectedly at checkout.
How fast is social commerce growing?
The social commerce market is worth $2.11 trillion in 2026 and growing at a 29.12% CAGR—making it one of the fastest-growing segments in digital commerce. TikTok Shop leads with a 4.7% conversion rate.
Sources & Citations
- eMarketer – Global E-commerce Forecast 2026: emarketer.com
- Statista – E-commerce Worldwide Statistics: statista.com/topics/871/online-shopping
- Grand View Research – E-commerce Market Report 2033: grandviewresearch.com
- Mordor Intelligence – E-commerce Market Size 2031: mordorintelligence.com
- Baymard Institute – Cart Abandonment Rate Statistics: baymard.com
- Coherent Market Insights – Retail E-commerce Market: coherentmarketinsights.com
- Fortune Business Insights – M-commerce Market: fortunebusinessinsights.com
- Ringly.io – Mobile Commerce Statistics 2026: ringly.io
- Shopify – Global Ecommerce Sales Report: shopify.com
- Dynamic Yield – E-commerce Benchmarks: dynamicyield.com
- Red Stag Fulfillment – E-commerce Conversion Rates: redstagfulfillment.com
- International Trade Administration – eCommerce Sales Forecast: trade.gov
- Juniper Research – eCommerce Market 2030: juniperresearch.com
- Forrester Research – US Retail E-commerce Forecast: forrester.com
- Akeneo – 2026 E-commerce Trends: akeneo.com
- Swell – Cart Abandonment Statistics: swell.is
- ConvertCart – Cart Abandonment Rate Statistics: convertcart.com
- SearchLab – E-commerce Statistics 2026: searchlab.nl
- EmberTribe – Ecommerce Statistics 2026: embertribe.com
- Polar Analytics – Ecommerce Benchmarks 2026: polaranalytics.com
Last updated: May 26, 2026. Data reflects the most recent available market research and projections.