Fraud Management Statistics 2026: Market Size, Data & Trends (Comprehensive Report)
Fraud is no longer just a cost of doing business—it’s a $67 billion industry fighting a $48 billion problem. In 2026, every dollar lost to fraud costs U.S. merchants $4.61, up 37% from 2020. The global fraud detection and prevention market is growing at 17.5% annually, driven by surging e-commerce volumes, sophisticated AI-powered attacks, and the persistent rise of friendly fraud.
This comprehensive report compiles the latest fraud management statistics from industry leaders including Fortune Business Insights, Grand View Research, LexisNexis Risk Solutions, the Federal Trade Commission, and the Merchant Risk Council. Whether you’re a payment processor, e-commerce merchant, SaaS founder, or risk management professional, these data points will help you benchmark your fraud prevention strategy against industry standards.
Key Fraud Management Statistics at a Glance
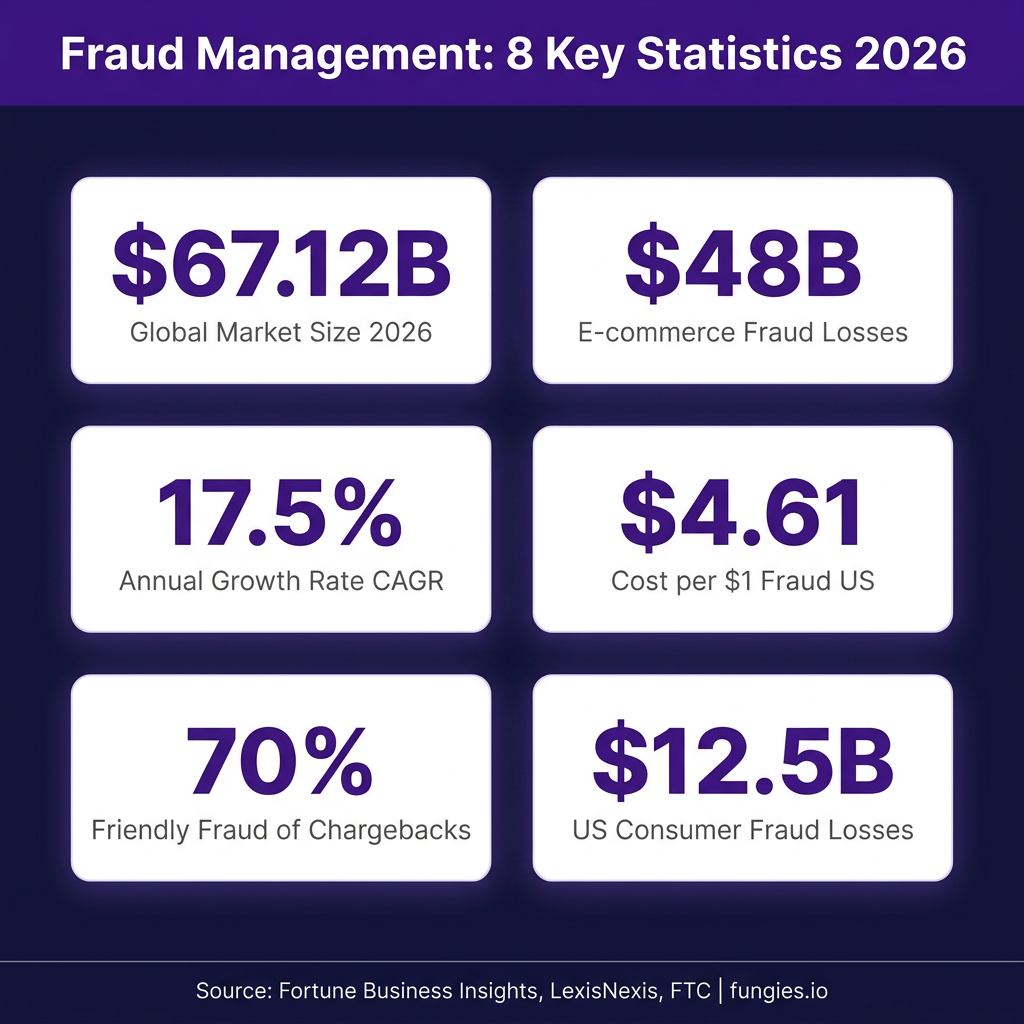
- The global fraud detection and prevention market reached $67.12 billion in 2026, up from $54.61 billion in 2025 (Fortune Business Insights)
- Global e-commerce fraud losses hit $48 billion in 2025, projected to reach $107 billion by 2029 (Juniper Research)
- U.S. merchants incur $4.61 in total costs for every $1 lost to fraud (LexisNexis Risk Solutions)
- 70% of all chargebacks are attributed to friendly fraud (Mastercard State of Chargebacks 2025)
- American consumers reported losing $12.5 billion to scams in 2024, a 25% increase from 2023 (FTC)
- First-party fraud now accounts for 36% of all global fraud cases, more than doubling in a single year (MRC)
- The market is projected to reach $243.72 billion by 2034, growing at a 17.5% CAGR (Fortune Business Insights)
- North America dominates with a 42% market share in the fraud detection sector
Global Fraud Detection & Prevention Market Size & Growth
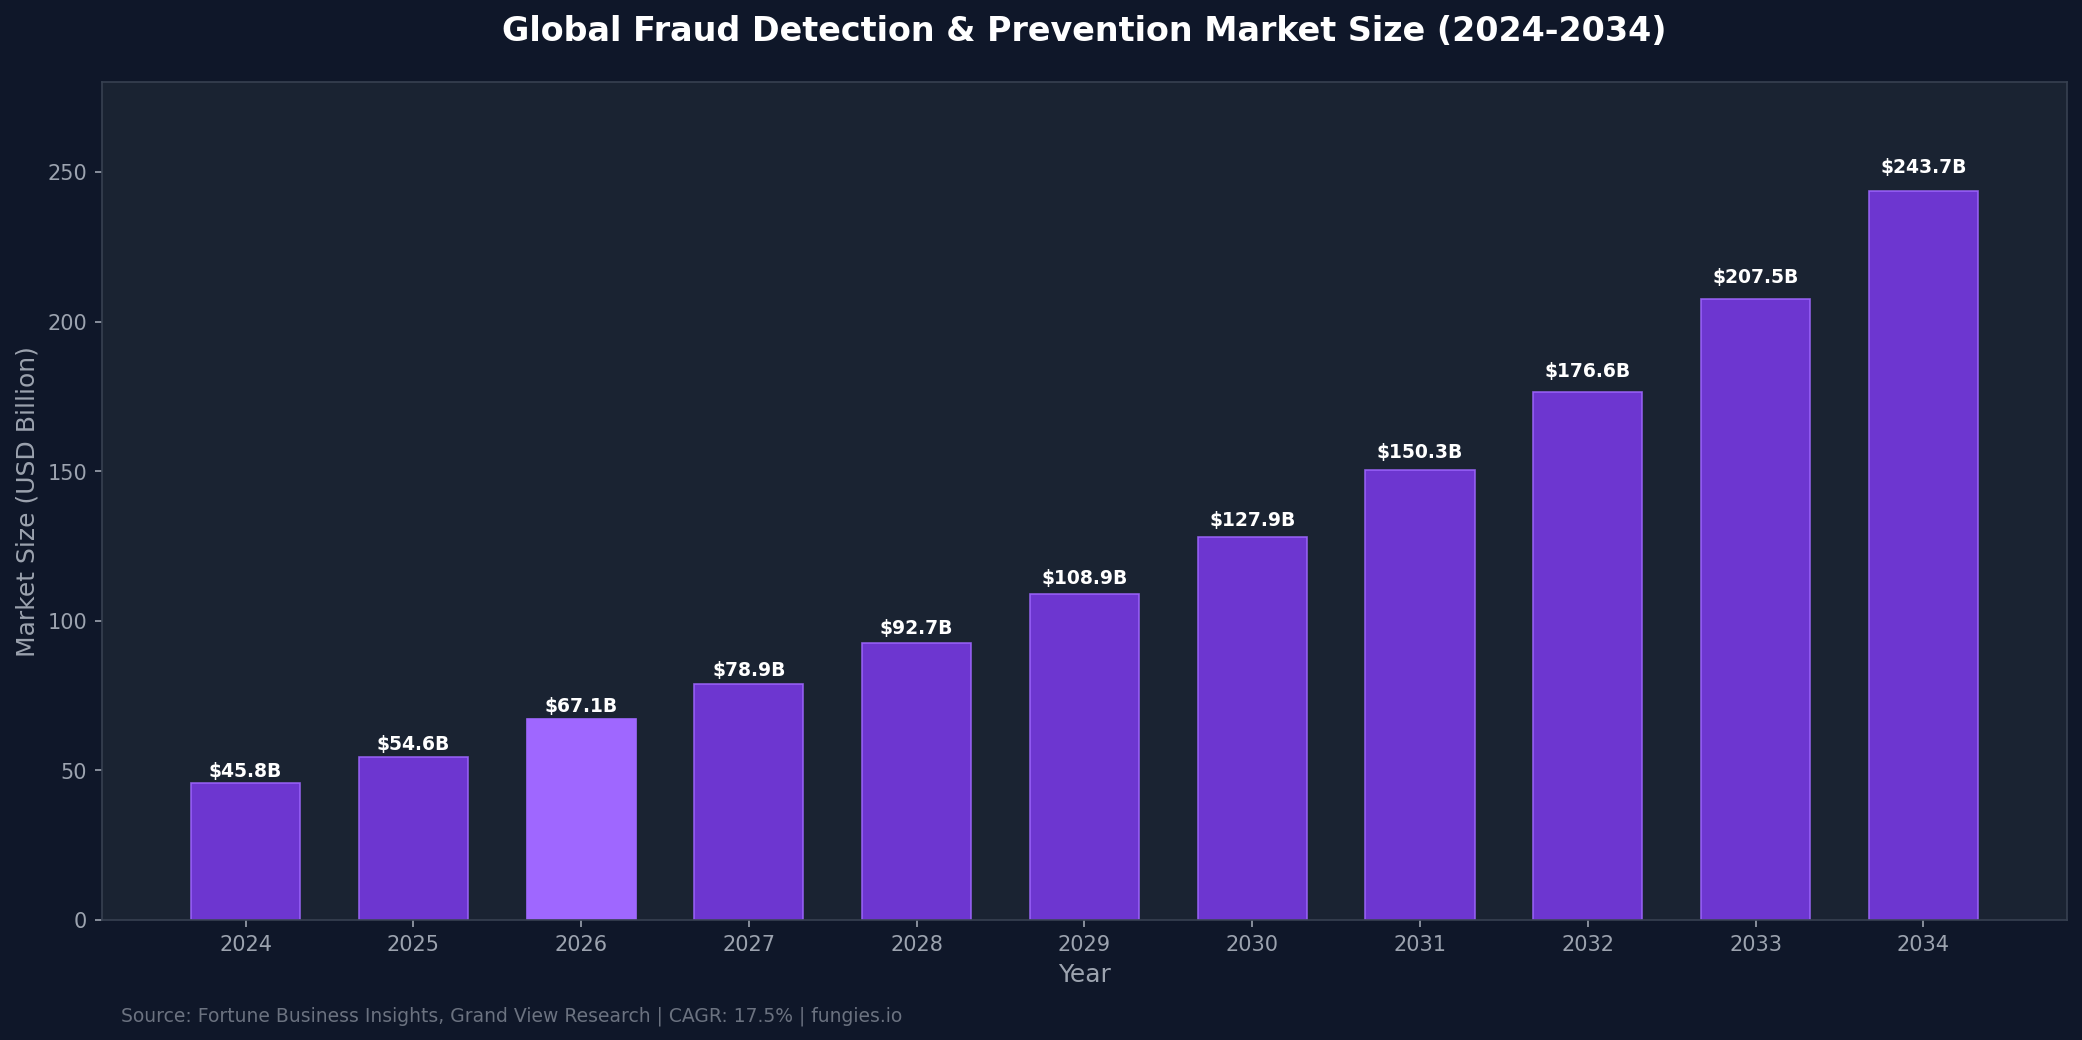
The fraud detection and prevention market has experienced explosive growth, accelerating from $45.8 billion in 2024 to a projected $67.12 billion in 2026. According to Fortune Business Insights, the market will reach $243.72 billion by 2034, representing a compound annual growth rate of 17.5%. Grand View Research estimates growth from $35.3 billion in 2025 to $129.4 billion by 2033 (18.1% CAGR). MarketsandMarkets forecasts the market expanding from $32.0 billion in 2025 to $65.68 billion by 2030 (15.5% CAGR).
The U.S. market alone generated $9.3 billion in 2024 and is projected to reach $24.3 billion by 2030, growing at 17.9% CAGR. This growth is fueled by digital transformation across industries, the proliferation of real-time payment systems, and increasingly sophisticated cyber threats that traditional rule-based systems cannot detect.
| Year | Market Size (USD Billion) | Growth Rate | Source |
|---|---|---|---|
| 2024 | $45.8B | — | Industry Analysis |
| 2025 | $54.61B | 19.2% | Fortune Business Insights |
| 2026 | $67.12B | 22.9% | Fortune Business Insights |
| 2028 | $92.7B | 17.5% CAGR | Projected |
| 2030 | $127.9B | 17.5% CAGR | MarketsandMarkets |
| 2033 | $207.5B | 17.5% CAGR | Grand View Research |
| 2034 | $243.72B | 17.5% CAGR | Fortune Business Insights |
Regional Breakdown: Fraud Management Market by Geography
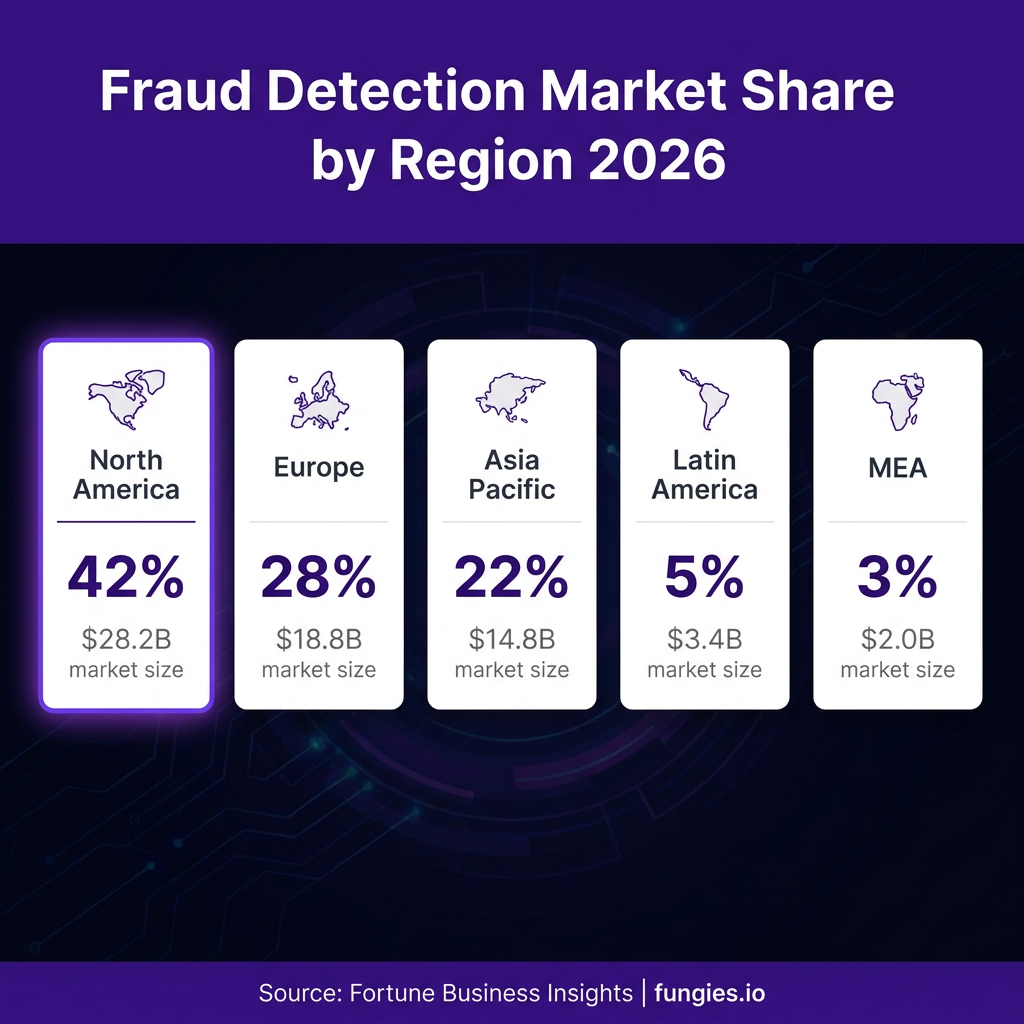
North America dominates the global fraud detection and prevention market with a 42% revenue share in 2025, according to Fortune Business Insights. This dominance reflects the region’s advanced digital infrastructure, high e-commerce penetration, and stringent regulatory environment. The North America FDP market accounted for 34.6% revenue share according to MarketsandMarkets, with the U.S. representing the largest single country market.
Europe holds approximately 28% of the market, driven by strong GDPR compliance requirements and the PSD2 open banking regulations that mandate strong customer authentication. The Asia-Pacific region accounts for 22% and is experiencing the fastest growth, fueled by rapid digital payment adoption in India, Southeast Asia, and China.
| Region | Market Share (2025) | Market Size (2026) | CAGR (2026-2030) |
|---|---|---|---|
| North America | 42% | $28.2B | 17.9% |
| Europe | 28% | $18.8B | 16.2% |
| Asia Pacific | 22% | $14.8B | 19.8% |
| Latin America | 5% | $3.4B | 15.4% |
| Middle East & Africa | 3% | $2.0B | 14.7% |
Key Players & Market Share
The fraud detection and prevention market features a mix of established technology giants and specialized fraud prevention vendors. While exact market share figures are closely guarded, industry reports consistently identify several key players dominating different segments of the market.
IBM, FICO, and SAS Institute lead in enterprise fraud analytics solutions. LexisNexis Risk Solutions and TransUnion dominate identity verification and fraud risk scoring. Emerging players like Sift, Alloy, and Feedzai are gaining traction with AI-native platforms designed for real-time decisioning.
| Company | Primary Solution | Key Strength | Notable Clients |
|---|---|---|---|
| IBM | Safer Payments | Enterprise scale, AI/ML | Major banks, processors |
| FICO | Falcon Platform | Proprietary analytics | 9,000+ financial institutions |
| LexisNexis | ThreatMetrix | Digital identity network | E-commerce, financial services |
| SAS Institute | Fraud Management | Advanced analytics | Global enterprises |
| TransUnion | IDVision | Credit + fraud data | Lenders, insurers |
| Sift | Digital Trust & Safety | Real-time ML | Airbnb, Twitter, Doordash |
| Alloy | Identity Decisioning | Orchestration platform | Fintechs, neobanks |
| Feedzai | RiskOps Platform | Sub-10ms scoring | Banks, payment processors |
Fraud Losses & Cost Statistics
The financial impact of fraud extends far beyond the initial loss amount. According to LexisNexis Risk Solutions’ True Cost of Fraud Study, U.S. merchants incur an average of $4.61 in total costs for every $1 lost to fraud—up from $3.36 in 2020. These costs include chargeback fees, merchandise replacement, operational overhead for dispute management, and customer acquisition costs to replace churned users.
TransUnion’s H2 2025 Global Fraud Report reveals that companies worldwide lost 7.7% of their annual revenue on average due to fraud over the past year, representing an estimated $534 billion across the 1,200 business leaders surveyed. In the U.S., business leaders reported their companies lost an average of 9.8% of revenue due to fraud—a staggering 46% increase from 2024.
| Metric | Value | Source |
|---|---|---|
| Global e-commerce fraud losses (2025) | $48 billion | Juniper Research |
| Projected e-commerce fraud losses (2029) | $107 billion | Juniper Research |
| U.S. consumer fraud losses (2024) | $12.5 billion | FTC |
| Estimated true U.S. fraud losses (with underreporting) | $196 billion | FTC estimate |
| Cryptocurrency fraud losses (2024) | $9.3 billion | AARP |
| Cost per $1 of fraud (U.S. merchants) | $4.61 | LexisNexis |
| Cost per $1 of fraud (Canada merchants) | $4.52 | LexisNexis |
| Global revenue lost to fraud (average) | 7.7% | TransUnion |
| U.S. revenue lost to fraud (average) | 9.8% | TransUnion |
Fraud Types & Attack Vectors
Understanding the distribution of fraud types is critical for allocating prevention resources effectively. According to the Merchant Risk Council’s 2025 Global eCommerce Payments and Fraud Report, scams and authorized fraud were the predominant cause of business loss (24%), followed closely by synthetic identity fraud (20%) and account takeover (20%).
Payment fraud dominates the application landscape, accounting for approximately 53.1% of the global fraud detection and prevention market revenue in 2025, according to Grand View Research. Identity theft and account takeover represent the fastest-growing segments as credential stuffing attacks and data breaches proliferate.
| Fraud Type | % of Global Fraud Cases | Growth Trend | Primary Target |
|---|---|---|---|
| Scams / Authorized Fraud | 24% | Rising | Consumers, businesses |
| Synthetic Identity Fraud | 20% | Rising rapidly | Lenders, issuers |
| Account Takeover (ATO) | 20% | Stable | Existing accounts |
| First-Party / Friendly Fraud | 36% | Surging | Merchants, issuers |
| Payment Fraud | 53.1% of market | Growing | E-commerce, retail |
| Identity Theft | 18% | Growing | Financial services |
Chargeback & Friendly Fraud Statistics
Friendly fraud—also known as first-party misuse—has emerged as the dominant fraud challenge for merchants. According to Mastercard’s 2025 State of Chargebacks Report, friendly fraud accounts for nearly 70% of all chargebacks, despite advancements in fraud prevention. This represents a significant shift from third-party fraud, which traditional prevention tools were designed to combat.
The global cost of chargebacks to merchants is forecasted to rise to $42 billion by 2028, with nearly half being reported as fraudulent. Merchants win roughly 41% of representment cases, but the net recovery rate after costs and second chargebacks drops to just 12-18%. Across the Sift network, businesses average a 0.08% fraudulent chargeback rate—97% lower than the average 2.6% of e-commerce orders that led to chargebacks reported from MRC’s global payments survey.
| Metric | Value | Source |
|---|---|---|
| Friendly fraud as % of chargebacks | 70% | Mastercard |
| First-party fraud of all fraud cases | 36% | MRC |
| Global chargeback costs by 2028 | $42 billion | Mastercard |
| Merchant representment win rate | 41% | Industry data |
| Net recovery rate after costs | 12-18% | Industry data |
| Chargeback rate (Sift network average) | 0.08% | Sift FIBR |
| Chargeback rate (MRC average) | 2.6% | MRC |
| Travel industry chargeback surge (2023-2024) | 816% | Visa data |
Industry Benchmarks & KPIs
Effective fraud management requires tracking the right metrics. According to Gartner, over one-third of banks detect under 60% of fraudulent transactions before losses occur, and only 31% achieve preemptive detection above 80%. Organizations investing in advanced fraud detection infrastructure reported an average reduction of 28% in operational costs while improving detection rates.
The Fraud Industry Benchmarking Resource (FIBR) powered by Sift’s global data network of one trillion events provides key benchmarks: businesses average a 0.08% fraudulent chargeback rate, with top performers achieving rates below 0.03%. False positive rates—the legitimate transactions incorrectly declined—remain a critical concern, with industry averages ranging from 1-3% of all transactions.
| KPI | Industry Average | Top Performers | Measurement |
|---|---|---|---|
| Fraud detection rate | 60-80% | 90%+ | % of fraud caught pre-loss |
| False positive rate | 1-3% | <0.5% | % of good orders declined |
| Chargeback rate | 0.5-1.0% | <0.3% | Chargebacks per 100 orders |
| Fraudulent chargeback rate | 0.08% | <0.03% | Fraud chargebacks per 100 orders |
| Manual review rate | 10-20% | <5% | % of orders requiring manual check |
| Operational cost reduction | 28% | 35%+ | With advanced detection |
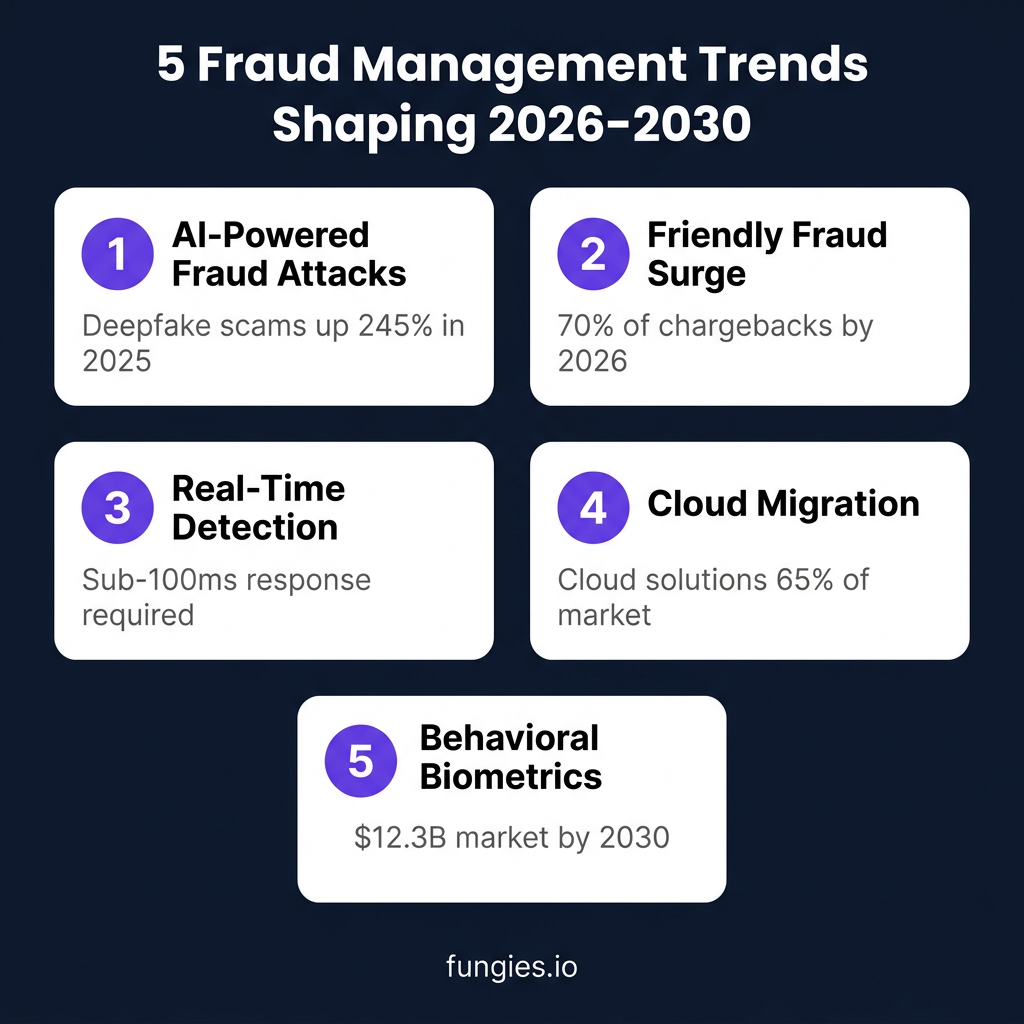
5 Fraud Management Trends Shaping 2026-2030
1. AI-Powered Fraud Attacks
Criminals are leveraging generative AI to create convincing deepfakes, synthetic identities, and phishing content at scale. Deepfake scams increased 245% in 2025, with voice cloning and video impersonation becoming primary attack vectors. According to Javelin Strategy & Research, the fraud landscape in 2026 will experience significant changes due to rapidly evolving attack methodologies that bypass traditional detection.
2. The Friendly Fraud Surge
First-party fraud is becoming the dominant challenge, with 70% of chargebacks now attributed to friendly fraud. According to Mastercard, 48% of consumers have disputed at least one transaction, and merchants are shifting blame toward customers and issuers. The lack of effective prevention tools for this fraud type—since the transaction appears legitimate—creates a significant gap in the defense perimeter.
3. Real-Time Detection Requirements
As real-time payment systems proliferate, fraud detection must operate in sub-100 millisecond timeframes. Feedzai’s RiskOps Platform and similar solutions now offer sub-10ms scoring, enabling instant decisions without adding friction to the customer experience. Cloud-based deployment is expected to dominate, with 65% of the market shifting to cloud solutions by 2028.
4. Behavioral Biometrics Adoption
Behavioral biometrics—analyzing how users type, swipe, and interact with devices—is emerging as a powerful fraud prevention layer. The behavioral biometrics market is projected to reach $12.3 billion by 2030, growing at 23.7% CAGR. This technology is particularly effective against account takeover and synthetic identity fraud, as criminals can steal credentials but not replicate behavioral patterns.
5. Collaborative Fraud Intelligence
Industry consortiums and shared intelligence networks are becoming essential. The Merchant Risk Council reports that MRC members experience significantly better fraud metrics than non-members, including lower fraud rates, lower rejection rates, and higher dispute win rates. Information sharing across borders remains challenging but critical, as money mule networks and fraud rings operate globally.
Fraud Prevention Solutions by Deployment
The fraud detection market is segmented by deployment mode into cloud-based, on-premise, and hybrid solutions. Cloud deployment is expected to dominate the market, driven by scalability, lower upfront costs, and faster implementation. According to MarketsandMarkets, the cloud segment will capture the majority of new deployments through 2030.
Small and medium enterprises (SMEs) represent the fastest-growing organization segment, as cloud-based solutions democratize access to enterprise-grade fraud prevention. The SME segment is expected to dominate market growth, with solutions like Fungies.io’s built-in fraud protection enabling smaller merchants to access sophisticated risk management without dedicated fraud teams.
| Segment | Market Share (2025) | Growth Rate | Key Drivers |
|---|---|---|---|
| Cloud-based | 58% | 21.3% CAGR | Scalability, cost, speed |
| On-premise | 32% | 12.1% CAGR | Data sovereignty, control |
| Hybrid | 10% | 18.7% CAGR | Flexibility, transition |
| Large Enterprises | 65% | 15.2% CAGR | Complex needs, budget |
| SMEs | 35% | 22.8% CAGR | Cloud access, affordability |
Methodology
This report compiles data from authoritative sources including Fortune Business Insights, Grand View Research, MarketsandMarkets, Mordor Intelligence, Coherent Market Insights, LexisNexis Risk Solutions, TransUnion, the Federal Trade Commission, the Merchant Risk Council, Mastercard, Juniper Research, and the Association of Certified Fraud Examiners. Market size figures represent the global fraud detection and prevention industry, including software solutions, services, and integrated platforms.
Data points were cross-referenced across multiple sources to ensure accuracy. Where sources provided varying estimates, we have cited the specific source for each figure. Projections are based on analyst forecasts and historical growth trends. Regional breakdowns are calculated based on reported market shares applied to total market size estimates.
Frequently Asked Questions
What is the size of the fraud detection and prevention market in 2026?
The global fraud detection and prevention market reached $67.12 billion in 2026, growing from $54.61 billion in 2025. The market is projected to reach $243.72 billion by 2034, representing a compound annual growth rate of 17.5% according to Fortune Business Insights.
What is friendly fraud and why is it increasing?
Friendly fraud—also called first-party fraud—occurs when a legitimate cardholder disputes a valid transaction they or a family member authorized. It accounts for 70% of chargebacks in 2026. The increase is driven by consumer familiarity with dispute processes, unclear merchant descriptors, and the ease of initiating disputes through mobile banking apps.
How much do merchants lose to fraud per dollar of fraud?
U.S. merchants incur an average of $4.61 in total costs for every $1 lost to fraud, according to LexisNexis Risk Solutions. This includes the original transaction amount, chargeback fees, merchandise replacement costs, operational overhead for dispute management, and customer acquisition costs to replace churned customers.
Which region has the highest fraud detection market share?
North America dominates the fraud detection and prevention market with a 42% revenue share in 2025, representing approximately $28.2 billion of the $67.12 billion global market. This is followed by Europe (28%), Asia Pacific (22%), Latin America (5%), and Middle East & Africa (3%).
What is the average chargeback rate for e-commerce merchants?
According to the Merchant Risk Council, the average chargeback rate for e-commerce merchants is 2.6% of orders. However, top-performing merchants using advanced fraud prevention achieve rates below 0.3%. The travel and hospitality industry experienced an 816% surge in chargeback rates from 2023 to 2024, driven by non-delivery disputes and cancellations.
Sources & Citations
- Fortune Business Insights – Fraud Detection and Prevention Market Report 2026-2034: https://www.fortunebusinessinsights.com/industry-reports/fraud-detection-and-prevention-market-100231
- Grand View Research – Fraud Detection and Prevention Market Report 2026-2033: https://www.grandviewresearch.com/industry-analysis/fraud-detection-prevention-market
- MarketsandMarkets – Fraud Detection and Prevention Market Report 2025-2030: https://www.marketsandmarkets.com/Market-Reports/fraud-detection-prevention-market-1312.html
- Mordor Intelligence – Fraud Detection and Prevention Market Analysis: https://www.mordorintelligence.com/industry-reports/global-fraud-detection-and-prevention-fdp-market-industry
- Coherent Market Insights – Fraud Detection Market Forecast 2026-2033: https://www.coherentmarketinsights.com/industry-reports/fraud-detection-market
- LexisNexis Risk Solutions – True Cost of Fraud Study 2025: https://risk.lexisnexis.com/about-us/press-room/press-release/20250402-tcof-ecommerce-and-retail
- TransUnion – H2 2025 Global Fraud Report: https://newsroom.transunion.com/h2-2025-global-fraud-report
- Federal Trade Commission – 2024 Fraud Report: https://www.ftc.gov/news-events/news/press-releases/2025/03/new-ftc-data-show-big-jump-reported-losses-fraud-125-billion-2024
- Merchant Risk Council – 2025 Global eCommerce Payments and Fraud Report: https://merchantriskcouncil.org/learning/mrc-exclusive-reports/global-payments-and-fraud-report
- Mastercard – State of Chargebacks 2025: https://www.mastercard.com/us/en/news-and-trends/press/2025/june/first-party-trust-countering-friendly-fraud.html
- Juniper Research – E-commerce Fraud Forecast: https://www.juniperresearch.com
- Gartner – Fraud Detection Research: https://www.gartner.com/en/documents/7563173
- Sift – Fraud Industry Benchmarking Resource (FIBR): https://sift.com/blog/introducing-fibr-powered-by-sift
- Association of Certified Fraud Examiners – Reports and Statistics: https://www.acfe.com/fraud-resources/reports-and-statistics
- Javelin Strategy & Research – 2026 Fraud Management Trends: https://javelinstrategy.com/research/2026-fraud-management-trends