Payment Gateway Statistics 2026: Market Size, Data & Trends (Comprehensive Report)
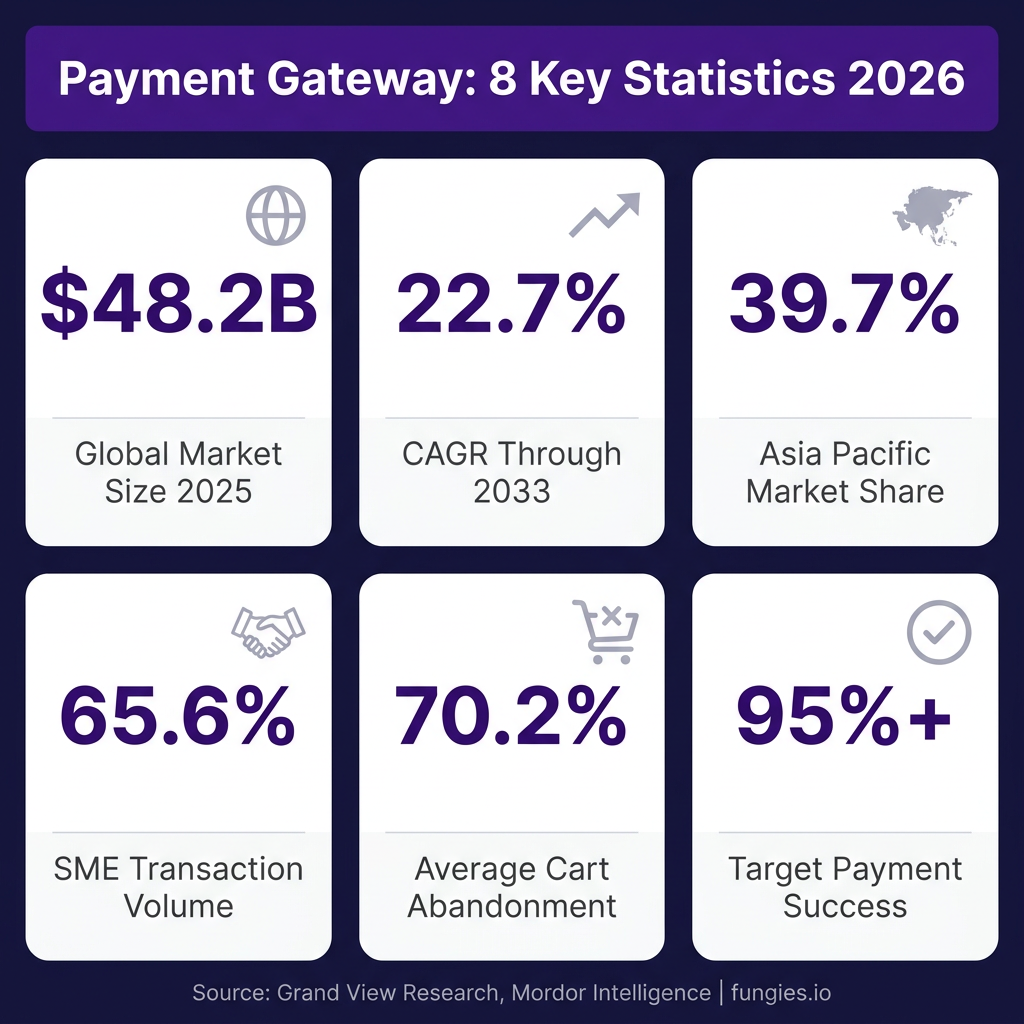
The payment gateway industry sits at the center of global commerce, processing trillions in transactions annually while quietly determining whether a customer completes their purchase or abandons their cart. In 2025, the global payment gateway market reached an estimated $48.17 billion, with projections showing explosive growth to $245.71 billion by 2033 at a compound annual growth rate (CAGR) of 22.7%.
This comprehensive report compiles the most authoritative statistics on payment gateway market size, regional distribution, key players, conversion benchmarks, and emerging trends. Whether you’re a merchant evaluating gateway providers, a developer building checkout experiences, or an analyst tracking fintech evolution, this data serves as a primary reference source for understanding where the industry stands and where it’s headed.
Key Payment Gateway Statistics at a Glance
- The global payment gateway market was valued at $48.17 billion in 2025 (Grand View Research)
- Market projected to reach $245.71 billion by 2033 at a 22.7% CAGR
- Asia Pacific holds 39.74% of global market share, followed by North America at 34.7%
- SMEs drive 65.62% of payment gateway transaction volume
- Hosted gateways capture 56.66% of the market by deployment type
- Global cart abandonment rate averages 70.19% across industries
- Checkout abandonment rates range from 60% to 80%
- Target payment success rate benchmark: 95% or higher
- Top 10 payments companies processed $11 trillion in card volume in 2025
- India’s UPI processed 131 billion transactions in 2024, up 58% year-over-year
Payment Gateway Market Size & Growth
The payment gateway market has demonstrated remarkable resilience and growth momentum. According to Grand View Research, the market size was estimated at $48.17 billion in 2025 and is expected to reach $58.77 billion in 2026. This represents a significant acceleration from previous years, driven by the sustained expansion of e-commerce, mobile payments, and digital wallet adoption.
Mordor Intelligence provides a more conservative but still robust estimate, valuing the market at $18.32 billion in 2025 with projections to reach $41.11 billion by 2031 at a 14.42% CAGR. Meanwhile, Precedence Research positions the market at $29.00 billion in 2025, forecasting growth to $115.30 billion by 2035 at a 14.80% CAGR.
The variation in market size estimates reflects different methodological approaches—some analysts include broader payment processing infrastructure while others focus strictly on gateway technology providers. What remains consistent across all forecasts is the trajectory: double-digit annual growth for the foreseeable future.
| Year | Market Size (Low Estimate) | Market Size (High Estimate) | CAGR | Source |
|---|---|---|---|---|
| 2025 | $18.32B | $48.17B | — | Various |
| 2026 | $20.96B | $58.77B | 14-23% | Various |
| 2030 | $35.6B | $139.9B | 14-23% | Various |
| 2031 | $41.11B | $150B | 14.42% | Mordor Intelligence |
| 2033 | — | $245.71B | 22.7% | Grand View Research |
| 2035 | $115.30B | — | 14.80% | Precedence Research |
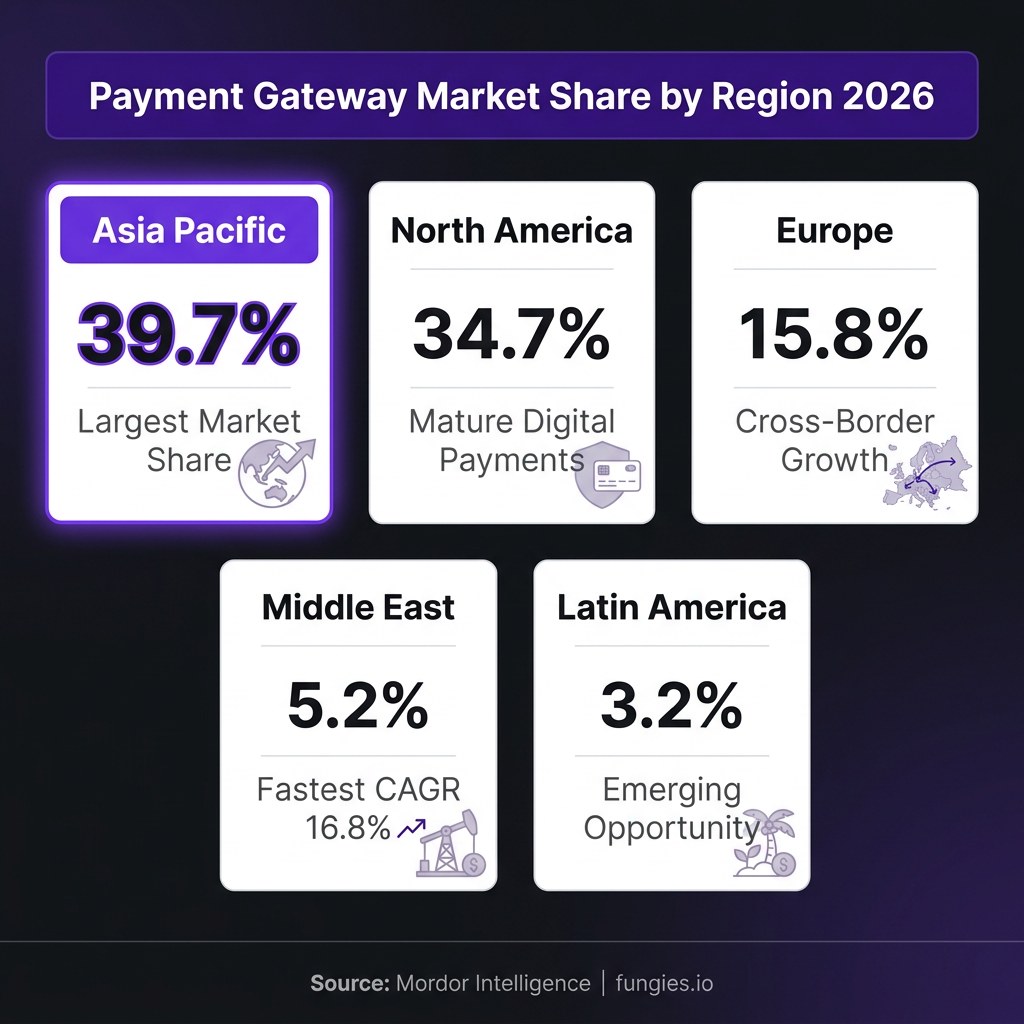
Regional Market Distribution
The payment gateway landscape varies dramatically by geography, reflecting differences in digital infrastructure maturity, regulatory environments, and consumer payment preferences.
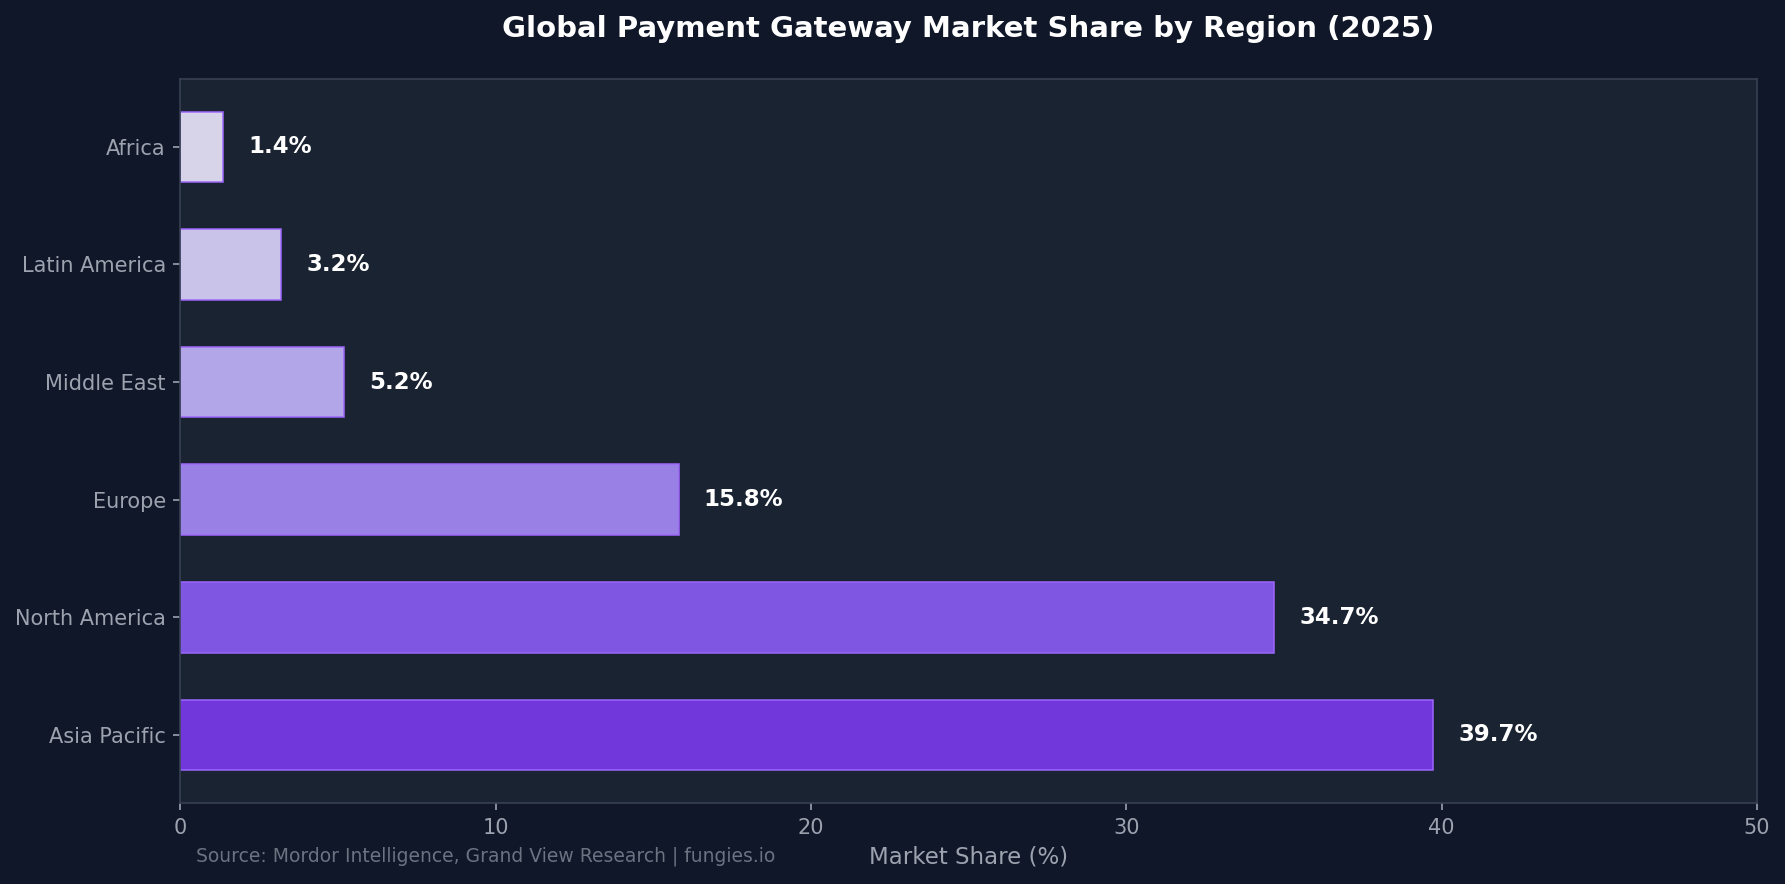
Asia Pacific dominates with 39.74% of global revenue in 2025, according to Mordor Intelligence. This dominance stems from massive real-time payment adoption—India’s Unified Payments Interface (UPI) processed 131 billion transactions in 2024, representing a 58% year-over-year increase. Thailand’s PromptPay surpassed 56 million registered users by mid-2025, while Singapore’s PayNow Corporate expanded into B2B invoicing.
North America holds 34.7% of the market (Grand View Research), characterized by mature digital payment infrastructure and high merchant adoption rates. The U.S. payment gateway market alone reached $6.1 billion in 2025 and is projected to grow to $8.83 billion by 2034 at a 4.20% CAGR.
Europe accounts for approximately 15.8% of the market, with significant cross-border e-commerce activity driving demand. European SMEs generated EUR 89 billion ($95 billion) in cross-border online sales in 2024—a 19% increase from 2023. However, 42% of merchants cited currency conversion friction as a growth barrier.
The Middle East is the fastest-growing region, projected to post a 16.79% CAGR through 2031. This growth is fueled by cashless commerce mandates, central bank digital currency (CBDC) pilots, and rapid mobile payment adoption.
| Region | 2025 Market Share | Growth Outlook | Key Driver |
|---|---|---|---|
| Asia Pacific | 39.74% | High | Real-time payment rails (UPI, PromptPay) |
| North America | 34.70% | Moderate | Mature digital infrastructure |
| Europe | 15.80% | Moderate | Cross-border e-commerce |
| Middle East | 5.20% | 16.79% CAGR | Cashless mandates, CBDC pilots |
| Latin America | 3.20% | High | Digital financial inclusion |
| Africa | 1.36% | High | Mobile money expansion |
Key Players & Market Share
The payment gateway industry features a mix of established financial technology giants, traditional payment processors expanding into gateway services, and emerging specialists focused on specific verticals or regions.
According to TSG (The Strawhecker Group), the top ten payments companies processed $11 trillion in payment card volume in 2025. The top five players alone handled nearly $9 trillion—approximately two-thirds of total tracked card volume. This concentration highlights the scale advantages enjoyed by established providers.
By deployment type, hosted payment gateways captured 56.66% of 2025 revenue (Mordor Intelligence). These cloud-based solutions appeal to SMEs seeking quick implementation without infrastructure investment. However, self-hosted solutions are growing faster at a projected 16.46% CAGR through 2031, as larger enterprises prioritize control over token vaults and routing logic.
By enterprise size, SMEs led with 65.62% of 2025 volume, driven by low-code integrations and subscription pricing models that reduce barriers to entry. Large enterprises, while representing a smaller share of merchant count, are projected to grow at a 15.82% CAGR as they invest in sophisticated orchestration and multi-acquirer strategies.
| Segment | 2025 Share | 2031 Projection | CAGR |
|---|---|---|---|
| Hosted Gateways | 56.66% | ~52% | 13.2% |
| Self-Hosted Gateways | 43.34% | ~48% | 16.46% |
| SMEs (by volume) | 65.62% | ~60% | 12.8% |
| Large Enterprises | 34.38% | ~40% | 15.82% |
| Online/Web Channel | 98.38% | ~92% | 12.5% |
| Mobile In-App | 1.62% | ~8% | 15.76% |
Checkout Conversion & Performance Benchmarks
Payment gateway performance directly impacts merchant revenue through conversion rates, authorization success, and customer experience. Understanding these benchmarks helps businesses evaluate their own performance and identify optimization opportunities.
Cart abandonment remains the industry’s most expensive problem. According to Baymard Institute research compiled across multiple studies, the average global shopping cart abandonment rate stands at 70.19%. Dynamic Yield’s XP² benchmark reports a slightly lower figure of 77.57%, while VWO cites rates between 60-80% depending on industry.
The primary causes of abandonment are well-documented: 48% of cart abandonments stem from extra costs like shipping, taxes, and fees appearing too high at checkout (Baymard Institute). Other significant factors include mandatory account creation (24%), complicated checkout processes (18%), and security concerns (17%).
Payment success rate is the critical gateway KPI. Industry benchmarks suggest merchants should aim for 95% or higher payment success rates. However, best-in-class merchants in specific industries achieve 96% or better. The difference between 92% and 96% authorization rates represents millions in recovered revenue for high-volume merchants.
According to BlueSnap’s Payment Processing KPI Library, up to 40% of online sales are being lost to mistaken declines, fraud prevention friction, and checkout process issues—often without merchants realizing the full extent of the problem.
| Metric | Average/Minimum | Best-in-Class | Source |
|---|---|---|---|
| Shopping Cart Abandonment | 70.19% | 50-60% | Baymard Institute |
| Checkout Abandonment | 60-80% | <50% | Various |
| Payment Success Rate | 92% | 96%+ | GR4VY |
| Authorization Rate | 85-92% | 95%+ | Industry |
| Chargeback Rate | 0.5-1% | <0.5% | Industry |
| Transaction Decline Rate | 8-15% | <5% | BlueSnap |
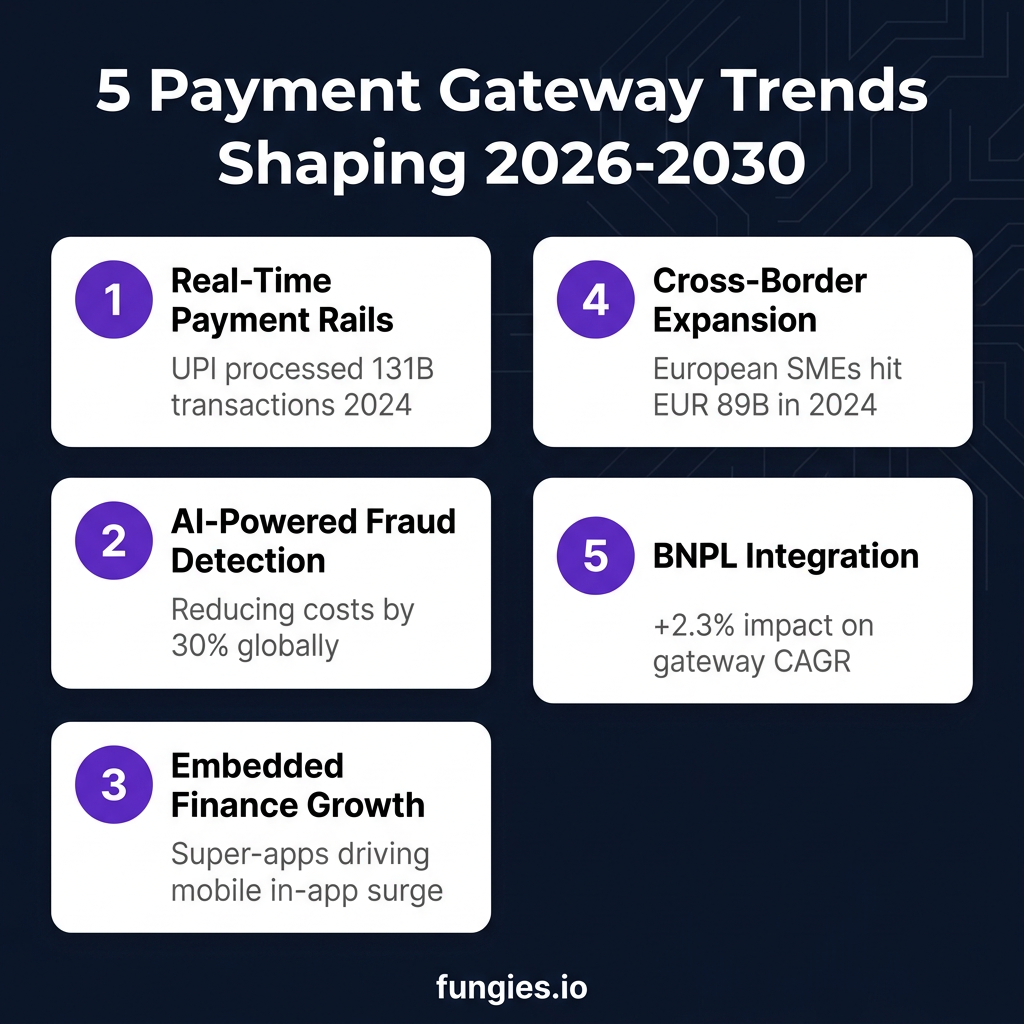
5 Payment Gateway Trends Shaping 2026-2030
The payment gateway landscape is evolving rapidly. Here are the five most significant trends that will define the industry through 2030:
1. Real-Time Payment Rails Go Global
Real-time payment systems are expanding from domestic networks to interconnected global rails. India’s UPI processed 131 billion transactions in 2024 (up 58% YoY), while Thailand’s PromptPay reached 56 million users. These instant-settlement networks cut per-transaction costs by 40-60 basis points and improve merchant liquidity. Singapore’s PayNow Corporate has expanded into B2B invoicing, while Saudi Arabia’s Mada and Nigeria’s Instant Payment system are following similar trajectories.
2. AI-Powered Fraud Detection
Artificial intelligence is transforming fraud prevention, with the potential to reduce fraud-related costs by 30%. Machine learning models analyze transaction patterns in real-time, distinguishing legitimate customers from fraudulent actors with greater accuracy than rule-based systems. This reduces false declines—a significant source of lost revenue—while maintaining security standards.
3. Embedded Finance & Super-Apps
Payment gateways are increasingly embedded directly into non-financial applications. Super-apps in Asia—integrating ride-hailing, food delivery, messaging, and payments—are driving mobile in-app payment growth at a 15.76% CAGR. This trend is spreading globally as merchants seek to reduce checkout friction by meeting customers where they already are.
4. Cross-Border Payment Optimization
Cross-border e-commerce continues to expand, with European SMEs generating EUR 89 billion in cross-border online sales in 2024. Gateways offering dynamic currency conversion and intelligent acquirer routing are reducing foreign-exchange markups to below 1.5%, removing a significant barrier to international growth. Multi-currency support is becoming table stakes for competitive gateway providers.
5. Buy Now, Pay Later (BNPL) Integration
BNPL options are multiplying API calls and deepening gateway engagement. According to Mordor Intelligence, BNPL adoption contributes an estimated +2.3% impact on gateway CAGR. As consumers increasingly expect flexible payment options at checkout, gateways that seamlessly integrate multiple BNPL providers gain a competitive advantage in merchant acquisition.
Methodology
This report synthesizes data from multiple authoritative sources including Grand View Research, Mordor Intelligence, Precedence Research, GM Insights, Fortune Business Insights, TSG (The Strawhecker Group), Baymard Institute, and industry publications from Mastercard, J.P. Morgan, and McKinsey. Market size figures vary across sources due to differing definitions of “payment gateway”—some include broader payment processing infrastructure while others focus strictly on gateway technology.
Regional market share data primarily derives from Mordor Intelligence’s geographic segmentation. Growth projections represent analyst consensus ranges rather than single-point estimates. Conversion and benchmark statistics are compiled from multiple industry studies to provide representative ranges. All figures are current as of May 2026.
Frequently Asked Questions
What is the size of the payment gateway market in 2025?
The global payment gateway market was valued between $18.32 billion and $48.17 billion in 2025, depending on the analyst’s scope and methodology. Grand View Research estimates $48.17 billion, while Mordor Intelligence provides a more conservative $18.32 billion figure focused strictly on gateway technology.
What is the average cart abandonment rate for e-commerce?
The average global shopping cart abandonment rate is approximately 70.19% according to Baymard Institute’s compilation of industry studies. Rates vary significantly by industry—grocery shopping shows lower abandonment (~65%) while automotive and luxury goods can exceed 80%.
Which region has the largest payment gateway market share?
Asia Pacific holds the largest payment gateway market share at 39.74%, driven by massive adoption of real-time payment systems like India’s UPI, Thailand’s PromptPay, and China’s Alipay/WeChat Pay ecosystems.
What is a good payment success rate benchmark?
Merchants should aim for a payment success rate of 95% or higher. Best-in-class merchants in specific industries achieve 96% or better. The difference between 92% and 96% authorization rates can represent millions in recovered revenue for high-volume businesses.
How fast is the payment gateway market growing?
The payment gateway market is projected to grow at a compound annual growth rate (CAGR) between 14.1% and 22.7% through 2033, depending on the forecast source. This growth is driven by e-commerce expansion, mobile payment adoption, and real-time payment system proliferation.
Sources & Citations
- Grand View Research — Payment Gateway Market Size, Share & Trends Report 2033: https://www.grandviewresearch.com/industry-analysis/payment-gateway-market
- Mordor Intelligence — Payment Gateway Market Analysis & Forecast 2026-2031: https://www.mordorintelligence.com/industry-reports/payment-gateway-market
- Precedence Research — Payment Gateway Market Forecast 2026-2035: https://www.precedenceresearch.com/press-release/payment-gateway-market
- GM Insights — Payment Gateway Market Size & Growth Analysis 2035: https://www.gminsights.com/industry-analysis/payment-gateway-market
- Fortune Business Insights — Payment Gateway Market Size & Trend 2034: https://www.fortunebusinessinsights.com/payment-gateway-market-111411
- TSG (The Strawhecker Group) — Directory of U.S. Merchant Acquirers 2026: https://www.businesswire.com/news/home/20260406447086/en/
- Baymard Institute — Cart Abandonment Rate Statistics: https://baymard.com/lists/cart-abandonment-rate
- Dynamic Yield — Shopping Cart Abandonment Rate Benchmarks: https://marketing.dynamicyield.com/benchmarks/cart-abandonment-rate
- GR4VY — Top 12 Payment Performance Benchmarks for 2026: https://gr4vy.com/posts/top-12-payment-performance-benchmarks-for-2026
- BlueSnap — Payment Processing KPI Library: https://cdn2.hubspot.net/hubfs/454819/Offers/Payment%20Processing%20KPI%20Library
- Mastercard — Payment Trends in 2026: https://www.mastercard.com/global/en/business/payments/merchant-cloud/insights/payment-trends-in-2026.html
- J.P. Morgan — Payments Outlook 2026: https://www.jpmorgan.com/insights/payments/trends-innovation/payments-outlook-trends-2026
- McKinsey — Global Payments Report 2025: https://www.mckinsey.com/industries/financial-services/our-insights/global-payments-report
- IMARC Group — US Payment Gateway Market 2026-2034: https://www.imarcgroup.com/united-states-payment-gateways-market
- Capgemini — World Payments Report 2026: https://www.capgemini.com/insights/research-library/world-payments-report
At Fungies.io, we help game developers and SaaS companies accept payments globally with built-in tax compliance. Our no-code checkout handles the complexity so you can focus on building great products.