Payment Processing Statistics 2026: Market Size, Data & Trends (Comprehensive Report)
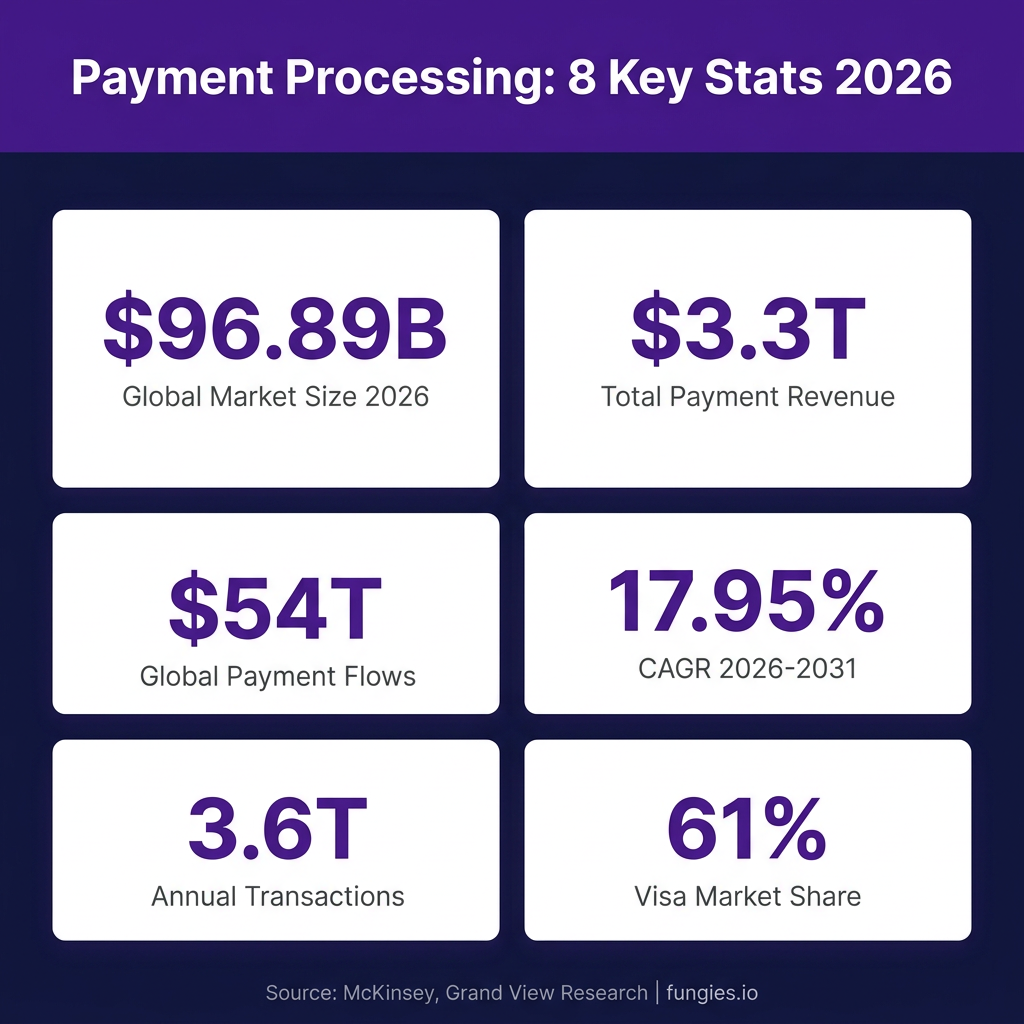
The global payment processing industry is experiencing unprecedented growth, fueled by the rapid digitization of commerce, the proliferation of mobile wallets, and the rise of real-time payment systems. In 2026, the market is projected to reach $96.89 billion, with the total payments ecosystem generating over $3.3 trillion in revenue globally. This comprehensive report examines the key statistics, market dynamics, regional breakdowns, and emerging trends that are reshaping how businesses and consumers move money worldwide.
Key Statistics at a Glance
- The global payment processing solutions market will reach $96.89 billion in 2026, up from $82.14 billion in 2025 (Mordor Intelligence)
- Total global payments revenue is projected at $3.3 trillion by 2026 (McKinsey)
- The industry is processing $2.0 quadrillion in transaction value annually, supporting 3.6 trillion transactions worldwide (McKinsey Global Payments Report 2025)
- Payment processing solutions market is forecast to grow at a CAGR of 17.95% from 2026 to 2031, reaching $221.16 billion (Mordor Intelligence)
- Credit card processing fees range from 1.5% to 3.5% per transaction, with ecommerce merchants paying an average of 2.9%-3.5% (WalletHub, Stesanor)
- Visa dominates with approximately 61% of U.S. credit card spending and 65% of global retail card transactions by volume (Nilson Report)
- More than 70 countries have now adopted real-time payment systems (J.P. Morgan)
- The top 20 global payment companies generated a combined revenue of $280 billion in 2025 (GlobalData)
Market Size & Growth
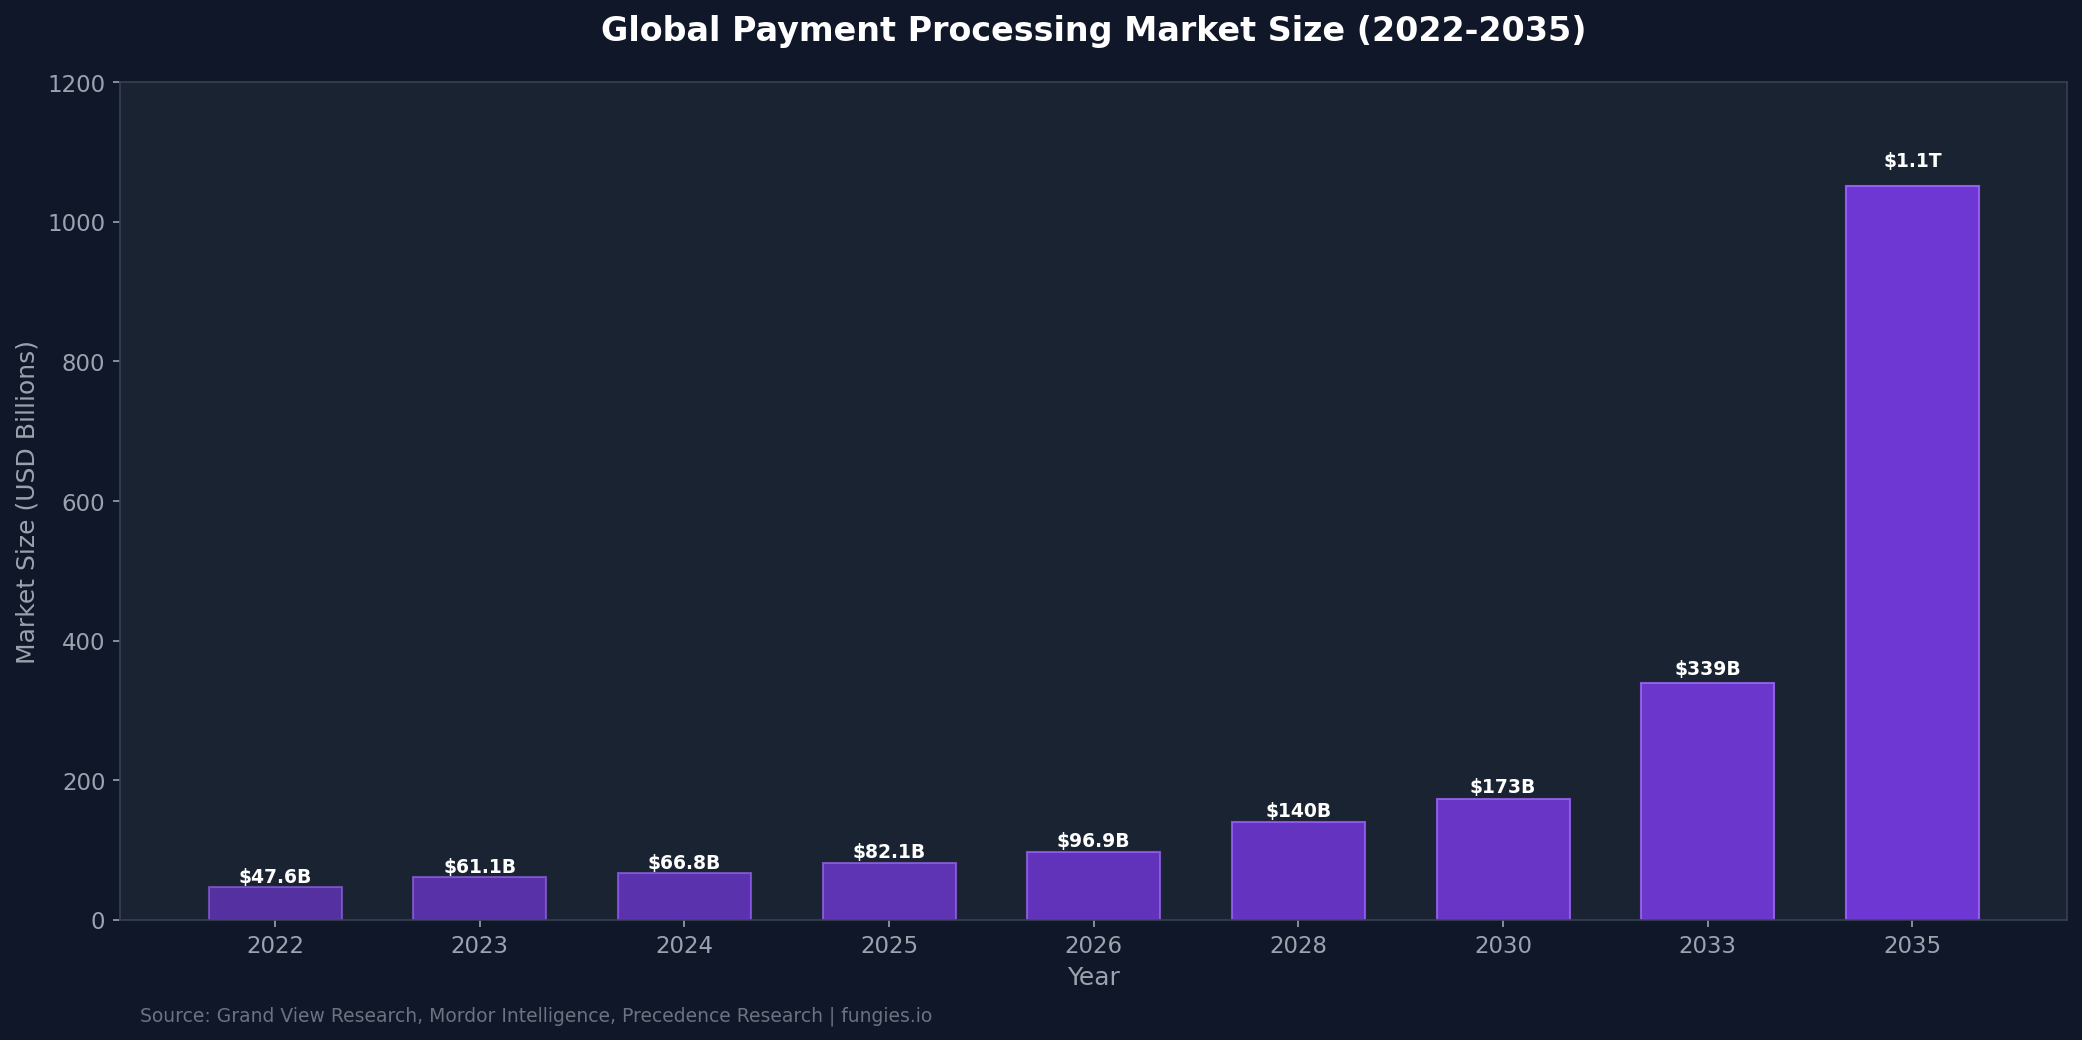
The payment processing industry has demonstrated remarkable resilience and expansion. According to Grand View Research, the global payment processing solutions market was valued at $47.61 billion in 2022 and is projected to reach $139.90 billion by 2030. This represents a compound annual growth rate (CAGR) of approximately 14.5% during this period.
Precedence Research offers even more optimistic projections, estimating the market at $173.38 billion in 2025, growing to $208.57 billion in 2026, and potentially reaching $1.05 trillion by 2035 at a CAGR of 19.76%. This accelerated growth trajectory reflects the increasing adoption of digital payments across all sectors of the economy.
Mordor Intelligence provides a middle-ground estimate, projecting the payment processing solutions market to grow from $82.14 billion in 2025 to $96.89 billion in 2026, ultimately reaching $221.16 billion by 2031 at a 17.95% CAGR. The payment processor market specifically (a subset focused on transaction processing) is expected to grow from $63.87 billion in 2025 to $71.15 billion in 2026, reaching $122.08 billion by 2031 at an 11.4% CAGR.
| Year | Market Size (USD Billion) | Source |
|---|---|---|
| 2022 | $47.61B | Grand View Research |
| 2023 | $61.10B | Industry Reports |
| 2024 | $66.80B | GM Insights |
| 2025 | $82.14B | Mordor Intelligence |
| 2026 | $96.89B | Mordor Intelligence |
| 2028 | $139.90B | Grand View Research |
| 2030 | $173.38B | Precedence Research |
| 2031 | $221.16B | Mordor Intelligence |
| 2035 | $1,051.93B | Precedence Research |
Global Payment Flows & Transaction Volume
The scale of global payment flows is staggering. According to J.P. Morgan’s “Payments Are Eating the World” report, payment mega-themes currently account for approximately $54 trillion in global payment flows. This massive volume is distributed across several key categories:
- Platforms: $36 trillion in global payment volumes
- E-commerce, digital identity, gig & creator economies: $6.8 trillion
- Wallets: $4.4 trillion in global payment volumes
- Real-time transactions: $5.3 trillion
- Embedded payments: $1.1 trillion
McKinsey’s 2025 Global Payments Report reveals that the industry generated $2.5 trillion in revenue from $2.0 quadrillion in value flows, supported by 3.6 trillion transactions worldwide. From 2019 to 2024, global payments revenue increased on average by 7% annually, with interest income making up 46% of total revenues.
Cross-border payments represent a significant and growing segment. The global cross-border payment market was valued at $371.59 billion in 2025 and is projected to grow from $397.37 billion in 2026 to $727.74 billion by 2034, exhibiting a CAGR of 7.90%. Asia Pacific dominated this market with a 46.30% share in 2025 (Fortune Business Insights).
Regional Breakdown
The payment processing landscape varies significantly by region, influenced by factors such as regulatory environments, technological infrastructure, and consumer preferences.
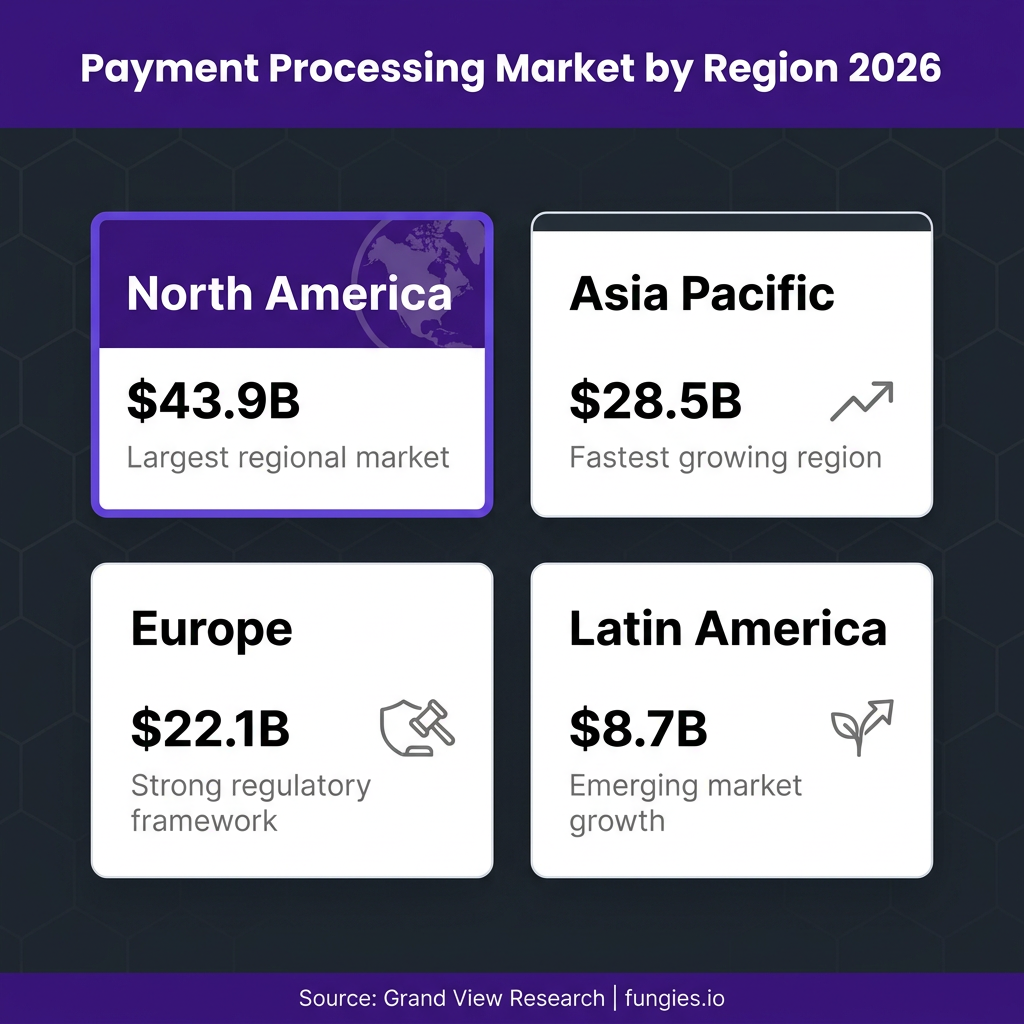
North America remains the largest regional market for payment processing solutions. According to Grand View Research, the North American market is expected to reach $43.93 billion by 2030. The United States alone is projected to generate $36.75 billion in payment processing revenue by 2030. The U.S. payment processor market is expected to grow at a 6.4% CAGR from 2026 to 2033.
Asia Pacific represents the fastest-growing region, driven by massive digital wallet adoption. In China, digital wallets already support 82% of online purchases and 66% of in-store payments. India passed the 50% digital wallet adoption milestone across all transaction types in 2024. The region’s dominance in cross-border payments (46.30% market share) underscores its central role in global commerce.
Europe maintains a strong position with a well-developed regulatory framework, including initiatives like PSD2 and open banking. The region has seen significant adoption of contactless payments and real-time payment systems.
| Region | 2026 Market Size | Key Characteristics |
|---|---|---|
| North America | $43.9B (by 2030) | Largest market, mature infrastructure |
| Asia Pacific | $28.5B+ | Fastest growth, digital wallet dominance |
| Europe | $22.1B+ | Strong regulation, open banking |
| Latin America | $8.7B+ | Emerging market, high growth potential |
| Middle East & Africa | $6.2B+ | Mobile-first adoption |
Key Players & Market Share
The payment processing industry is dominated by a handful of global giants, with Visa and Mastercard forming a duopoly outside of China. According to Quartr Insights, Visa and Mastercard control roughly 90% of the payment processing market outside of China.
Visa holds the largest share, processing about 65% of global retail card transactions by volume. The company reported $15.6 trillion in payments volume. In the U.S. market, Visa captures 61% of credit card spending (Nilson Report).
Mastercard maintains the second position globally, with significant market share across all regions. The company has been deliberately pivoting into value-added services including data analytics, cybersecurity solutions, and open banking APIs.
According to LinkedIn data from Panagiotis Kriaris, the leaders by estimated 2025 U.S. processing volume are:
- Global Payments Inc.: $2.77 trillion
- J.P. Morgan: $2.45 trillion
- Fiserv: $2.20 trillion
- Stripe: Significant volume (exact figures not disclosed)
GlobalData reports that the world’s 20 largest listed payment companies generated a combined revenue of $280 billion in 2025, representing 8% year-over-year growth. Growth is increasingly concentrated among firms exposed to cross-border transactions, digital commerce, and software-integrated payments.
| Company | 2025 U.S. Processing Volume | Global Position |
|---|---|---|
| Global Payments Inc. | $2.77 trillion | #1 U.S. processor |
| J.P. Morgan | $2.45 trillion | Major bank processor |
| Fiserv | $2.20 trillion | Top 3 U.S. processor |
| Visa | $15.6T global volume | Network leader |
| Mastercard | Major global volume | #2 network |
Industry Benchmarks & KPIs
Understanding payment processing benchmarks is essential for merchants and payment professionals. Here are the key metrics that define industry performance:
Processing Fees: Credit card processing fees in 2026 range from 1.5% to 3.5% per transaction. Ecommerce merchants pay an average of 2.9%-3.5%, with real effective rates often exceeding 3.2% due to hidden costs (Stesanor). Interchange fees typically range from 1.15% to 2.80% plus $0.05-$0.10 per transaction.
Payment Conversion Rates: According to BlueSnap, up to 40% of online sales are currently being lost due to payment gateway shortcomings and checkout friction. This highlights the critical importance of optimizing payment flows.
Alternative Payment Methods: TNS reports that 31% of payments in the U.S. are now made through alternative payment methods, including digital wallets, QR codes, and buy-now-pay-later options.
Localization Impact: Airwallex research shows that 93% of global consumers say pricing in their local currency affects their purchase decision, making payment localization vital for conversion.
| Metric | Benchmark | Source |
|---|---|---|
| Average Processing Fee | 1.5% – 3.5% | WalletHub, NerdWallet |
| Ecommerce Processing Fee | 2.9% – 3.5% | Stesanor |
| Interchange Fees | 1.15% – 2.80% + $0.05-0.10 | Premier Payments |
| Lost Sales (Friction) | Up to 40% | BlueSnap |
| Alternative Payment Usage | 31% (U.S.) | TNS |
| Local Currency Importance | 93% of consumers | Airwallex |
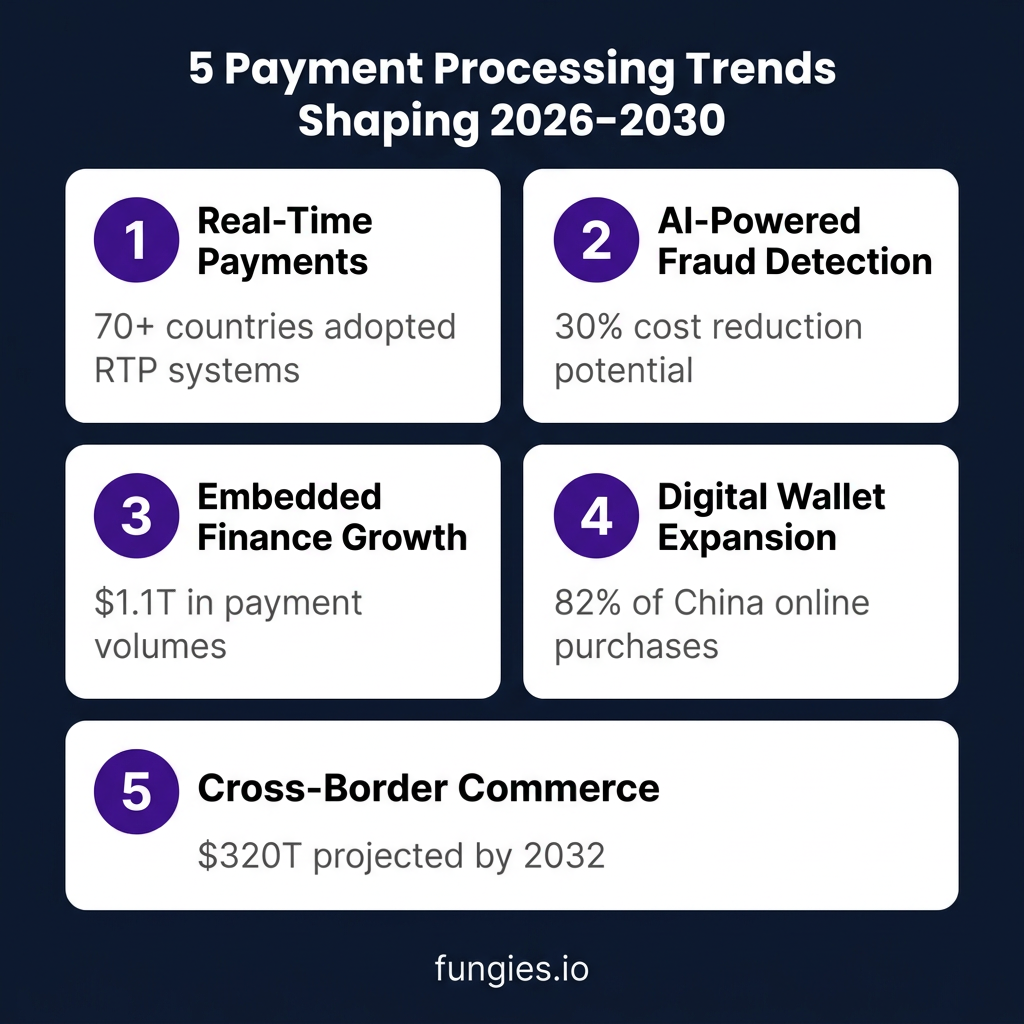
Trends & Predictions (2026-2030)
The payment processing industry is undergoing rapid transformation. Here are the five major trends shaping the future:
1. Real-Time Payments (RTP) Expansion
More than 70 countries have now adopted real-time payment systems, according to J.P. Morgan. Global instant payments are set to continue growing at double-digit rates, significantly outpacing card growth. Real-time transactions currently account for $5.3 trillion in global payment volumes.
2. AI-Powered Fraud Detection
According to Airwallex, AI applications in automation and fraud detection can potentially reduce costs by 30%. A Pay360 Intelligence Report found that 70% of payment professionals identify enhancing fraud detection and risk management as the top use case for AI in payments.
3. Embedded Finance Growth
Embedded payments currently account for $1.1 trillion in global payment volumes. McKinsey notes that in the United States, payment-processing revenue through ISVs (Independent Software Vendors) has grown at 20% annually for the last five years.
4. Digital Wallet Dominance
Digital wallet usage in physical transactions is projected to increase by 15% by 2026. In China, digital wallets support 82% of online purchases. Mastercard processed nearly 160 billion transactions in 2024, harnessing insights to deliver personalized content and tailored offers.
5. Cross-Border Commerce Acceleration
Cross-border payment flows are projected to grow from $194.6 trillion in 2024 to $320 trillion by 2032 (J.P. Morgan). This growth is driven by surging cross-border B2C remittances and accelerating e-commerce globalization.
Challenges & Costs
Despite the growth opportunities, the payment processing industry faces significant challenges:
High Transaction Fees: Merchants continue to grapple with complex fee structures. A business processing $10,000 monthly pays approximately $150-$350 in credit card processing fees alone (Premier Payments).
Fraud & Chargebacks: Fraudulent transactions remain a major concern. Excessive chargebacks can lead to businesses being classified as high-risk by payment processors, resulting in higher fees or account termination.
Regulatory Complexity: Navigating the complex web of international financial regulations is one of the most significant challenges businesses face in global payment processing. Compliance costs continue to rise as regulations evolve.
Technology Integration: According to the Pay360 Intelligence Report, 85% of retailers report barriers to AI implementation in payments, despite recognizing its potential benefits.
Payment Methods & Technology Segmentation
The payment processing landscape is diversifying rapidly beyond traditional card payments. According to Research and Markets, the market is segmented by payment mode into eWallet, Credit Card, Debit Card, Automatic Clearing House (ACH), and other emerging methods. Credit cards are expected to account for 31.0% of the payment method segment in 2026, driven by steady procurement volumes and standardization across applications (Future Market Insights).
Point-of-sale card transactions held 41.43% of global payments market share in 2025, anchored by decades-old EMV infrastructure and global brand trust. However, this dominance is being challenged by alternative payment methods. According to the Pay360 Intelligence Report, digital payments market penetration has grown from approximately 40% in 2018 to over 75% in 2026.
Cloud-based deployment is becoming the preferred model for payment processing solutions. The shift from on-premises to cloud-based infrastructure enables faster scaling, reduced operational costs, and enhanced security capabilities. Major processors are investing heavily in cloud-native architectures to support real-time transaction processing and global expansion.
| Payment Method | Market Share | Growth Outlook |
|---|---|---|
| Credit Cards | 31.0% | Steady growth |
| Digital Wallets | 28%+ | Fastest growing |
| Debit Cards | 24% | Stable |
| ACH/Wire | 10% | B2B growth |
| Other (BNPL, Crypto) | 7% | Emerging |
Industry Verticals & Use Cases
Payment processing adoption varies significantly across industry verticals. The retail and e-commerce sector remains the largest adopter, driven by the continued growth of online shopping and omnichannel commerce. According to J.P. Morgan, the combination of e-commerce, digital identity solutions, and the growing gig and creator economies accounts for $6.8 trillion in global payment volumes.
The BFSI (Banking, Financial Services and Insurance) sector is the largest enterprise user of payment processing solutions, followed by IT & Telecommunication, Healthcare, and Government & Utilities. Each vertical has unique requirements for compliance, security, and transaction speed that influence processor selection.
For SaaS companies and digital product creators, choosing the right payment processing infrastructure is critical. Platforms like Fungies.io offer integrated payment solutions that handle the complexity of global tax compliance, multiple payment methods, and localized checkout experiences—reducing the burden on developers while maximizing conversion rates.
Investment & Innovation Landscape
The payment processing sector continues to attract significant investment. Fintech companies raised billions in venture capital funding in 2025, with payment infrastructure and embedded finance among the top categories. According to McKinsey, ISV-integrated payments revenue has grown at 20% annually for the last five years in the United States.
Key innovation areas include:
- Tokenization: Replacing sensitive card data with secure tokens to reduce fraud risk
- Biometric Authentication: Fingerprint, facial recognition, and voice authentication for enhanced security
- Blockchain & Stablecoins: Visa and Circle partnered in 2025 to bring USDC settlement to U.S. banks
- ISO 20022: The new global messaging standard for payments, now live at major institutions including J.P. Morgan Chase
- Agentic Commerce: AI-powered purchasing agents that automate transactions on behalf of consumers
Mastercard reports that nearly 160 billion transactions were processed in 2024, generating insights that power personalized advertising and tailored offers. The company is leveraging this data to deliver more relevant content to consumers at precisely the right time.
Methodology
This report synthesizes data from multiple authoritative sources including McKinsey’s Global Payments Report 2025, Grand View Research, Mordor Intelligence, Precedence Research, Fortune Business Insights, J.P. Morgan Payments Research, and industry publications such as the Nilson Report. Market size figures represent the most recent available estimates as of June 2026. Regional breakdowns are based on analyst reports and publicly available company filings. Growth projections (CAGRs) are calculated from base year data through forecast periods specified by each source. Transaction volume figures represent annual flows through payment networks and processing systems. All monetary values are expressed in U.S. dollars unless otherwise noted.
Frequently Asked Questions
What is the size of the payment processing market in 2026?
The global payment processing solutions market is projected to reach $96.89 billion in 2026, according to Mordor Intelligence. However, estimates vary by source—Precedence Research projects $208.57 billion for 2026, reflecting different market definitions and scope. The broader global payments ecosystem generates over $3.3 trillion in annual revenue.
What is the average credit card processing fee in 2026?
Credit card processing fees in 2026 typically range from 1.5% to 3.5% per transaction. Ecommerce merchants pay an average of 2.9%-3.5%, while in-person transactions generally cost less. The real effective rate often exceeds advertised rates due to interchange fees, assessment fees, and processor markups.
Who are the largest payment processing companies?
By U.S. processing volume, the leaders are Global Payments Inc. ($2.77T), J.P. Morgan ($2.45T), and Fiserv ($2.20T). Globally, Visa and Mastercard dominate the card network space with approximately 90% market share outside China. The top 20 listed payment companies generated $280 billion in combined revenue in 2025.
What is the fastest growing region for payment processing?
Asia Pacific is the fastest-growing region, driven by massive digital wallet adoption. The region holds a 46.30% share of the cross-border payments market. China leads with 82% of online purchases made via digital wallets, while India passed 50% digital wallet adoption in 2024.
What are the key trends shaping payment processing?
The five major trends are: (1) Real-time payments adoption across 70+ countries, (2) AI-powered fraud detection with 30% cost reduction potential, (3) Embedded finance growth at 20% annually, (4) Digital wallet expansion projected to increase 15% by 2026, and (5) Cross-border commerce growth from $194.6T to $320T by 2032.
Sources & Citations
- McKinsey & Company. “The 2025 McKinsey Global Payments Report.” https://www.mckinsey.com/industries/financial-services/our-insights/global-payments-report
- Grand View Research. “Payment Processing Solutions Market Size Report, 2030.” https://www.grandviewresearch.com/industry-analysis/payment-processing-solutions-market
- Mordor Intelligence. “Payment Processing Solutions Market Size & Share Analysis 2026-2031.” https://www.mordorintelligence.com/industry-reports/payment-processing-solutions-market
- Precedence Research. “Payment Processing Solutions Market Size to Hit USD 1051.93 Bn by 2035.” https://www.precedenceresearch.com/payment-processing-solutions-market
- J.P. Morgan. “Payments Are Eating the World.” https://www.jpmorgan.com/insights/payments/trends-innovation/payments-are-eating-the-world
- J.P. Morgan. “2025 Cross-Border Payments Trends for Financial Institutions.” https://www.jpmorgan.com/insights/payments/fx-cross-border/2025-trends-for-financial-institutions
- Fortune Business Insights. “Cross Border Payment Market Size, Share | Growth [2026-2034].” https://www.fortunebusinessinsights.com/cross-border-payments-market-110223
- Fortune Business Insights. “Real-Time Payments Market Size | Industry Report, 2034.” https://www.fortunebusinessinsights.com/real-time-payments-market-110424
- Research and Markets. “Payment Processors Market Analysis and Growth Forecast 2026-2031.” https://finance.yahoo.com/news/payment-processors-market-analysis-growth-105900845.html
- GlobalData via Yahoo Finance. “Top 20 global payment companies’ revenue rises 8% in 2025.” https://finance.yahoo.com/markets/currencies/articles/top-20-global-payment-companies-100544645.html
- Capital One Shopping. “Credit Card Market Share (2026): Visa vs Mastercard vs Others.” https://capitaloneshopping.com/research/credit-card-market-share-statistics
- Quartr. “Visa and Mastercard: The Global Payment Duopoly.” https://quartr.com/insights/edge/visa-and-mastercard-the-global-payment-duopoly
- WalletHub. “Average Credit Card Processing Fees (2026).” https://wallethub.com/edu/cc/average-credit-card-processing-fees/138461
- Stesanor. “Credit Card Processing Fees: Benchmarks, Data & Real Effective Rates (Updated 2026).” https://stesanor.com/processing-fee-statistics
- NerdWallet. “Credit Card Processing Fees: A 2026 Guide for Businesses.” https://www.nerdwallet.com/business/software/learn/credit-card-processing-fees
- Airwallex. “32 global payment processing industry statistics and trends for 2025.” https://www.airwallex.com/us/blog/payment-processing-industry-statistics
- BlueSnap. “Measuring The Performance Of Your Payment Process: 3 KPIs You Need To Know.” https://www.bluesnap.com/payment-metrics
- TNS. “Five Challenges for Merchants in Payment Processing.” https://tnsi.com/resource/pay/five-challenges-for-merchants-in-payment-processing-blog
- Pay360 Intelligence Report. “The Global Payments Landscape: Key Trends Shaping the Future.” https://thepaymentsassociation.org/wp-content/uploads/2026/03/Pay360_Intelligence_Report.pdf
- Future Market Insights. “Payment Processing Solutions Market | Global Market Analysis Report – 2036.” https://www.futuremarketinsights.com/reports/payment-processing-solutions-market
Last updated: June 22, 2026. Data compiled from publicly available industry reports and research publications.