SaaS Market Statistics 2026: Global Size, Growth Data & Industry Trends (Comprehensive Report)
The global Software as a Service (SaaS) market has reached an inflection point in 2026. With the market valued at approximately $465 billion and projected to more than triple to $1.37 trillion by 2035, SaaS has cemented itself as the dominant software delivery model for businesses worldwide. What’s particularly striking isn’t just the scale—it’s the velocity. AI-native SaaS companies are achieving what took traditional SaaS players a decade to accomplish, reaching $40 million in ARR within their first year of operation.
This comprehensive report compiles verified data from Fortune Business Insights, Precedence Research, Technavio, Gartner, and other authoritative sources to give you the complete picture: market size and projections, regional breakdowns, competitive dynamics, operational benchmarks, and the five trends that will define the next decade of SaaS growth.
Key SaaS Market Statistics at a Glance
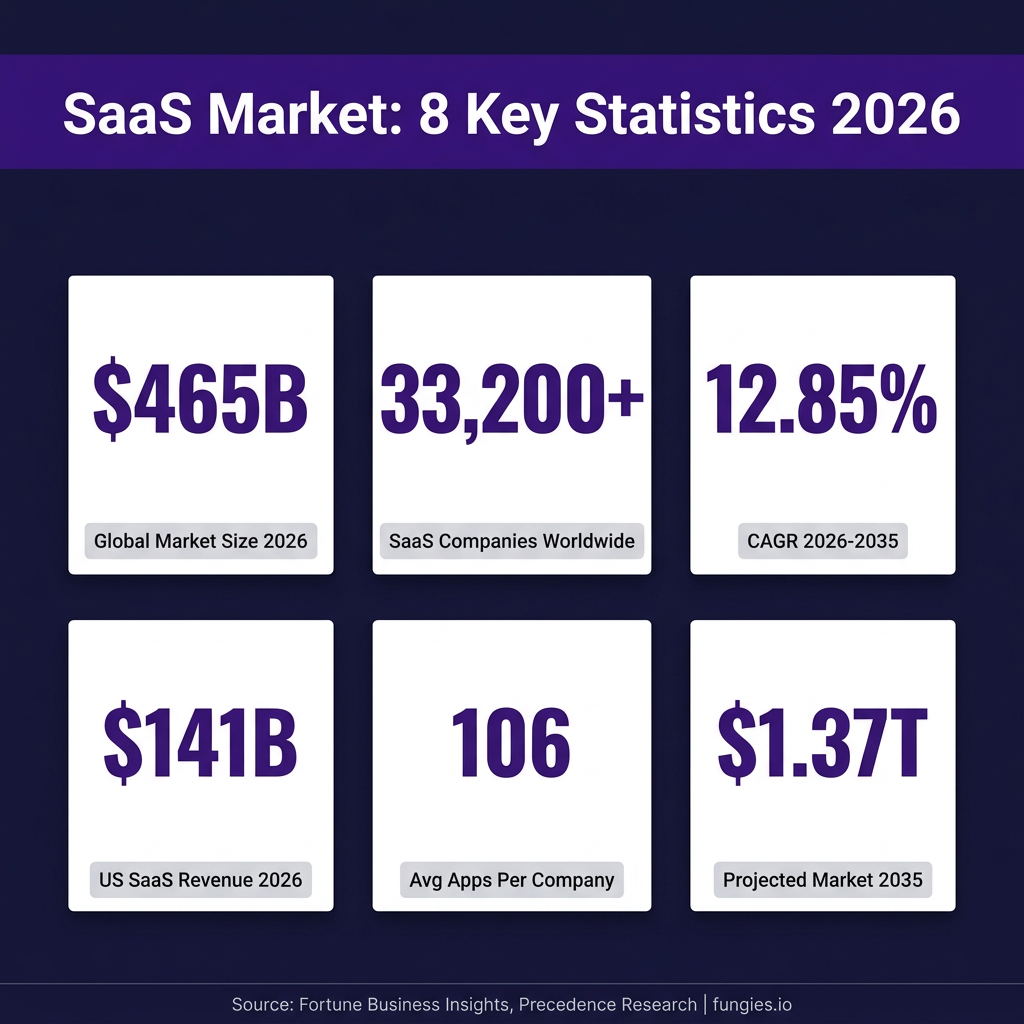
- $465.03 billion — Global SaaS market size in 2026 (Precedence Research)
- 12.85% CAGR — Projected growth rate from 2026 to 2035
- $1.37 trillion — Forecasted market size by 2035
- 33,200+ — Number of SaaS companies worldwide as of 2026
- 17,000 — SaaS companies based in the United States alone
- 106 — Average number of SaaS applications per company (down from 130 in 2022)
- $141.06 billion — U.S. SaaS revenue projected for 2026
- 56.9% — North America’s share of global SaaS market growth
- $4,830 — Average SaaS spending per employee per year
- 3.2:1 — Median LTV:CAC ratio for B2B SaaS companies
SaaS Market Size & Growth Projections
The SaaS market has demonstrated remarkable resilience and growth trajectory. According to Precedence Research, the global SaaS market was estimated at $408.21 billion in 2025 and is predicted to reach $465.03 billion in 2026. This represents a year-over-year growth rate that outpaces most traditional software segments.
The long-term outlook is equally compelling. The same research projects the market will expand to approximately $1.37 trillion by 2035, representing a compound annual growth rate (CAGR) of 12.85% from 2026 to 2035. This trajectory positions SaaS as one of the fastest-growing segments within the broader enterprise software market.
Alternative analyses provide additional context. Grand View Research estimates the market at $399.10 billion in 2024, projecting growth to $819.23 billion by 2030 at a 12.0% CAGR. Meanwhile, Technavio forecasts the market will increase by $616 billion between 2025 and 2030, representing a more aggressive 21.7% CAGR.
| Year | Market Size | Source |
|---|---|---|
| 2024 | $399.10 billion | Grand View Research |
| 2025 | $408.21 billion | Precedence Research |
| 2026 | $465.03 billion | Precedence Research |
| 2029 | $793.10 billion | Statista |
| 2030 | $819.23 billion | Grand View Research |
| 2035 | $1.37 trillion | Precedence Research |
SaaS Market by Region
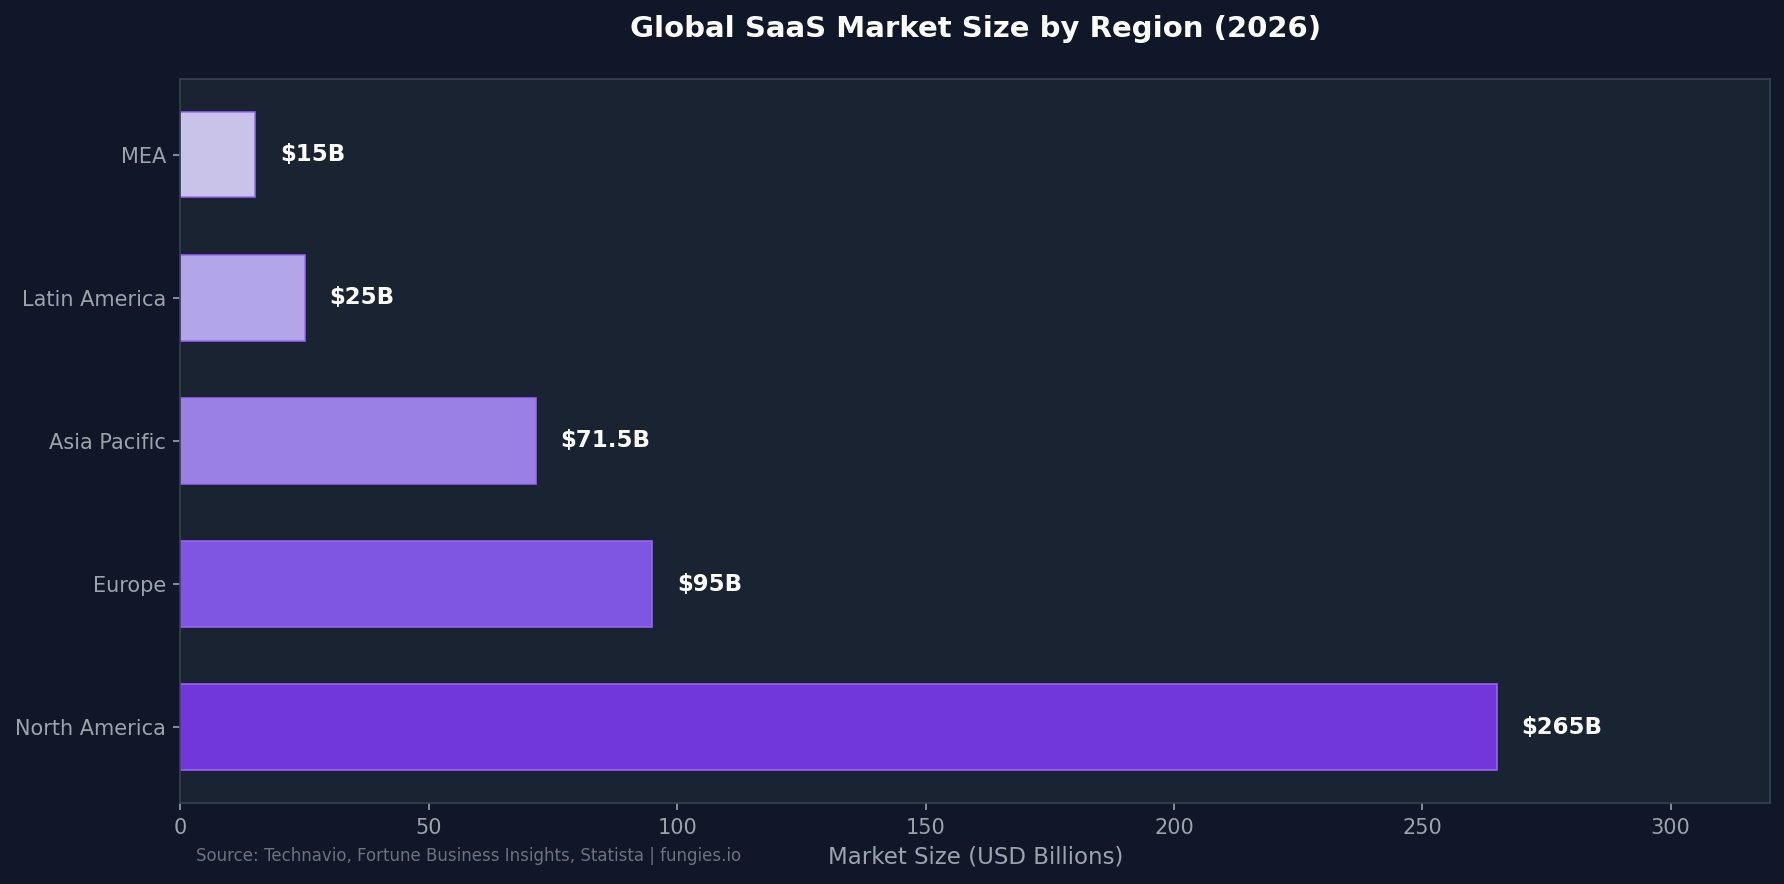
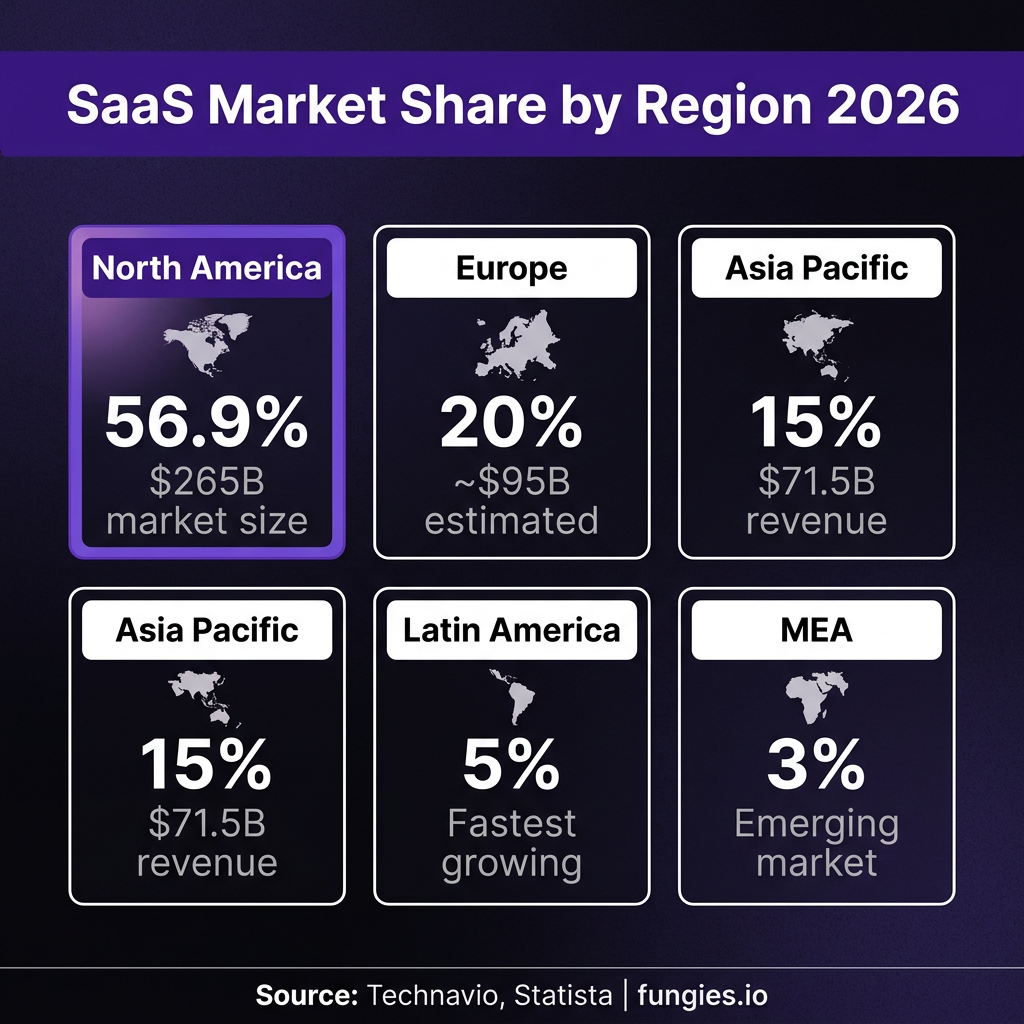
Regional distribution of the SaaS market reveals significant concentration in developed markets, with emerging regions showing the strongest growth potential. According to Technavio, North America dominates with 56.9% of market growth during the forecast period, driven by the United States’ mature cloud infrastructure and high enterprise adoption rates.
The United States alone hosts approximately 17,000 SaaS companies and is expected to generate $141.06 billion in SaaS revenue in 2026, according to Fortune Business Insights. This concentration reflects the country’s early investment in cloud infrastructure, robust venture capital ecosystem, and large enterprise customer base.
Europe represents the second-largest regional market, holding approximately 20% of global market share with an estimated market size of $95 billion. The Asia-Pacific region is emerging as the fastest-growing market, with projections indicating SaaS revenue will reach $71.47 billion in 2025, growing at a CAGR of 20.79% through 2030.
| Region | Market Share | Est. Market Size (2026) | Growth Rate |
|---|---|---|---|
| North America | 56.9% | $265 billion | 11.5% CAGR |
| Europe | ~20% | $95 billion | 10.8% CAGR |
| Asia Pacific | ~15% | $71.5 billion | 20.79% CAGR |
| Latin America | ~5% | $25 billion | Fastest growing |
| Middle East & Africa | ~3% | $15 billion | Emerging |
Key Players & Market Share
The SaaS market remains highly fragmented, with different vendors leading distinct segments. According to Synergy Research Group, Microsoft leads the overall SaaS market, followed by Salesforce, Adobe, Oracle, and SAP. This ranking reflects the broad portfolio approach these vendors have taken, spanning multiple SaaS categories from productivity to CRM to enterprise resource planning.
Salesforce maintains its position as the largest pure-play SaaS company, with a market capitalization exceeding $161 billion and annual revenue surpassing $34 billion in 2024. The company’s dominance in customer relationship management (CRM) has served as a foundation for expansion into adjacent categories including analytics, marketing automation, and customer service.
High-growth challengers are reshaping the competitive landscape. According to Bessemer Venture Partners, AI-native software companies are achieving unprecedented growth velocity—some reaching approximately $3 million in ARR within their first year and scaling to roughly $100 million by year four, significantly outpacing traditional SaaS growth timelines.
| Company | Category | Market Position |
|---|---|---|
| Microsoft | Productivity/Cloud | Market Leader |
| Salesforce | CRM | Pure-Play Leader |
| Adobe | Creative/Marketing | Top 3 |
| Oracle | ERP/Database | Top 5 |
| SAP | ERP | Top 5 |
| ServiceNow | IT Service Management | Category Leader |
| Workday | HCM/Finance | Category Leader |
SaaS Industry Benchmarks & KPIs
Understanding operational benchmarks is critical for SaaS businesses evaluating performance and for investors assessing opportunities. According to Vena Solutions, the average annual churn rate for SaaS companies ranges from 5-7%, though this varies significantly by segment and customer type.
B2B SaaS companies specifically show a median annual churn rate of approximately 4.9%, with “good” performance defined as below 1% monthly (translating to under 12% annually). Enterprise-focused SaaS typically achieves lower churn rates than SMB-focused products due to higher switching costs and longer sales cycles.
Unit economics benchmarks from Optifai reveal that B2B SaaS LTV ranges from $15,000-$40,000 for SMB customers to $300,000-$1 million+ for Enterprise accounts. The median LTV:CAC ratio across all segments is 3.2:1, with a healthy target of 3:1 minimum and 5:1+ indicating strong efficiency.
| Metric | Benchmark | Source |
|---|---|---|
| Annual Churn (All SaaS) | 5-7% | Vena Solutions |
| Annual Churn (B2B SaaS) | 4.9% | Vena Solutions |
| Monthly Churn Target | <1% | Industry Standard |
| LTV:CAC Ratio (Median) | 3.2:1 | Optifai |
| LTV:CAC Target | 3:1 minimum | SaaS Hero |
| CAC Payback Period | 6-12 months | SaaS Hero |
| Net Revenue Retention | >100% | Industry Standard |
| Rule of 40 | >40% | Industry Standard |
SaaS Adoption & Enterprise Usage
Enterprise adoption of SaaS has reached saturation levels in many categories. According to SellersCommerce, the average company now uses 106 SaaS applications—down from a peak of 130 in 2022, suggesting a consolidation trend as organizations rationalize their software portfolios.
SaaS spending per employee has become a significant line item in corporate budgets. PactAlert research indicates companies spend an average of $4,830 per employee per year on SaaS subscriptions. This varies dramatically by company size—startups with 15 employees spend approximately $8,000 per employee, while larger organizations with 75+ employees achieve economies of scale at around $2,583 per employee.
The management challenge has intensified alongside adoption. According to BetterCloud, 85% of organizations automate some SaaS management processes, while 56% find SaaS file security impossible to monitor manually. This complexity has created a new category of SaaS management platforms, with 50% of organizations expected to adopt SMPs with AI governance features by 2027.
| Company Size | Avg SaaS Apps | Spend Per Employee |
|---|---|---|
| Small (1-50) | 50-100 | $8,000 |
| Medium (51-200) | 100-150 | $4,830 |
| Large (200+) | 150-275 | $2,583 |
5 SaaS Trends Shaping 2026-2030
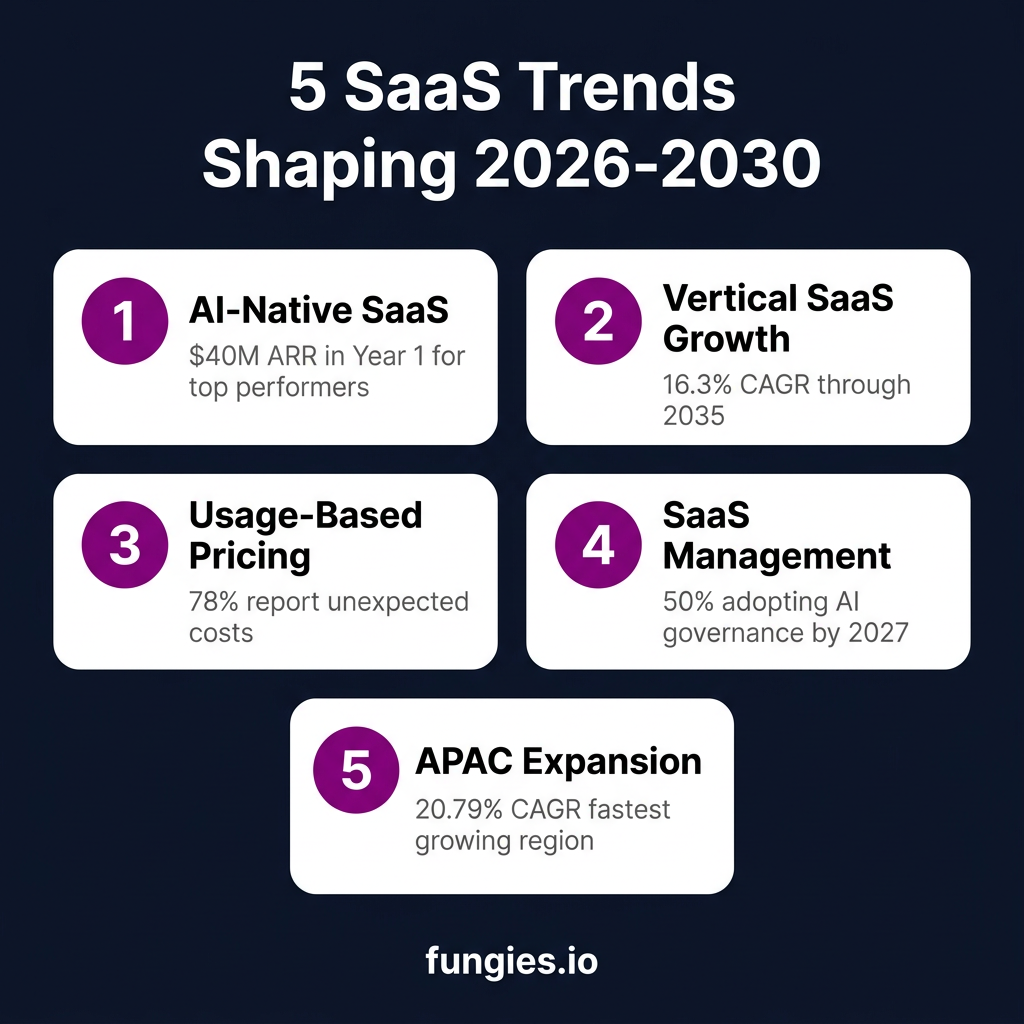
1. AI-Native SaaS Redefining Growth Benchmarks
AI integration has moved from experimental feature to core infrastructure. According to Zylo, organizations now use an average of 7.3 SaaS apps with AI functionality. More significantly, AI-native companies are achieving growth rates that traditional SaaS businesses cannot match—reaching $40 million ARR in year one and exceeding $120 million by year two, per Bessemer Venture Partners.
2. Vertical SaaS Capturing Market Share
Horizontal SaaS platforms face increasing competition from vertical solutions designed for specific industries. The vertical SaaS market is estimated at $143.45 billion in 2026 and is forecast to grow at a 16.3% CAGR through 2035. These specialized solutions offer deeper functionality for niche use cases, challenging generalist platforms in healthcare, real estate, retail, and manufacturing.
3. Usage-Based Pricing Creating Cost Volatility
Consumption-based pricing models are becoming more common, replacing predictable subscription fees with variable costs tied to actual usage. According to Zylo’s 2025 SaaS Management Index, 78% of IT leaders report unexpected costs from usage-based or AI pricing models. This shift requires new approaches to budgeting and cost management.
4. SaaS Management Platforms Becoming Essential
As SaaS portfolios grow in complexity, dedicated management platforms are transitioning from nice-to-have to critical infrastructure. BetterCloud reports that 65% of organizations say their SaaS management platform is critical to file and data security. Looking ahead, 50% of organizations will adopt SMPs with AI governance features by 2027.
5. Asia-Pacific Emerging as Growth Engine
While North America and Europe remain the largest markets, Asia-Pacific is becoming the decisive growth engine for global software companies. With a projected 20.79% CAGR through 2030 according to TechFuture Search, APAC offers the expansion opportunity that mature Western markets cannot match. Companies that invest in regional fluency and localized products will define the next chapter of SaaS growth.
Methodology & Data Sources
This report synthesizes data from multiple authoritative sources to provide a comprehensive view of the SaaS market. Market size figures represent the consensus range across major research firms including Fortune Business Insights, Grand View Research, Precedence Research, and Technavio. Regional breakdowns are derived from Technavio’s geographic analysis and Statista’s regional forecasts.
Benchmark data on churn, LTV, CAC, and other operational metrics comes from industry-specific research by SaaS Capital, Optifai, Vena Solutions, and SaaS Hero. Adoption statistics are sourced from BetterCloud’s State of SaaS report, Zylo’s SaaS Management Index, and SellersCommerce industry analysis.
All figures are current as of June 2026. Market projections reflect analyst consensus estimates and are subject to change based on macroeconomic conditions, technological developments, and competitive dynamics. Where sources provide conflicting figures, we have presented the range or indicated the most conservative estimate.
Frequently Asked Questions
What is the size of the SaaS market in 2026?
The global SaaS market is valued at approximately $465 billion in 2026, according to Precedence Research. Alternative estimates from Grand View Research ($399 billion for 2024) and Fortune Business Insights ($375-466 billion range) provide additional context. The market is projected to reach $1.37 trillion by 2035.
What is the growth rate of the SaaS industry?
The SaaS industry is growing at a compound annual growth rate (CAGR) of 12.85% according to Precedence Research, with other analysts estimating ranges from 12.0% (Grand View Research) to 21.7% (Technavio). Growth rates vary significantly by region, with Asia-Pacific leading at 20.79% CAGR.
How many SaaS companies exist worldwide?
There are approximately 33,200 SaaS companies worldwide as of 2026, representing a 32% increase from 25,000 companies in 2021. The United States alone accounts for roughly 17,000 SaaS companies, making it the largest ecosystem globally.
What is a good churn rate for SaaS companies?
A “good” annual churn rate for B2B SaaS companies is generally considered to be below 5%, which translates to less than 1% monthly churn. The median annual churn for B2B SaaS is 4.9%, while the overall SaaS average ranges from 5-7%. Enterprise-focused SaaS typically achieves lower churn than SMB-focused products.
What is the average LTV:CAC ratio for SaaS?
The median LTV:CAC ratio across B2B SaaS segments is 3.2:1. A healthy SaaS business should maintain at least a 3:1 ratio, with elite performers achieving 4:1 or higher. Ratios below 3:1 indicate unsustainable unit economics, while ratios above 5:1 suggest strong efficiency and growth potential.
Sources & Citations
- Precedence Research — Software as a Service (SaaS) Market Size, Share, and Trends 2026 to 2035
- Grand View Research — Software As A Service Market Size | Industry Report, 2030
- Technavio — Software As A Service (SaaS) Market Size 2026-2030
- Fortune Business Insights — Software as a Service [SaaS] Market Size, Global Report, 2034
- Statista — Software as a Service: market data & analysis
- Synergy Research Group — Microsoft Leads in SaaS Market; Salesforce, Adobe, Oracle and SAP Follow
- Vena Solutions — 85 SaaS Statistics, Trends and Benchmarks for 2026
- Zylo — 175+ Unmissable SaaS Statistics for 2026
- BetterCloud — The big list of 2026 SaaS statistics
- SellersCommerce — 31 Eye-Opening SaaS Statistics In 2026
- Companies History — SaaS Industry Growth Statistics 2026
- Optifai — B2B SaaS LTV Benchmarks
- SaaS Hero — Best LTV to CAC Ratio Benchmarks for B2B SaaS in 2026
- PactAlert — How Much Do Startups Really Spend on SaaS? 2026 Data and Benchmarks
- TechFuture Search — APAC: The Next Revenue Engine for SaaS in 2026
- Business Research Insights — Vertical SaaS Market Size | CAGR 16.3%
- Bessemer Venture Partners — The State of AI 2025
At Fungies.io, we help SaaS companies and digital product creators streamline their payment operations with a no-code checkout solution that handles global tax compliance automatically. Whether you’re building the next AI-native SaaS platform or scaling an established product, our Merchant of Record services let you focus on growth while we handle the complexity of payments, VAT, and sales tax.