SaaS Market Statistics 2026: Global Size, Growth Data & Industry Trends (Comprehensive Report)
The global Software-as-a-Service (SaaS) market is experiencing unprecedented expansion, fundamentally reshaping how businesses operate, collaborate, and scale. In 2026, the SaaS industry isn’t just growing—it’s transforming entire industries, with AI integration accelerating adoption rates and vertical solutions addressing niche market needs. According to Market Data Forecast, the global SaaS market reached $322.16 billion in 2025 and is projected to hit $389.81 billion in 2026—representing a staggering trajectory toward $1.79 trillion by 2034 at a compound annual growth rate (CAGR) of 21%.
What makes this growth remarkable isn’t just the numbers—it’s the structural shift in how organizations consume software. The average company now deploys over 130 SaaS applications, yet wastes an estimated $18 billion annually on unused subscriptions. This comprehensive report examines the data behind the SaaS revolution, from market sizing and regional dynamics to company performance metrics and emerging trends that will define the industry through 2030.
Key SaaS Market Statistics at a Glance
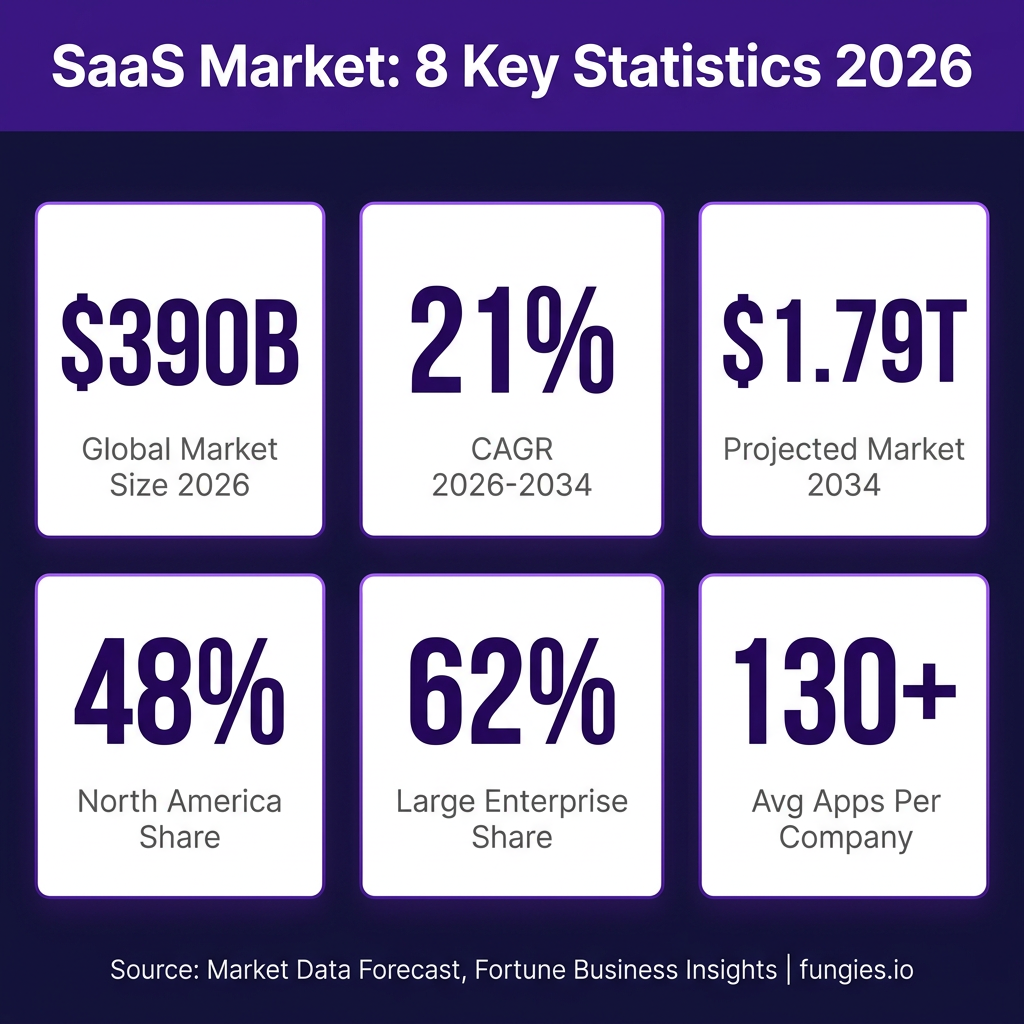
- Global SaaS market size (2026): $389.81 billion (Market Data Forecast)
- Projected market size (2034): $1.79 trillion at 21% CAGR
- U.S. SaaS market (2026): $141.06 billion (Fortune Business Insights)
- North America market share: 48% of global SaaS revenue
- Large enterprise segment: 62.3% of total market share
- Average SaaS apps per company: 130+ applications
- Annual wasted subscriptions: $18 billion globally
- Median B2B SaaS churn rate: 3-5% monthly (SMB), 1-2% (Enterprise)
- LTV:CAC ratio benchmark: 3.2:1 median, 3:1 minimum healthy threshold
- Median CAC payback period: 8.6 months
Global SaaS Market Size & Growth Projections
The SaaS market has demonstrated remarkable resilience and growth momentum. According to Grand View Research, the market was valued at $340.7 billion in 2024 and continues its upward trajectory. Gartner’s analysis positions the 2025 market at approximately $317 billion, with projections reaching $390 billion by 2027 at a 13.7% CAGR. The variation in figures reflects different methodological approaches—some focusing on pure SaaS revenue while others include broader cloud services.
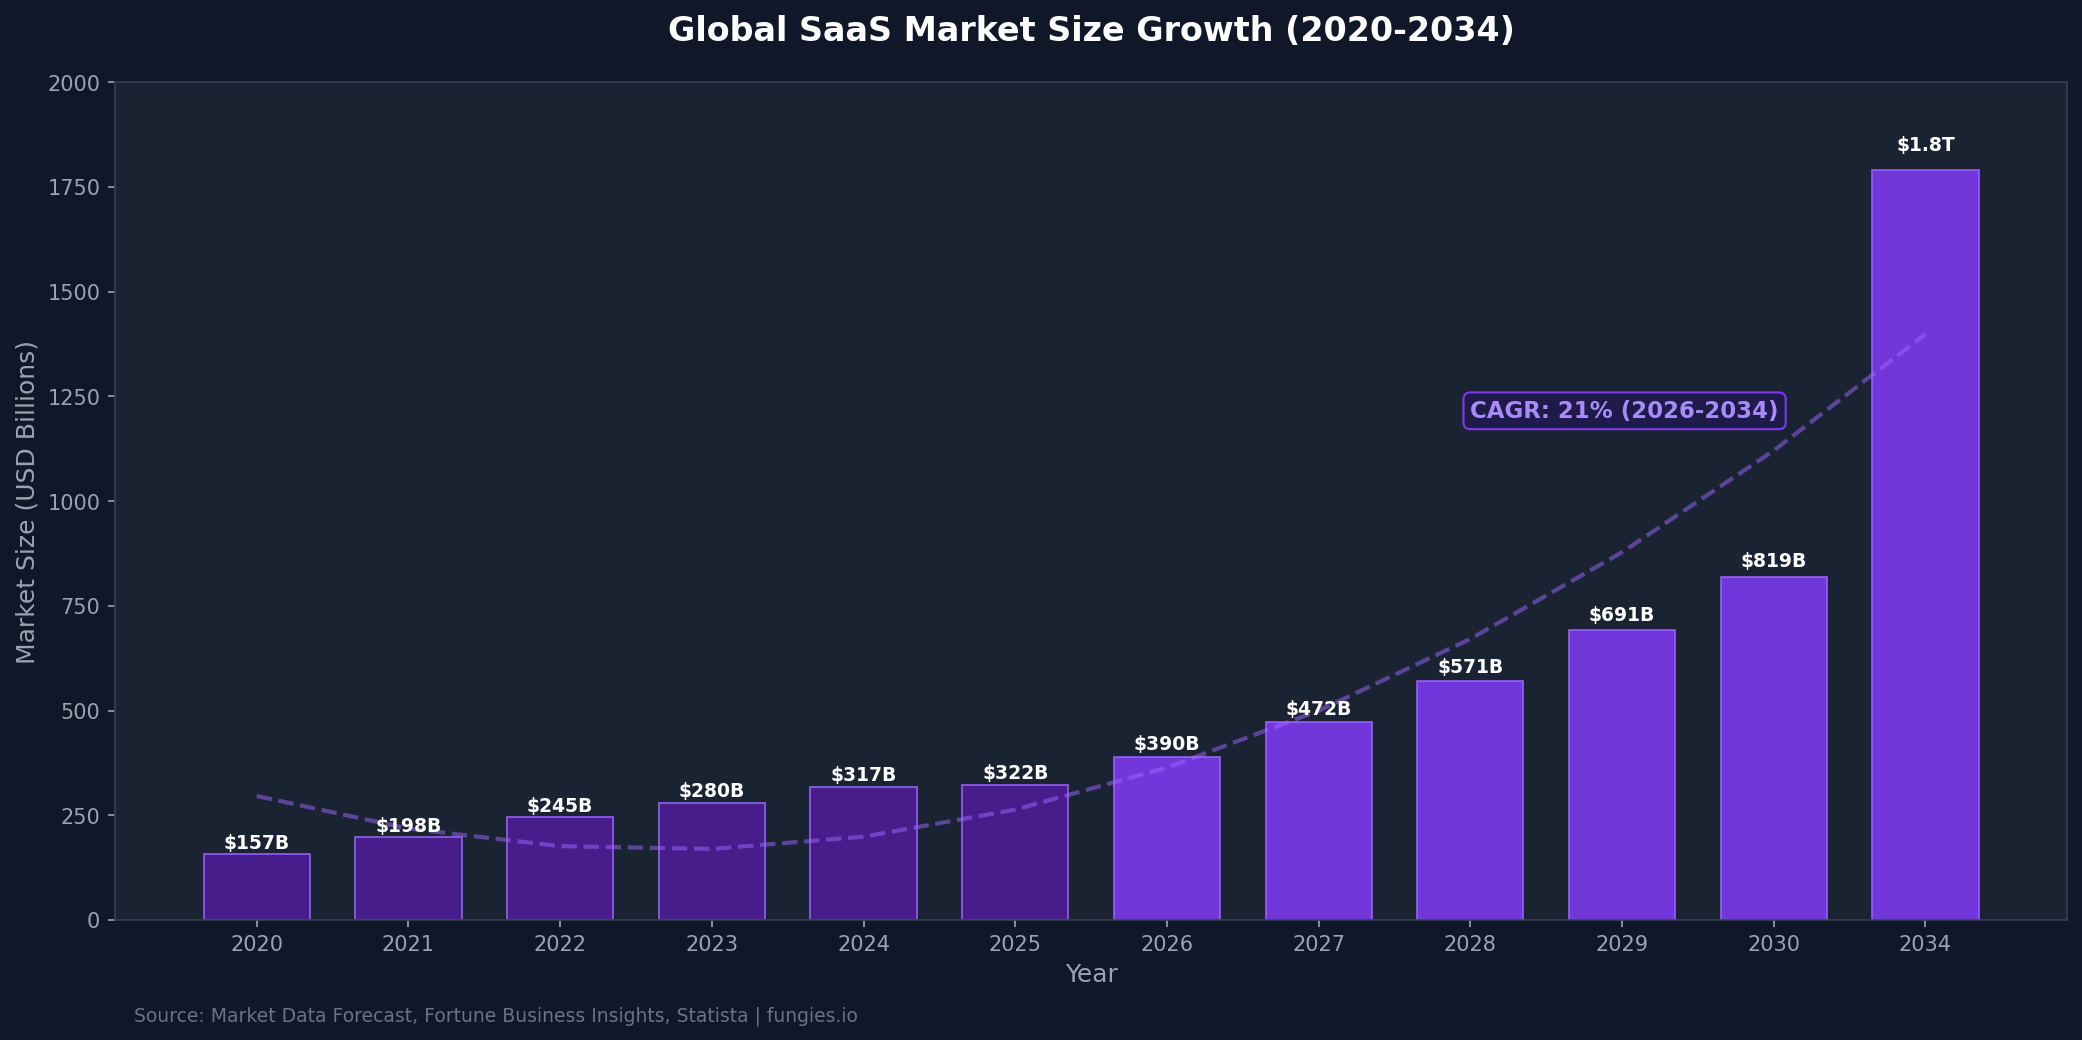
The most aggressive growth projections come from Market Data Forecast, which anticipates the market expanding from $322.16 billion in 2025 to $1.79 trillion by 2034. This 21% CAGR reflects the accelerating digital transformation across industries, the proliferation of AI-powered SaaS solutions, and the continued shift from on-premise software to cloud-based delivery models.
Historical context illuminates this trajectory: the SaaS market grew from approximately $157 billion in 2020 to $280 billion in 2023—a 78% increase in just three years. The COVID-19 pandemic acted as an accelerant, forcing organizations to rapidly adopt cloud-based collaboration tools, remote work solutions, and digital customer engagement platforms. What began as emergency measures have become permanent structural changes in how businesses operate.
| Year | Market Size | Growth Rate | Source |
|---|---|---|---|
| 2020 | $157 billion | — | Statista |
| 2021 | $198 billion | +26% | Statista |
| 2022 | $245 billion | +24% | Statista |
| 2023 | $280 billion | +14% | Statista |
| 2024 | $317-341 billion | +13-22% | Gartner/Grand View |
| 2025 | $322-370 billion | +2-17% | Market Data/Mordor |
| 2026 | $390-436 billion | +21% | Market Data Forecast |
| 2030 | $819 billion | CAGR 12% | Grand View Research |
| 2034 | $1.79 trillion | CAGR 21% | Market Data Forecast |
SaaS Market Growth Chart (2020-2034)
Regional SaaS Market Breakdown
Geographic distribution of SaaS revenue reveals significant regional disparities, with North America maintaining dominance while Asia-Pacific emerges as the fastest-growing region. According to Precedence Research, North America accounted for approximately 48% of global SaaS revenue in 2025, driven by the concentration of major SaaS vendors, advanced cloud infrastructure, and high enterprise digital maturity.
The United States represents the single largest national market, valued at $141.06 billion in 2026 according to Fortune Business Insights. This dominance stems from the headquarters location of industry leaders including Microsoft, Salesforce, Adobe, and ServiceNow, combined with robust venture capital ecosystems that fuel SaaS innovation and adoption.
Europe represents the second-largest regional market, with particular strength in the United Kingdom, Germany, and France. The region’s growth is accelerated by GDPR compliance requirements driving demand for data governance and privacy-focused SaaS solutions. Meanwhile, Asia-Pacific demonstrates the highest growth rates, with China, India, and Southeast Asian markets expanding rapidly as digital infrastructure matures and enterprise cloud adoption accelerates.
| Region | Market Share (2025) | CAGR (2026-2034) | Key Drivers |
|---|---|---|---|
| North America | 48% | 18% | Enterprise maturity, vendor concentration |
| Europe | 24% | 16% | GDPR compliance, digital transformation |
| Asia-Pacific | 20% | 25% | Rapid digitalization, SMB adoption |
| Latin America | 5% | 19% | Fintech growth, cloud migration |
| Middle East & Africa | 3% | 22% | Infrastructure investment, mobile-first |
Top SaaS Companies & Market Share Analysis
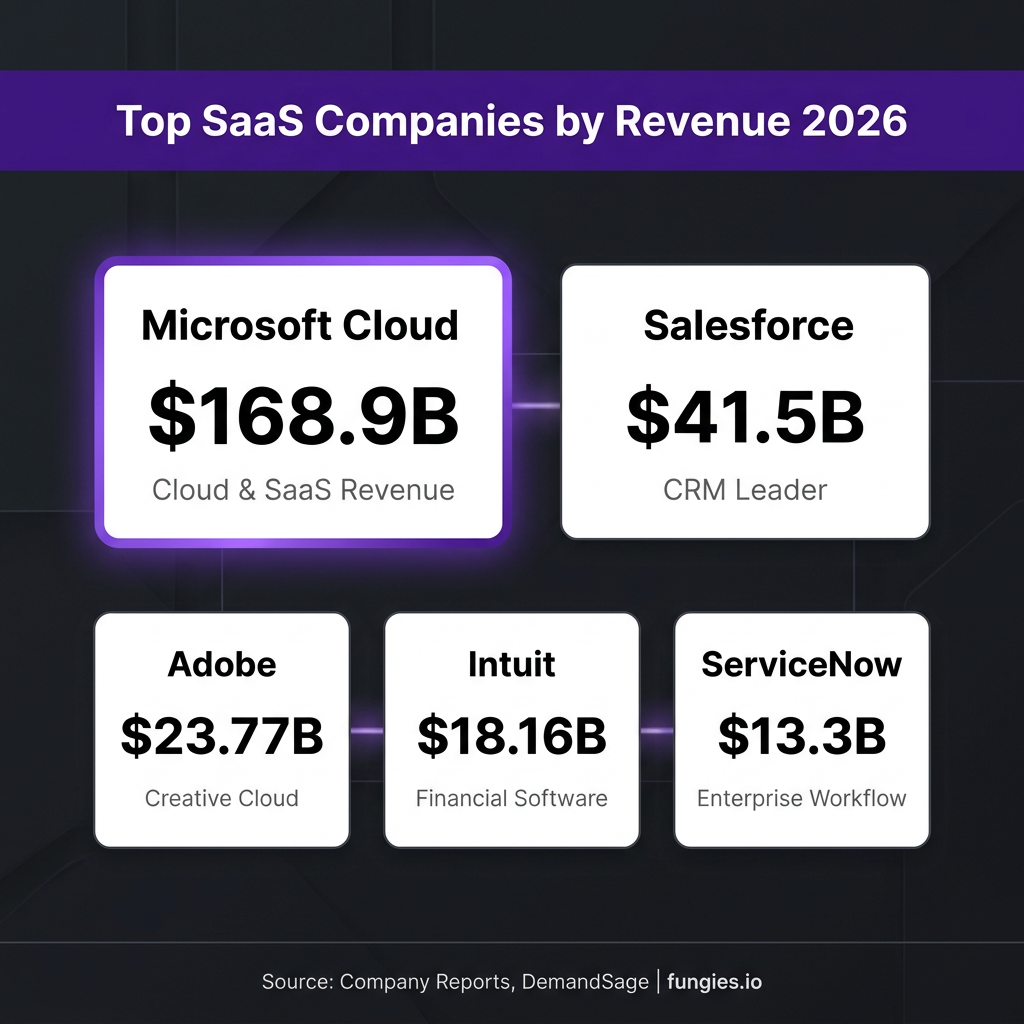
The SaaS competitive landscape is characterized by a mix of established enterprise software giants and emerging category specialists. Microsoft leads by total cloud revenue, reporting $168.9 billion in fiscal 2025 across Azure, Microsoft 365, and Dynamics—though this figure encompasses infrastructure (IaaS) and platform (PaaS) services alongside pure SaaS offerings.
Salesforce maintains its position as the largest pure-play SaaS company, with annual revenue reaching $37.9-41.5 billion depending on measurement methodology. The company’s dominance in customer relationship management (CRM) has expanded into adjacent categories including marketing automation, analytics, and AI-powered Einstein platforms.
Adobe’s transformation from packaged software to cloud subscriptions represents one of the most successful SaaS pivots in history, generating $23.77 billion in annual revenue through its Creative Cloud, Document Cloud, and Experience Cloud offerings. ServiceNow, the enterprise workflow platform, has achieved $13.3 billion in revenue by digitizing IT service management and expanding into HR, customer service, and security workflows.
| Company | Annual Revenue (2025/2026) | Primary Category | YoY Growth |
|---|---|---|---|
| Microsoft Cloud | $168.9 billion | Productivity/Cloud | +15% |
| Salesforce | $41.5 billion | CRM | +8% |
| Adobe | $23.77 billion | Creative/Document | +10% |
| Intuit | $18.16 billion | Financial Software | +12% |
| ServiceNow | $13.3 billion | Enterprise Workflow | +22% |
| Workday | $7.3 billion | HCM/Finance | +16% |
| Snowflake | $3.5 billion | Data Cloud | +24% |
| HubSpot | $2.5 billion | Marketing/Sales | +21% |
SaaS Industry Benchmarks & Performance Metrics
Understanding SaaS benchmarks is essential for evaluating company performance and market positioning. According to Optifai’s Pipeline Study analyzing 939 B2B SaaS companies (Q2 2025-Q1 2026), churn rates vary dramatically by customer segment. Small and medium businesses (SMB) experience monthly churn of 3-5%, translating to 31-46% annual churn. Mid-market companies ($10K-$100K ACV) see 1.5-3% monthly churn, while enterprise customers (>$100K ACV) achieve 1-2% monthly churn—with best-in-class performers reaching below 1%.
The LTV:CAC (Lifetime Value to Customer Acquisition Cost) ratio serves as the fundamental efficiency metric for SaaS businesses. The median B2B SaaS company achieves a 3.2:1 ratio, with 3:1 representing the minimum threshold for sustainable growth and 5:1+ indicating strong unit economics. According to SaaS Hero benchmarks, growth-stage companies between $2M-$10M ARR should target 3-4:1 ratios for efficient scaling.
Customer acquisition costs have surged dramatically—260% over nine years according to LTVCAC Book research. In 2026, the median SaaS company spends $2.00 to acquire $1 of new ARR, up 14% from the previous year. This escalation makes retention and expansion revenue increasingly critical. Net Revenue Retention (NRR) benchmarks from Benchmarkit show a median of 101%, with top-quartile companies achieving 120%+ through effective upsell and cross-sell strategies.
| Metric | Median | Top Quartile | Benchmark Source |
|---|---|---|---|
| Monthly Churn (SMB) | 3-5% | <2% | Optifai (N=939) |
| Monthly Churn (Enterprise) | 1-2% | <1% | Optifai (N=939) |
| LTV:CAC Ratio | 3.2:1 | 5:1+ | SaaS Hero |
| CAC Payback Period | 8.6 months | <6 months | SaaS Hero |
| Net Revenue Retention | 101% | 120%+ | Benchmarkit |
| Gross Revenue Retention | 88% | 95%+ | Benchmarkit |
| Revenue Growth Rate | 26% | 50%+ | Benchmarkit |
| Sales & Marketing % Revenue | 47% | 33% | Benchmarkit |
| R&D % Revenue | 34% | 23% | Benchmarkit |
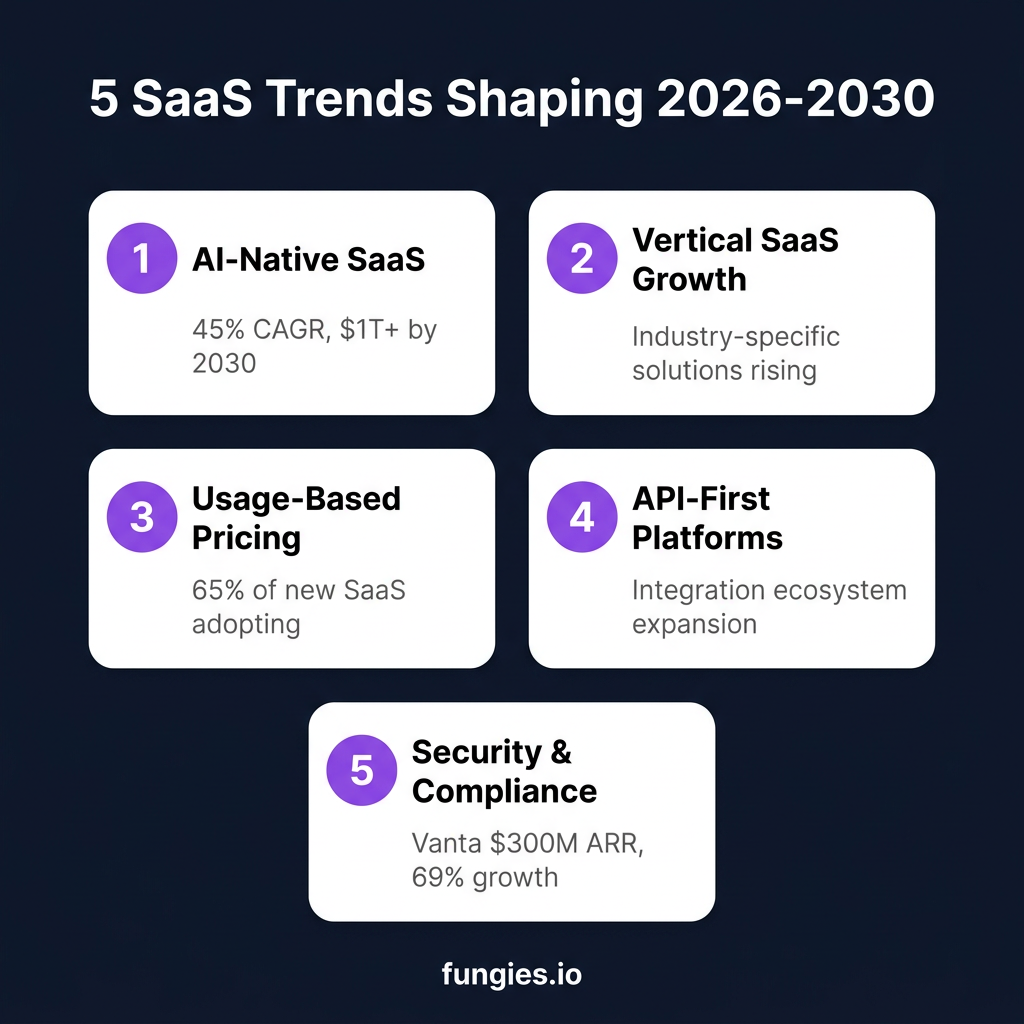
5 SaaS Trends Shaping 2026-2030
The SaaS landscape is undergoing fundamental transformation driven by technological innovation, changing buyer preferences, and evolving competitive dynamics. Here are the five trends defining the industry’s trajectory:
1. AI-Native SaaS Becomes the Default
Artificial intelligence is no longer a premium feature—it’s becoming table stakes. According to Fortune Business Insights, the AI SaaS market is projected to grow at a 45.3% CAGR, reaching over $1 trillion by 2030. AI governance tooling alone is exploding with 85% year-over-year growth. Companies like Vanta have achieved $300M ARR with 69% growth by automating compliance workflows. The shift from AI experimentation to production-ready platforms is the defining narrative of 2026.
2. Vertical SaaS Dominates Niche Markets
Horizontal SaaS platforms are facing increasing competition from vertical solutions purpose-built for specific industries. From Toast (restaurants) to Shopify (e-commerce) to Procore (construction), vertical SaaS companies are capturing market share by delivering industry-specific workflows, compliance features, and integrations that generic platforms cannot match. This trend is accelerating as AI enables more efficient customization for niche use cases.
3. Usage-Based Pricing Goes Mainstream
The traditional per-seat licensing model is under pressure from usage-based and consumption-based pricing. According to industry analysis, approximately 65% of new SaaS offerings now incorporate some form of usage-based component. This shift aligns vendor success with customer value realization, reducing friction for adoption while capturing upside from high-usage customers. Companies like Snowflake and AWS have proven the model at scale.
4. API-First Platforms Drive Ecosystem Growth
Modern SaaS platforms are built API-first, enabling seamless integration with hundreds of complementary tools. The average enterprise now connects 130+ SaaS applications, making interoperability a competitive necessity. Platforms like Stripe (payments), Twilio (communications), and SendGrid (email) have demonstrated that infrastructure SaaS can achieve massive scale by powering thousands of customer-facing applications.
5. Security and Compliance Automation
With cyberattacks increasing 32% year-over-year and regulatory requirements expanding (GDPR, CCPA, SOC 2), security and compliance automation represents a massive growth category. Companies like Vanta, Drata, and Secureframe have built billion-dollar businesses by automating the compliance process. According to Ideaplan research, cybersecurity SaaS is accelerating with high confidence for 2-3 year growth horizons.
SaaS M&A and Funding Activity
The SaaS M&A market reached record levels in 2025, with Software Equity Group reporting that SaaS transactions accounted for 58% of total software M&A activity. AI-referenced targets represented approximately 72% of all SaaS M&A transactions, reflecting how quickly artificial intelligence has become embedded across the SaaS landscape.
Notable transactions include IBM’s acquisition of Confluent for $11 billion, demonstrating the value of real-time data infrastructure. Analytics & Data Management and Content & Workflow Management were the two most active product categories, together accounting for nearly 38% of total SaaS deal volume.
On the public markets, SaaS valuations have experienced significant compression. Forward price-to-earnings multiples have fallen from 84.1x during the 2020-2022 peak to just 22.7x by March 2026—below the S&P 500 overall market multiple for the first time in history. This “SaaS apocalypse” reflects investor concerns about AI disruption and the sustainability of per-seat licensing models in an agentic AI future.
| Metric | 2024 | 2025 | Change |
|---|---|---|---|
| SaaS M&A Share of Software | 52% | 58% | +6pp |
| AI-Referenced Deal Share | 45% | 72% | +27pp |
| Forward P/E Multiple | 35x | 22.7x | -35% |
| Top Quartile Growth Rate | 60% | 50% | -10pp |
Methodology & Data Sources
This report synthesizes data from multiple authoritative sources to provide a comprehensive view of the SaaS market. Market sizing figures are derived from Grand View Research, Fortune Business Insights, Market Data Forecast, Mordor Intelligence, and Precedence Research. Company revenue data comes from official SEC filings (10-K, 10-Q reports) and investor presentations. Benchmark statistics are sourced from Optifai’s Pipeline Study (N=939 B2B SaaS companies), Benchmarkit’s 2025 SaaS Performance Metrics, and SaaS Capital’s private company growth rate analysis.
Regional breakdowns incorporate data from Statista’s country-level forecasts and regional market reports. Trend analysis draws from Gartner’s technology forecasts, McKinsey’s cloud adoption research, and industry-specific reports from Innovecs and Ideaplan. M&A and funding data comes from Software Equity Group’s 2026 Annual SaaS Report. All figures are cross-referenced for consistency, with discrepancies noted where sources provide different methodological approaches.
Frequently Asked Questions
What is the current size of the global SaaS market?
The global SaaS market is valued at approximately $389.81 billion in 2026, according to Market Data Forecast. Alternative estimates from Gartner place the 2025 market at $317 billion, with projections reaching $390 billion by 2027. The variation reflects different definitions of SaaS (pure software vs. broader cloud services) and methodological approaches.
What is the projected growth rate for the SaaS market?
The SaaS market is projected to grow at a CAGR of 13.7% to 21% through 2034, depending on the source. Market Data Forecast projects the most aggressive growth (21% CAGR), reaching $1.79 trillion by 2034. Grand View Research forecasts a 12% CAGR, reaching $819 billion by 2030. The AI SaaS subsegment is growing even faster at 45.3% CAGR.
Which region has the largest SaaS market share?
North America dominates with approximately 48% of global SaaS revenue, driven by the concentration of major vendors (Microsoft, Salesforce, Adobe), advanced cloud infrastructure, and high enterprise digital maturity. The United States alone represents $141.06 billion in SaaS spending. Asia-Pacific is the fastest-growing region at 25% CAGR.
What is a good churn rate for SaaS companies?
Churn benchmarks vary significantly by customer segment. According to Optifai’s study of 939 B2B SaaS companies, acceptable monthly churn rates are: SMB (3-5%), Mid-Market (1.5-3%), and Enterprise (1-2%). Best-in-class performers achieve below 1% monthly churn. Revenue churn is typically lower than logo churn due to expansion revenue from retained customers.
What LTV:CAC ratio should SaaS companies target?
SaaS companies should target a minimum 3:1 LTV:CAC ratio for sustainable growth, with 4:1 or higher indicating scale-ready unit economics. The median B2B SaaS company achieves 3.2:1. Growth-stage companies ($2M-$10M ARR) should aim for 3-4:1, while mature companies may achieve 5:1+ through efficient expansion revenue.
Sources & Citations
- Market Data Forecast – SaaS Market Report 2026-2034: https://www.marketdataforecast.com/market-reports/software-as-a-service-saas-market
- Grand View Research – SaaS Market Size Report: https://www.grandviewresearch.com/industry-analysis/saas-market-report
- Fortune Business Insights – SaaS Market Analysis: https://www.fortunebusinessinsights.com/software-as-a-service-saas-market-102222
- Statista – Software as a Service Market Data: https://www.statista.com/study/84974/software-as-a-service-report
- Mordor Intelligence – B2B SaaS Market: https://www.mordorintelligence.com/industry-reports/b2b-saas-market
- Precedence Research – SaaS Market Size: https://www.precedenceresearch.com/software-as-a-service-market
- Optifai – B2B SaaS Churn Rate Benchmarks (N=939): https://optif.ai/learn/questions/b2b-saas-churn-rate-benchmark
- SaaS Hero – LTV:CAC Benchmarks 2026: https://www.saashero.net/strategy/b2b-saas-ltv-cac-benchmarks
- Benchmarkit – 2025 SaaS Performance Metrics: https://www.benchmarkit.ai/2025benchmarks
- Software Equity Group – 2026 Annual SaaS Report: https://softwareequity.com/research/annual-saas-report
- Colorlib – 130+ SaaS Statistics 2026: https://colorlib.com/wp/saas-statistics
- Innovecs – Top SaaS Trends 2026: https://innovecs.com/blog/the-top-7-saas-trends
- Ideaplan – SaaS Market Trends 2026: https://www.ideaplan.io/ideas/trends
- Straits Research – SaaS Market Report: https://straitsresearch.com/report/saas-market
- McKinsey – Cloud Adoption Research: https://www.mckinsey.com/cloud-adoption
Last updated: June 21, 2026. Data compiled from industry reports, company filings, and market research publications. For questions or corrections, contact [email protected].