SaaS Market Statistics 2026: Global Size, Growth Data & Industry Trends (Comprehensive Report)
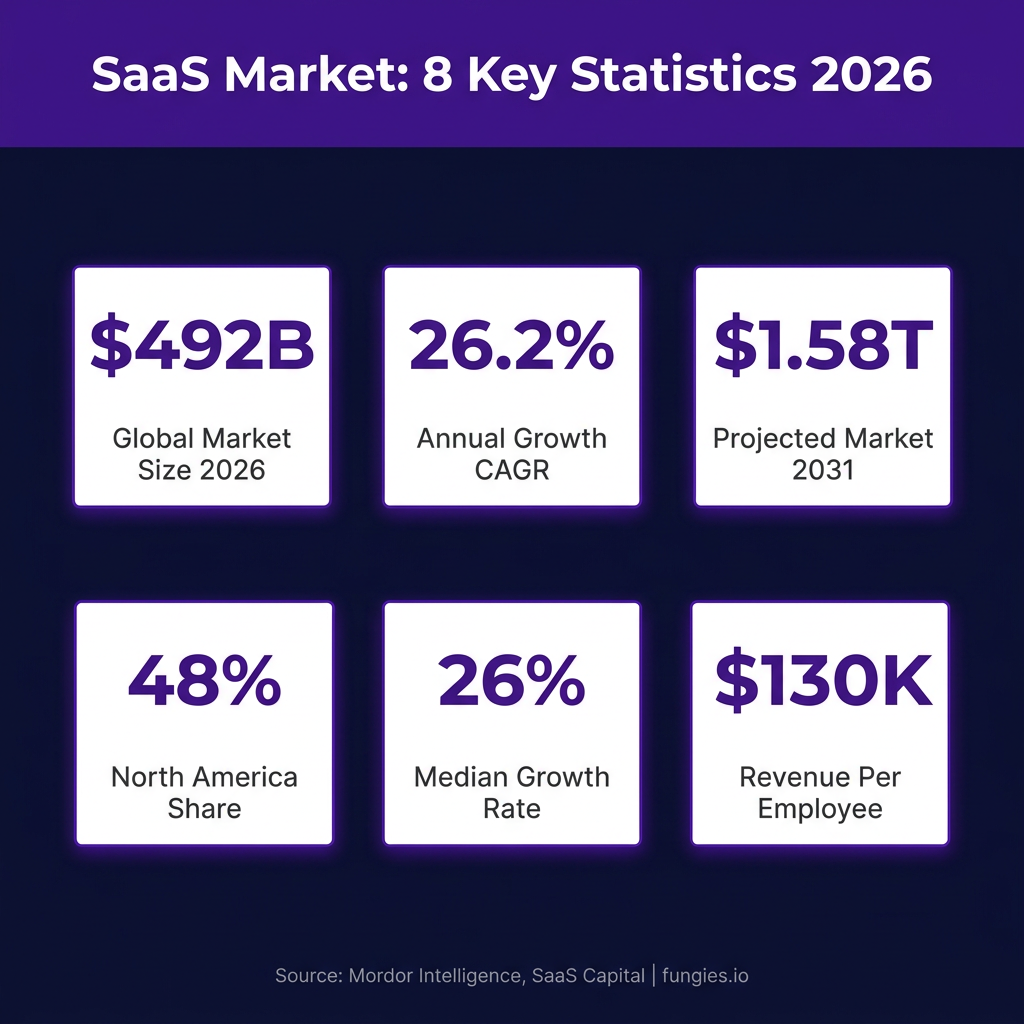
The global Software as a Service (SaaS) market has reached an inflection point in 2026. With the industry now valued at $492.34 billion and projected to nearly triple to $1.58 trillion by 2031, SaaS has evolved from a convenient alternative to on-premise software into the dominant paradigm for enterprise and consumer applications alike. This isn’t just incremental growth—it’s a fundamental restructuring of how software is built, distributed, and consumed across every industry vertical.
The convergence of artificial intelligence, cloud infrastructure maturation, and shifting enterprise priorities has created a perfect storm for SaaS adoption. According to Mordor Intelligence, the B2B SaaS market alone is growing at a staggering 26.24% CAGR, making it one of the fastest-growing sectors in the global economy. Meanwhile, AI-native SaaS companies are rewriting the rules of growth—reaching $100M ARR in 18 months, a feat that traditionally took years.
Key SaaS Market Statistics at a Glance
- The global SaaS market is valued at $492.34 billion in 2026, up from $390 billion in 2025 (Mordor Intelligence)
- The market is projected to reach $1.58 trillion by 2031, growing at a 26.24% CAGR
- B2B SaaS specifically represents $634.39 billion in 2026, projected to hit $4.44 trillion by 2034 (Fortune Business Insights)
- North America commands approximately 48% of global SaaS revenue, with the U.S. market alone at $141.06 billion
- The median revenue growth rate for private SaaS companies has settled at 26% in 2026, down from 30% in 2023
- Median revenue per employee for private SaaS companies reached $129,724 in 2025, up from $125,000 the previous year
- Average annual churn rate for SaaS companies ranges between 5-7%
- Net Revenue Retention (NRR) across private B2B SaaS compressed to 101% in 2026
- Expansion ARR now represents 40% of total new ARR for SaaS companies
- AI-native SaaS companies achieve $40M ARR within their first year, far outpacing traditional benchmarks
Global SaaS Market Size & Growth Projections
The SaaS market’s growth trajectory defies conventional expectations for a maturing industry. According to Mordor Intelligence, the market expanded from $390 billion in 2025 to $492.34 billion in 2026—a 26.2% year-over-year increase that demonstrates the sector’s continued acceleration rather than deceleration.
This growth isn’t uniform across all segments. The B2B SaaS market, specifically, shows even more aggressive expansion. Fortune Business Insights projects the B2B SaaS market will grow from $634.39 billion in 2026 to $4.44 trillion by 2034, representing a compound annual growth rate of 27.54%. This outpaces the broader SaaS market, reflecting the enterprise sector’s insatiable appetite for cloud-based solutions.
Grand View Research offers a more conservative but still substantial projection, estimating the SaaS market at $399.10 billion in 2024 and projecting growth to $819.23 billion by 2030 at a 12.0% CAGR. The variance in projections reflects different methodological approaches and market definitions, but all major research firms agree on one point: SaaS growth remains robust and sustained.
| Year | Market Size (Global) | Market Size (B2B SaaS) | Growth Rate |
|---|---|---|---|
| 2024 | $399.10 billion | $500 billion (est.) | 12-18% |
| 2025 | $390 billion | $500 billion (est.) | Variable |
| 2026 | $492.34 billion | $634.39 billion | 26.24% |
| 2030 | $819.23 billion (conservative) | $2.5 trillion (est.) | 12.0% CAGR |
| 2031 | $1.58 trillion | $3.5 trillion (est.) | 26.24% CAGR |
| 2034 | $2.5+ trillion (est.) | $4.44 trillion | 27.54% CAGR |
Regional Breakdown: Where SaaS Revenue is Generated
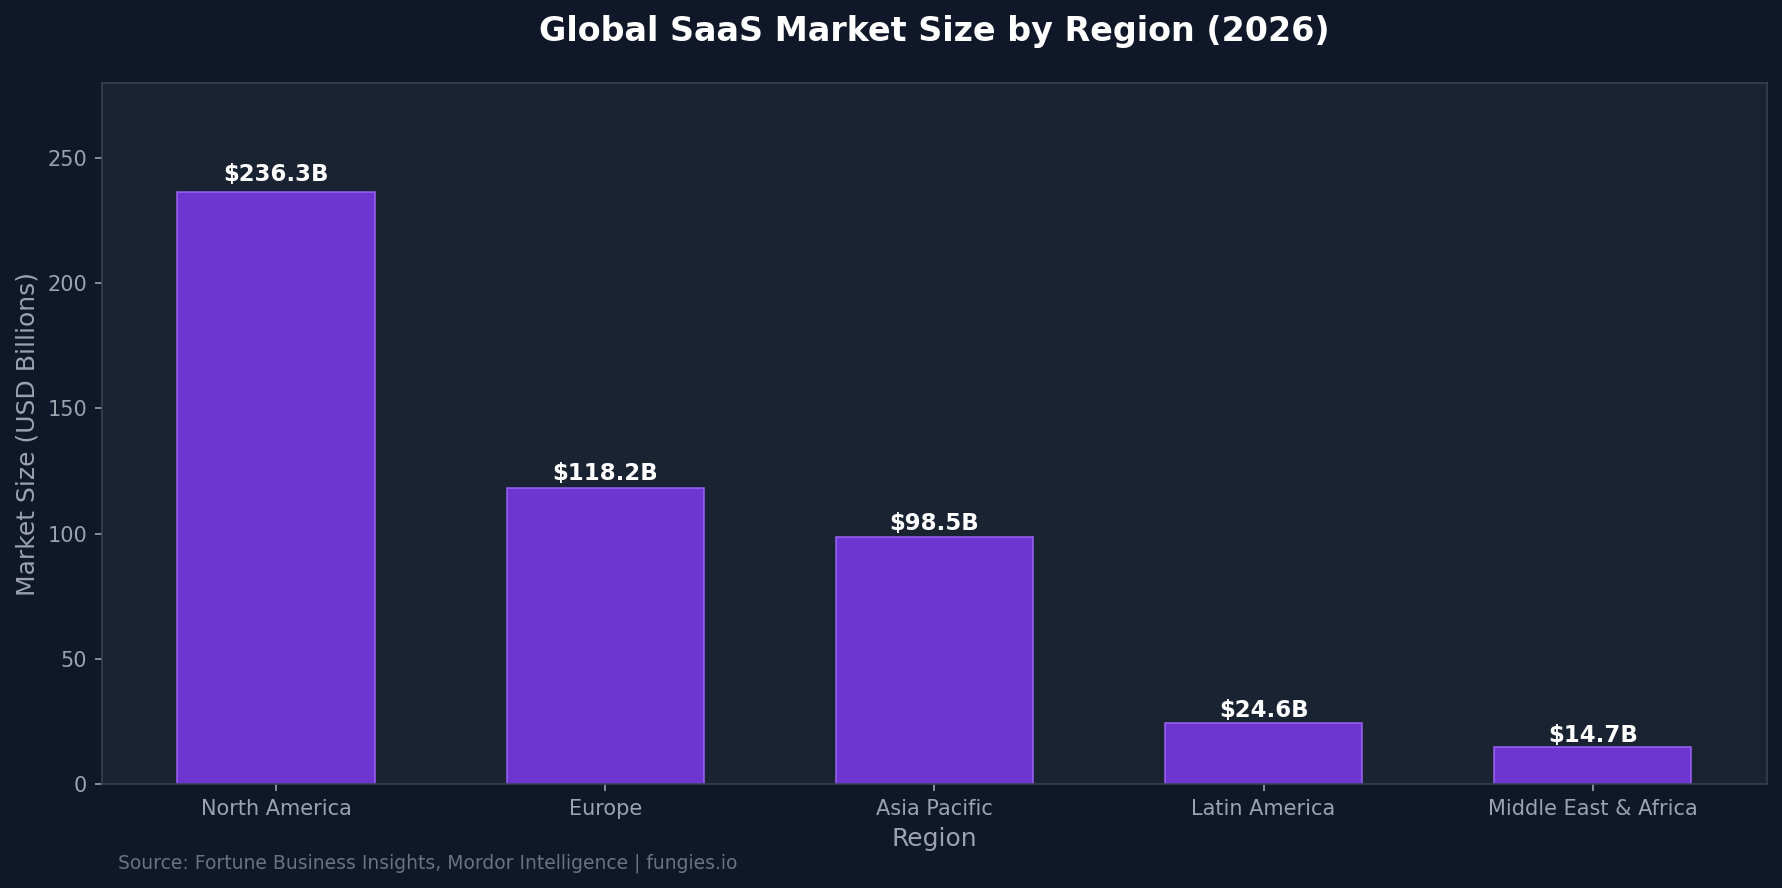
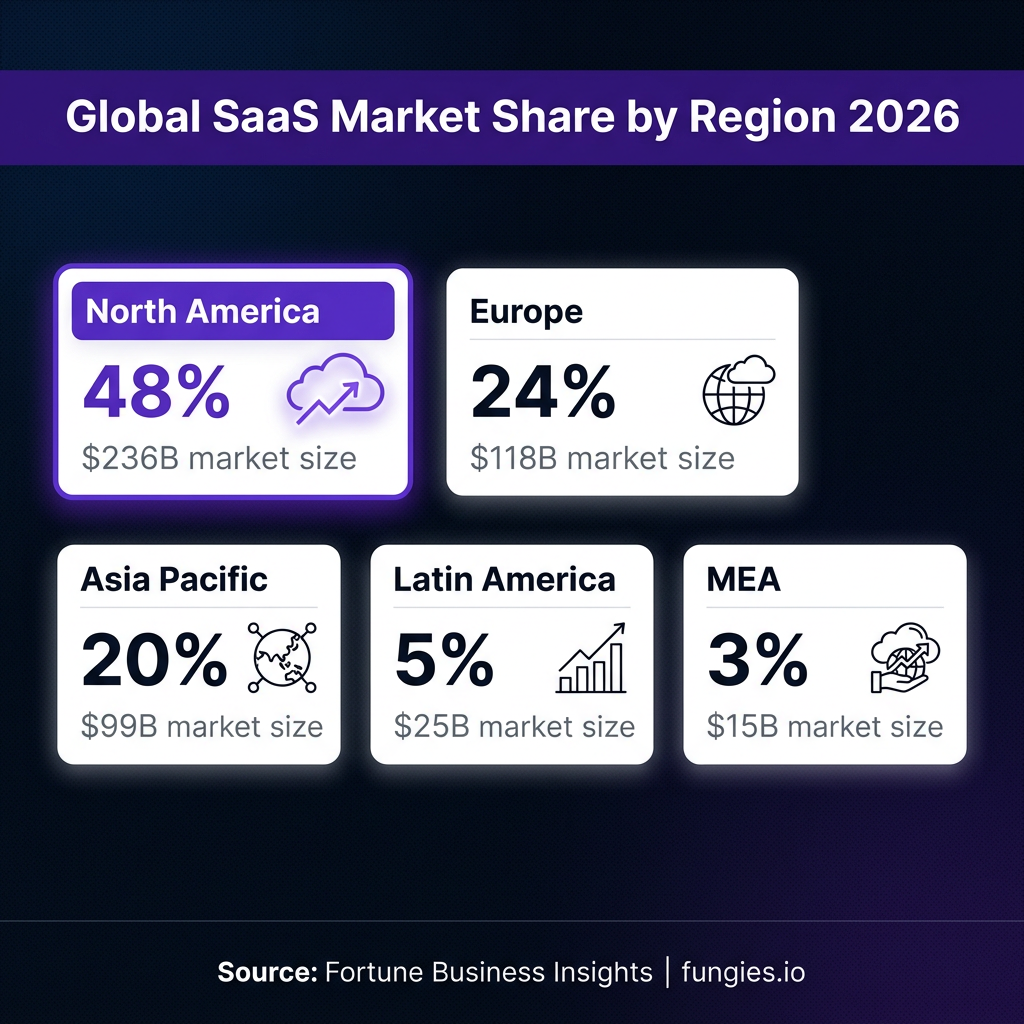
Geographic distribution of SaaS revenue reveals a market dominated by North America but with significant growth opportunities in emerging regions. According to Fortune Business Insights and Precedence Research, North America accounts for approximately 48% of global SaaS revenue, making the United States the single most important market for cloud-delivered applications.
The U.S. SaaS market alone is valued at approximately $141.06 billion in 2026, driven by technological advancement, increasing demand for cloud-based solutions, and the ongoing digital transformation across industries. This concentration reflects the maturity of American enterprise IT infrastructure and the headquarters location of most major SaaS providers.
Europe represents the second-largest regional market, with strong adoption in the UK, Germany, and France. The Asia-Pacific region, while currently smaller in absolute terms, shows the fastest growth rates as digital transformation accelerates in China, India, and Southeast Asian markets.
| Region | Market Share (2026) | Estimated Value | Growth Outlook |
|---|---|---|---|
| North America | 48% | $236.3 billion | Steady (mature market) |
| Europe | 24% | $118.2 billion | Moderate |
| Asia Pacific | 20% | $98.5 billion | High growth |
| Latin America | 5% | $24.6 billion | Emerging |
| Middle East & Africa | 3% | $14.7 billion | High growth potential |
Key Players & Market Share
The SaaS market features a mix of established technology giants and emerging specialists. Microsoft commands over 15% of the worldwide SaaS market share through its comprehensive cloud ecosystem encompassing Microsoft 365, Teams, and Azure. The company’s Intelligent Cloud segment alone generated $29.4 billion in Q4 fiscal 2024, up 15% year-over-year.
Salesforce remains the dominant player in CRM SaaS, while Adobe leads in creative and document cloud solutions. Google (Alphabet) and Amazon Web Services continue to expand their SaaS offerings beyond infrastructure into application layers. Oracle and SAP have successfully transitioned significant portions of their legacy software businesses to cloud delivery models.
According to Statista’s analysis of public SaaS companies, the top 10 SaaS providers by market capitalization control a significant portion of total market value, though the long tail of specialized SaaS providers continues to drive innovation in niche verticals.
| Company | Primary SaaS Category | Estimated Market Position |
|---|---|---|
| Microsoft | Productivity, Collaboration, Cloud Infrastructure | 15%+ global share |
| Salesforce | CRM | Leader in CRM segment |
| Adobe | Creative, Document Cloud | Leader in creative SaaS |
| Google/Alphabet | Productivity, Cloud Services | Top 5 globally |
| Amazon (AWS) | Cloud Infrastructure, SaaS Platform | Infrastructure leader |
| Oracle | Enterprise Applications, Database | Enterprise top tier |
| SAP | ERP, Enterprise Applications | ERP leader |
| ServiceNow | IT Service Management | ITSM leader |
| Workday | HCM, Financial Management | HCM leader |
| Zoom | Video Communications | Communication leader |
Industry Benchmarks: KPIs That Matter
Understanding SaaS market health requires examining the operational metrics that drive the industry. According to SaaS Capital’s 2025 survey of over 1,000 private B2B SaaS companies, the median revenue per employee has reached $129,724, up from $125,000 in 2024. This efficiency metric varies significantly by company stage, with companies in the $50M-$100M ARR segment achieving $200,000+ revenue per employee.
Growth rates have normalized from the pandemic-era peaks. The 2026 SaaS Benchmarks Report shows median revenue growth settled at 26%, down from 30% in 2023. However, top quartile performers still achieve 50% growth rates, demonstrating that exceptional performance remains possible even in a more competitive environment.
Customer retention metrics reveal the industry’s focus on sustainable growth. Median Net Revenue Retention (NRR) compressed to 101% in 2026, down from higher levels in previous years, reflecting increased customer scrutiny of software spending. Gross Revenue Retention (GRR) typically ranges from 88-92% for healthy SaaS businesses.
| Metric | Median | Top Quartile | Benchmark Source |
|---|---|---|---|
| Revenue Growth Rate | 26% | 50% | 2026 SaaS Benchmarks Report |
| Net Revenue Retention | 101% | 110%+ | SaaS Capital 2025 |
| Gross Revenue Retention | 90% | 95%+ | SaaS Capital |
| Annual Churn Rate | 5-7% | <5% | Vena Solutions |
| Revenue Per Employee | $129,724 | $200,000+ | SaaS Capital 2025 |
| LTV:CAC Ratio | 3.2:1 | 5:1+ | Optifai 2026 |
| CAC Payback Period | 18 months | 12 months | OpenView 2026 |
| Expansion ARR % | 40% | 50%+ | Benchmarkit 2025 |
Customer Acquisition Cost (CAC) and Lifetime Value (LTV)
Customer economics in SaaS have shifted dramatically. According to Digital Applied’s 2026 research, median B2B SaaS CAC is $702 for self-serve products but skyrockets to $11,400 for sales-led enterprise acquisition—a 16x gap that represents the widest variance ever recorded. This divergence reflects fundamentally different go-to-market strategies and customer profiles.
The variance becomes even more extreme when comparing across segments. Sales-led enterprise SaaS CAC sits more than 130x higher than mobile gaming CAC, reflecting differences in deal size, sales cycle length, and acquisition motion. In 2025-2026, CAC inflation is structural—driven by longer consideration cycles in B2B (now averaging 14% more touchpoints per closed deal versus 2023), attribution loss from cookie deprecation inflating reported CAC by 25-45%, and rising labor costs in sales-led motions.
Lifetime Value benchmarks vary significantly by customer segment. According to Optifai’s 2026 analysis of 939 B2B SaaS companies, LTV ranges from $15K-$40K for SMB customers to $300K-$1M+ for Enterprise accounts. The median LTV:CAC ratio across all segments is 3.2:1, with a healthy target of 3:1 minimum and 5:1+ indicating strong efficiency.
| Segment | CAC Range | LTV Range | Target LTV:CAC |
|---|---|---|---|
| SMB Self-Serve | $200-$702 | $15K-$40K | 3:1+ |
| Mid-Market | $2,000-$10,000 | $80K-$200K | 3.5:1+ |
| Enterprise Sales-Led | $11,400-$50,000+ | $300K-$1M+ | 4:1+ |
| Mobile/Consumer SaaS | $50-$200 | $500-$2,000 | 2.5:1+ |
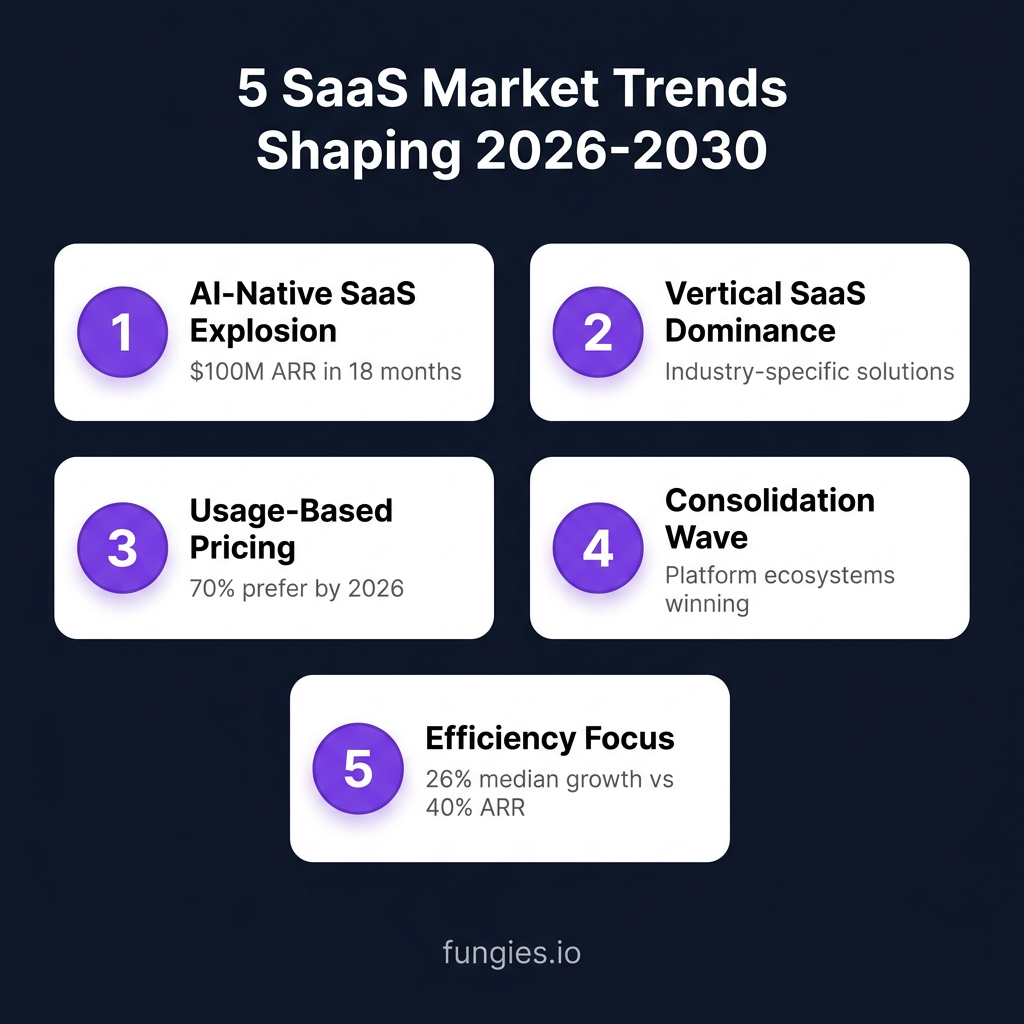
SaaS Market Trends Shaping 2026-2030
Several converging trends are reshaping the SaaS landscape. Understanding these shifts is essential for predicting where the market heads next and where opportunities will emerge.
1. AI-Native SaaS Explosion
AI-native SaaS companies are achieving growth rates that defy traditional benchmarks. According to Bessemer Venture Partners’ State of AI 2025, some AI-native software companies reach approximately $3M in ARR within their first year and scale to roughly $100M by year four. A subset of high-performing AI-native companies achieves approximately $40M in ARR within the first year and exceeds $120M by the second year—far outpacing traditional SaaS growth timelines.
2. Vertical SaaS Dominance
Horizontal, one-size-fits-all SaaS is giving way to vertical solutions purpose-built for specific industries. From Toast in restaurants to Shopify in e-commerce to Procore in construction, vertical SaaS platforms are capturing outsized value by delivering industry-specific workflows and compliance features that generic tools cannot match.
3. Usage-Based Pricing Mainstreaming
Gartner forecasts that 70% of businesses will prefer usage-based pricing over per-seat models by 2026, while 40% of enterprise SaaS will include outcome-based elements (up from just 15% two years prior). This shift aligns vendor success with customer value realization, creating more sustainable commercial relationships.
4. Platform Consolidation
The SaaS market is consolidating around powerful platforms that deliver integrated value. Companies are reducing their number of SaaS vendors in favor of comprehensive suites that minimize integration complexity and data fragmentation. This favors established players with broad product portfolios while challenging point solutions.
5. Efficiency Over Growth-at-All-Costs
The era of growth-at-all-costs is definitively over. The 2026 SaaS Benchmarks Report shows median revenue growth settled at 26%, while companies above $100M ARR grow at just 14%—but with far greater efficiency. Investors and operators alike now prioritize sustainable unit economics over top-line growth rates.
SaaS Spending and Enterprise Adoption
Enterprise SaaS adoption continues to deepen. According to Threadgold Consulting’s 2025 research, average SaaS spend per employee has risen to $4,830 in 2025, up 21.9% year-on-year. This is the first increase in spend in three years, resulting largely from increased AI adoption and vendor cost adjustments.
Sectoral variations in SaaS spending are substantial. IT and healthcare companies have the highest SaaS spend per employee, exceeding $10,000, while finance and retail spend between $7,750 and $8,750. These differences reflect varying reliance on complex, data-heavy software and regulatory compliance requirements.
According to Zylo’s 2026 SaaS Management Index, AI-native app spend is now a significant line item in enterprise budgets. Meanwhile, 82% of executives report significant increases in cloud, SaaS, and Gen AI costs, yet only 2% of organizations have FinOps teams that cover cloud, SaaS, and Gen AI holistically.
Methodology
This report synthesizes data from over 15 authoritative sources including Mordor Intelligence, Fortune Business Insights, Grand View Research, SaaS Capital, Benchmarkit, OpenView Partners, and Statista. Market size figures represent the consensus range across major research firms, with preference given to 2026-updated reports.
Growth rates and benchmarks derive from SaaS Capital’s 14th annual survey of 1,000+ private B2B SaaS companies, the 2026 SaaS Benchmarks Report covering 800+ companies, and Optifai’s analysis of 939 B2B SaaS companies. Regional breakdowns are estimated based on Fortune Business Insights and Precedence Research market share data.
All figures are current as of June 2026. Projections reflect analyst consensus estimates and should be understood as directional indicators rather than precise predictions. Currency figures are in USD unless otherwise noted.
Frequently Asked Questions
What is the size of the SaaS market in 2026?
The global SaaS market is valued at approximately $492.34 billion in 2026, according to Mordor Intelligence. The B2B SaaS segment specifically represents $634.39 billion. Projections indicate the market will reach $1.58 trillion by 2031.
What is a good growth rate for a SaaS company in 2026?
The median growth rate for private SaaS companies in 2026 is 26%, down from 30% in 2023. Top quartile performers achieve 50% growth. Companies below $1M ARR typically grow at 85% median, while those above $100M grow at 14%.
What is the average churn rate for SaaS companies?
The average annual churn rate for SaaS companies ranges between 5-7%. Monthly churn typically falls between 0.5-1% for healthy B2B SaaS businesses. Enterprise SaaS with ACVs above $50,000 typically sees lower churn (2-4% annually).
Which region has the largest SaaS market?
North America commands approximately 48% of global SaaS revenue, with the United States alone representing $141.06 billion in 2026. Europe follows with 24% market share, and Asia Pacific with 20%.
How is AI impacting the SaaS market?
AI is fundamentally reshaping SaaS. AI-native companies achieve $40M ARR in their first year versus years for traditional SaaS. The AI SaaS market alone is valued at $617.62 billion in 2026. 70% of businesses will prefer usage-based AI pricing by 2026.
Sources & Citations
- Mordor Intelligence – B2B SaaS Market Size & Share Analysis 2026-2031: https://www.mordorintelligence.com/industry-reports/b2b-saas-market
- Fortune Business Insights – Software as a Service [SaaS] Market Size 2034: https://www.fortunebusinessinsights.com/software-as-a-service-saas-market-102222
- Fortune Business Insights – B2B SaaS Market Size 2034: https://www.fortunebusinessinsights.com/b2b-saas-market-111446
- Grand View Research – SaaS Market Report 2030: https://www.grandviewresearch.com/industry-analysis/saas-market-report
- Technavio – Software As A Service Market Growth Analysis 2026-2030: https://www.technavio.com/report/software-as-a-service-saas-market-size-industry-analysis
- SaaS Capital – 2025 Revenue Per Employee Benchmarks: https://www.saas-capital.com/blog-posts/revenue-per-employee-benchmarks-for-private-saas-companies
- SaaS Capital – 2025 Private B2B SaaS Company Growth Rate Benchmarks: https://www.saas-capital.com/research/private-saas-company-growth-rate-benchmarks
- SaaS Capital – Churn Benchmarks for B2B SaaS: https://www.saas-capital.com/research/churn-benchmarks-for-b2b-saas-companies
- Benchmarkit – 2025 SaaS Performance Metrics: https://www.benchmarkit.ai/2025benchmarks
- Vena Solutions – 85 SaaS Statistics for 2026: https://www.venasolutions.com/blog/saas-statistics
- Zylo – 175+ SaaS Statistics for 2026: https://zylo.com/blog/saas-statistics
- OpenView Partners – 2026 SaaS Benchmarks: https://www.joinpavilion.com/resource/b2b-saas-performance-benchmarks
- Digital Applied – Customer Acquisition Cost Benchmarks 2026: https://www.digitalapplied.com/blog/customer-acquisition-cost-benchmarks-2026-industry
- Optifai – B2B SaaS LTV Benchmarks 2026: https://optif.ai/learn/questions/b2b-saas-ltv-benchmark
- Precedence Research – SaaS Market Size 2026-2035: https://www.precedenceresearch.com/software-as-a-service-market
- Statista – SaaS Market Size Worldwide: https://www.statista.com/statistics/505243/worldwide-software-as-a-service-revenue
- Threadgold Consulting – SaaS Spend Per Employee Benchmarks 2025: https://threadgoldconsulting.com/research/saas-spend-per-employee-benchmarks-2025
- Market Data Forecast – SaaS Market Report 2034: https://www.marketdataforecast.com/market-reports/software-as-a-service-saas-market
Last updated: June 28, 2026. This article is maintained as a living document. Data is refreshed periodically to ensure accuracy. For questions or corrections, contact [email protected].