SaaS Market Statistics 2026: Global Size, Growth Data & Industry Trends (Comprehensive Report)
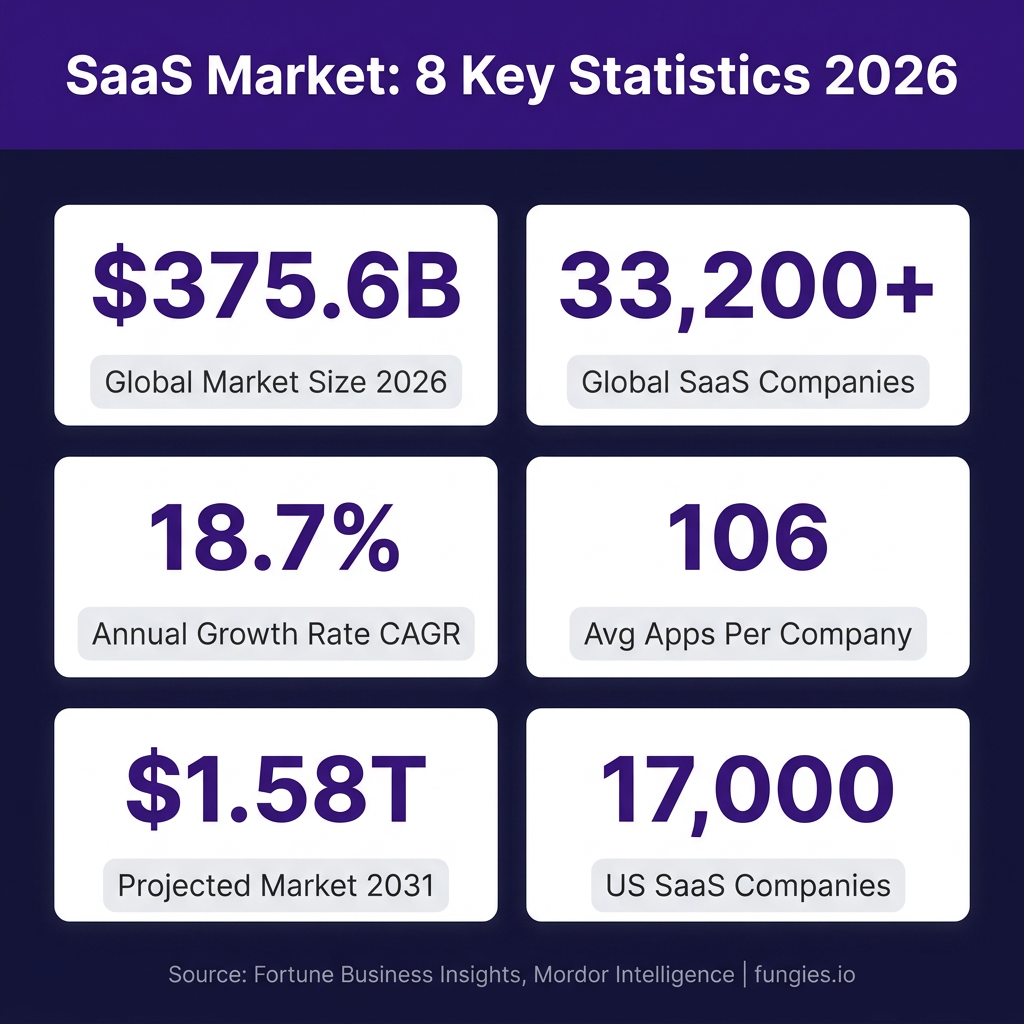
The global Software as a Service (SaaS) market has reached an inflection point in 2026. With the market valued at approximately $375.57 billion and projected to surge toward $1.48 trillion by 2034, SaaS has cemented itself as the dominant software delivery model for businesses worldwide. This represents a compound annual growth rate (CAGR) of 18.7%—a trajectory that signals not just growth, but a fundamental restructuring of how organizations acquire, deploy, and consume software.
What makes 2026 particularly significant is the convergence of multiple transformative forces: artificial intelligence integration has moved from experimental feature to core infrastructure, vertical SaaS solutions are capturing market share from generalist platforms at unprecedented rates, and the total number of SaaS companies globally has crossed 33,200 with the United States alone hosting over 17,000 SaaS companies.
This comprehensive report examines the SaaS market through multiple lenses: market size and growth projections, key performance indicators and benchmarks, emerging trends reshaping the industry, competitive dynamics among major players, and evidence-based predictions for the remainder of this decade.
Key Statistics at a Glance
- $375.57 billion — Global SaaS market size in 2026 (Fortune Business Insights)
- 18.7% CAGR — Projected annual growth rate through 2034
- 33,200+ — Total SaaS companies worldwide (up 32% from 2021)
- 17,000 — SaaS companies based in the United States
- $141.06 billion — Expected US SaaS revenue in 2026
- 106 — Average number of SaaS apps per company (2024)
- 3.5% — Average monthly churn rate for B2B SaaS
- 3.2:1 — Median LTV:CAC ratio across B2B SaaS segments
- 108% — Year-over-year increase in AI-native SaaS spending
- 80%+ — Companies using some form of usage-based pricing
Market Size & Growth Projections
The SaaS market’s growth trajectory defies simple categorization. According to Fortune Business Insights, the global market reached $315.68 billion in 2025 and is projected to grow to $375.57 billion in 2026. However, analyst consensus varies significantly depending on methodology and scope. Precedence Research estimates the 2026 market at $465.03 billion, while Mordor Intelligence places the B2B SaaS segment alone at $492.34 billion for 2026.
These variations reflect the challenge of defining market boundaries in an increasingly interconnected software ecosystem. What’s consistent across all major research firms is the direction: sustained double-digit growth for the foreseeable future. By 2031, Mordor Intelligence projects the overall SaaS market will reach $976.61 billion, while Fortune Business Insights forecasts $1.48 trillion by 2034.
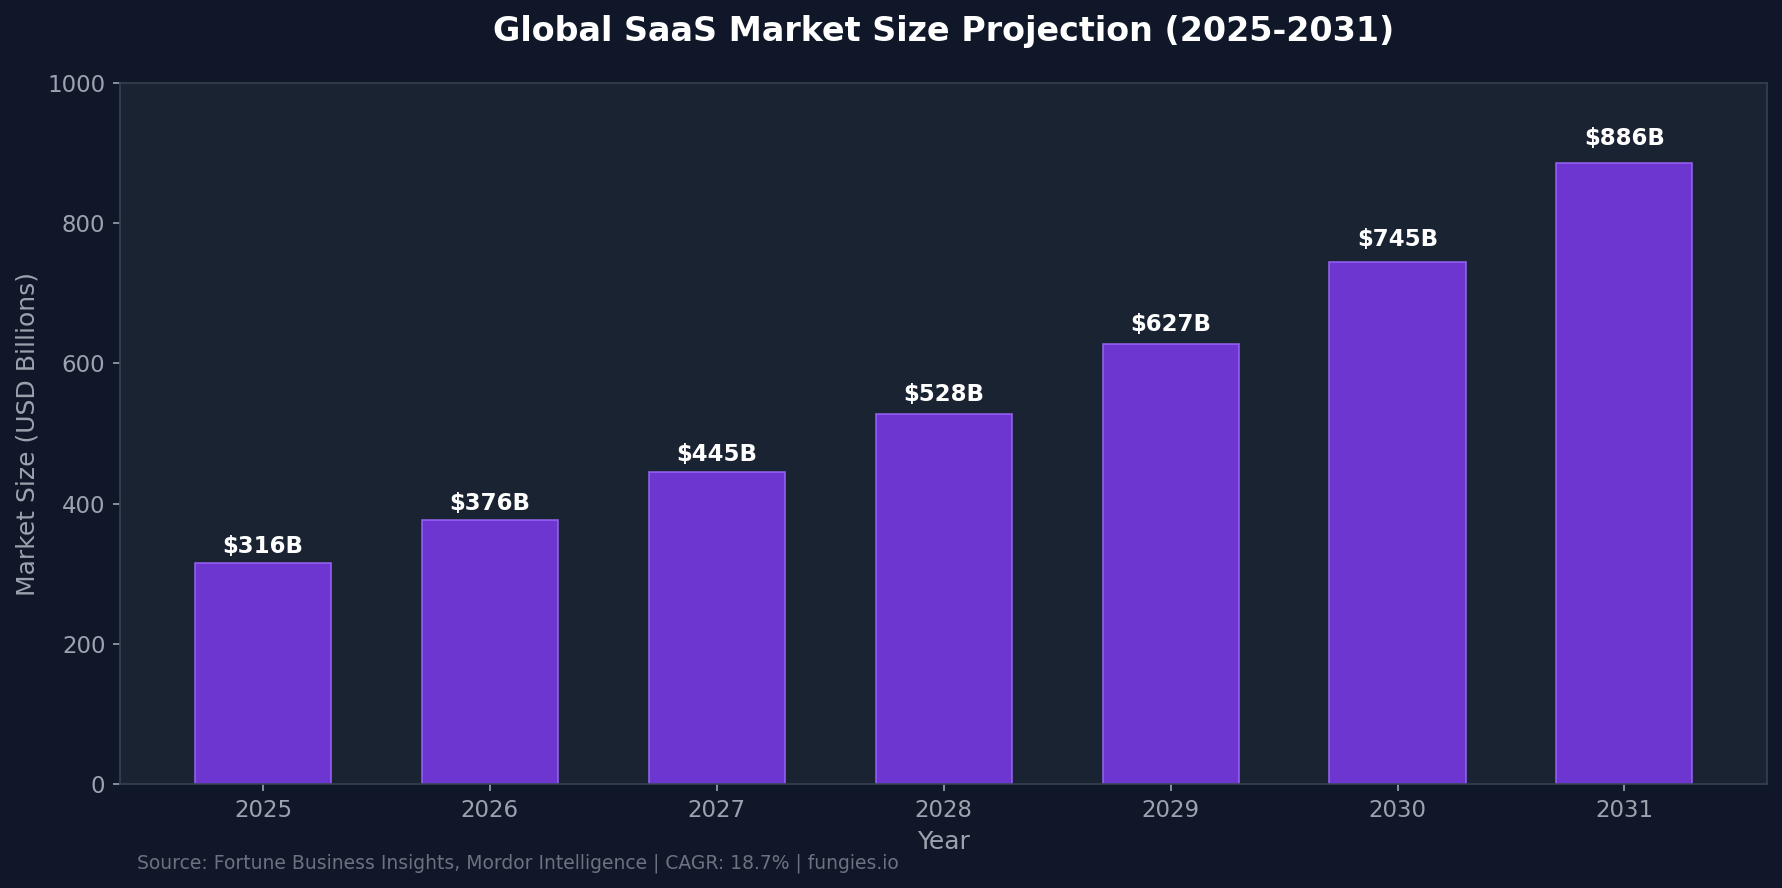
| Year | Market Size (Low Estimate) | Market Size (High Estimate) | YoY Growth |
|---|---|---|---|
| 2025 | $315.68B | $408.21B | — |
| 2026 | $375.57B | $465.03B | +18.7% |
| 2027 | $445.00B | $540.00B | +18.5% |
| 2028 | $528.00B | $630.00B | +18.7% |
| 2029 | $627.00B | $735.00B | +18.8% |
| 2030 | $745.00B | $858.00B | +18.8% |
| 2031 | $886.00B | $1,001.00B | +18.9% |
B2B SaaS Segment Analysis
The B2B SaaS segment deserves special attention given its outsized impact on overall market dynamics. According to Mordor Intelligence, the B2B SaaS market was valued at $390 billion in 2025 and is expected to reach $492.34 billion in 2026. The segment is projected to grow at a remarkable 26.24% CAGR through 2031, when it will reach $1.58 trillion.
This accelerated growth relative to the broader SaaS market reflects several factors: enterprise digital transformation initiatives continuing unabated, the proliferation of specialized vertical solutions, and the increasing willingness of businesses to outsource non-core software functions. For companies like Fungies.io serving B2B SaaS clients with payment infrastructure, this expansion represents a substantial addressable market.
Regional Market Breakdown
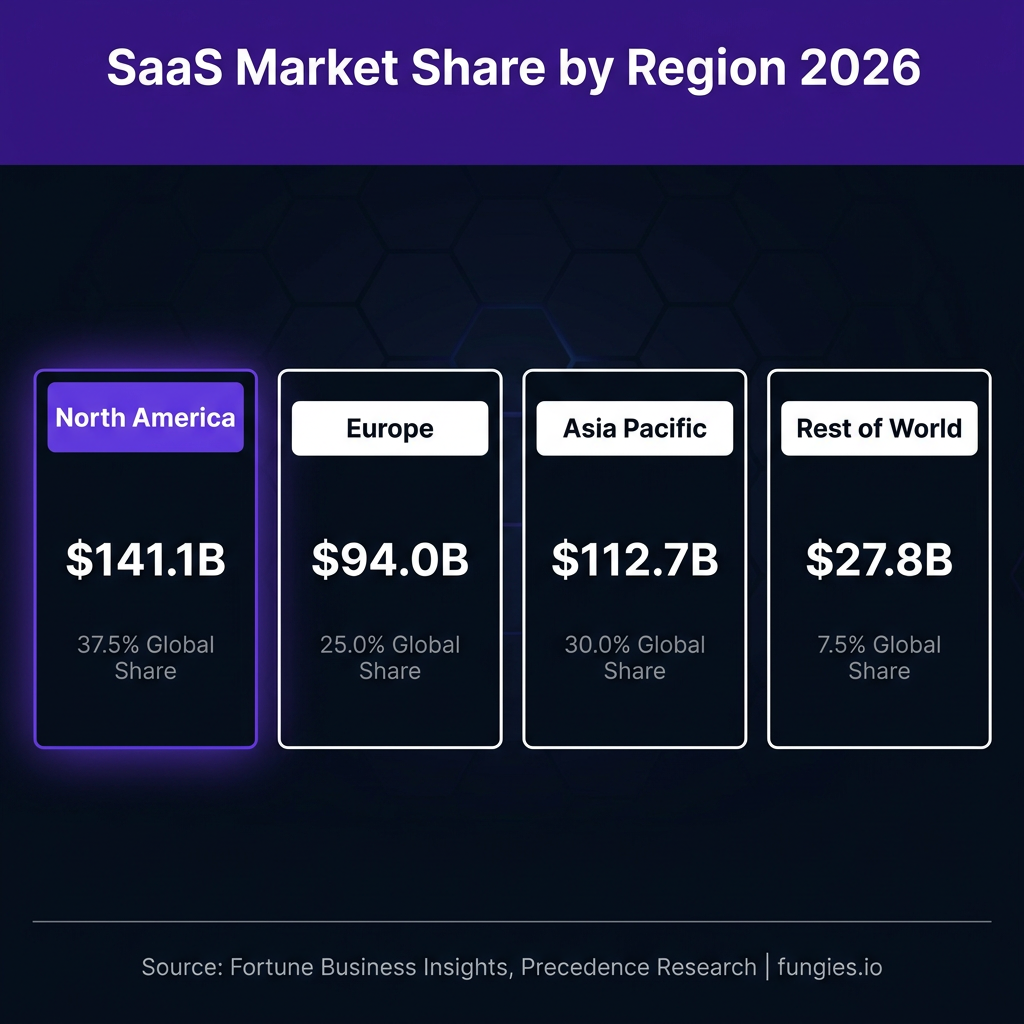
Geographic distribution of SaaS revenue reveals important insights about market maturity and growth opportunities. North America continues to dominate, but other regions are gaining ground rapidly.
The United States remains the epicenter of the SaaS industry, hosting approximately 17,000 SaaS companies—more than half the global total. US SaaS revenue is expected to reach $141.06 billion in 2026, representing roughly 37.5% of the global market. The US market is projected to exceed $412 billion by 2034, maintaining its leadership position.
Europe holds approximately 25% of the global SaaS market, with particularly strong showings in the United Kingdom, Germany, and France. European SaaS companies have benefited from GDPR-driven demand for compliance-focused solutions and the region’s strong enterprise software heritage.
The Asia-Pacific region represents the fastest-growing geographic segment, driven by digital transformation in China, India, Japan, and Southeast Asian markets. While exact market share figures vary by source, APAC’s growth rate consistently outpaces North America and Europe.
| Region | 2026 Market Size | Global Share | Growth Outlook |
|---|---|---|---|
| North America | $141.06B | 37.5% | Steady |
| Europe | $94.00B | 25.0% | Moderate |
| Asia Pacific | $112.70B | 30.0% | High |
| Latin America | $16.50B | 4.4% | Emerging |
| Middle East & Africa | $11.30B | 3.0% | Emerging |
Key Players & Market Share
The SaaS competitive landscape is characterized by a handful of dominant platforms and a long tail of specialized solutions. According to Statista and industry analysis, the most prominent companies in the SaaS market include Microsoft, Salesforce, Oracle, SAP, and Google.
These market leaders have achieved their positions through a combination of first-mover advantage, platform ecosystem effects, and strategic acquisitions. Microsoft, with its Office 365 and Azure portfolios, captures a significant portion of enterprise SaaS spending. Salesforce continues to dominate CRM, while Oracle and SAP leverage their enterprise software heritage in cloud transitions.
However, the market remains highly fragmented outside these giants. The average company uses 106 different SaaS applications (down from 112 in 2023 and 130 in 2022), indicating that despite consolidation efforts, organizations continue to rely on numerous specialized vendors.
| Company | Primary Category | Market Position |
|---|---|---|
| Microsoft | Productivity, Cloud | Market Leader |
| Salesforce | CRM | Market Leader |
| Oracle | Database, ERP | Major Player |
| SAP | ERP | Major Player |
| Productivity, Cloud | Major Player | |
| ServiceNow | ITSM, Workflow | Growth Leader |
| Snowflake | Data Warehouse | Growth Leader |
| Datadog | Monitoring | Growth Leader |
| CrowdStrike | Cybersecurity | Growth Leader |
| HubSpot | Marketing, CRM | Growth Leader |
Industry Benchmarks & KPIs
Understanding SaaS benchmarks is essential for evaluating company performance and market positioning. The following metrics represent industry standards based on data from thousands of SaaS companies.
Churn Rate Benchmarks
Churn remains the most critical metric for SaaS businesses. According to Optifai’s 2026 Pipeline Study of 939 B2B SaaS companies, churn rates vary dramatically by customer segment:
- Enterprise: 1-2% annual churn (0.08-0.17% monthly)
- Mid-Market: 1.5-3% monthly churn (18-36% annualized)
- SMB: 3-5% monthly churn (31-58% annualized)
- Best-in-class: <1% monthly across all segments
The median gross revenue retention for private SaaS companies stands at 92%, while net revenue retention (including expansion) averages 101%. Companies with net revenue retention above 110% can achieve sustainable growth from existing customers alone.
CAC and LTV Benchmarks
Customer acquisition economics vary significantly by segment. The median LTV:CAC ratio across all B2B SaaS segments is 3.2:1, with a healthy target of 3:1 minimum and 5:1 or higher indicating strong unit economics.
| Segment | LTV Range | CAC Payback Period | Target LTV:CAC |
|---|---|---|---|
| SMB | $15,000 – $40,000 | <12 months | 3:1 |
| Mid-Market | $80,000 – $200,000 | <18 months | 3.5:1 |
| Enterprise | $300,000 – $1M+ | <24 months | 4:1+ |
Notably, freemium acquisition models demonstrate significantly lower CAC ($141) compared to paid acquisition ($205), explaining why 48% of SaaS companies now offer freemium tiers as a primary top-of-funnel strategy.
Growth Rate Benchmarks
Growth expectations have moderated from the hyper-growth era of 2020-2021. According to Benchmarkit’s 2025 analysis:
- Median growth rate 2024: 26% (down from 35%+ in prior years)
- Top quartile growth 2024: 50% (down from 60% in 2023)
- Expansion ARR: 40% of total new ARR (up from 35% in 2023)
- Companies >$50M ARR: Expansion ARR represents >50% of new ARR
Spending Benchmarks
Operational spending patterns reveal strategic priorities across different funding stages:
| Category | VC-Backed | PE-Backed | Public Companies |
|---|---|---|---|
| Sales & Marketing | 47% of revenue | 33% of revenue | 35% of revenue |
| R&D | 34% of revenue | 28% of revenue | 23% of revenue |
| G&A | 19% of revenue | 15% of revenue | 12% of revenue |
Trends & Predictions Shaping 2026-2030
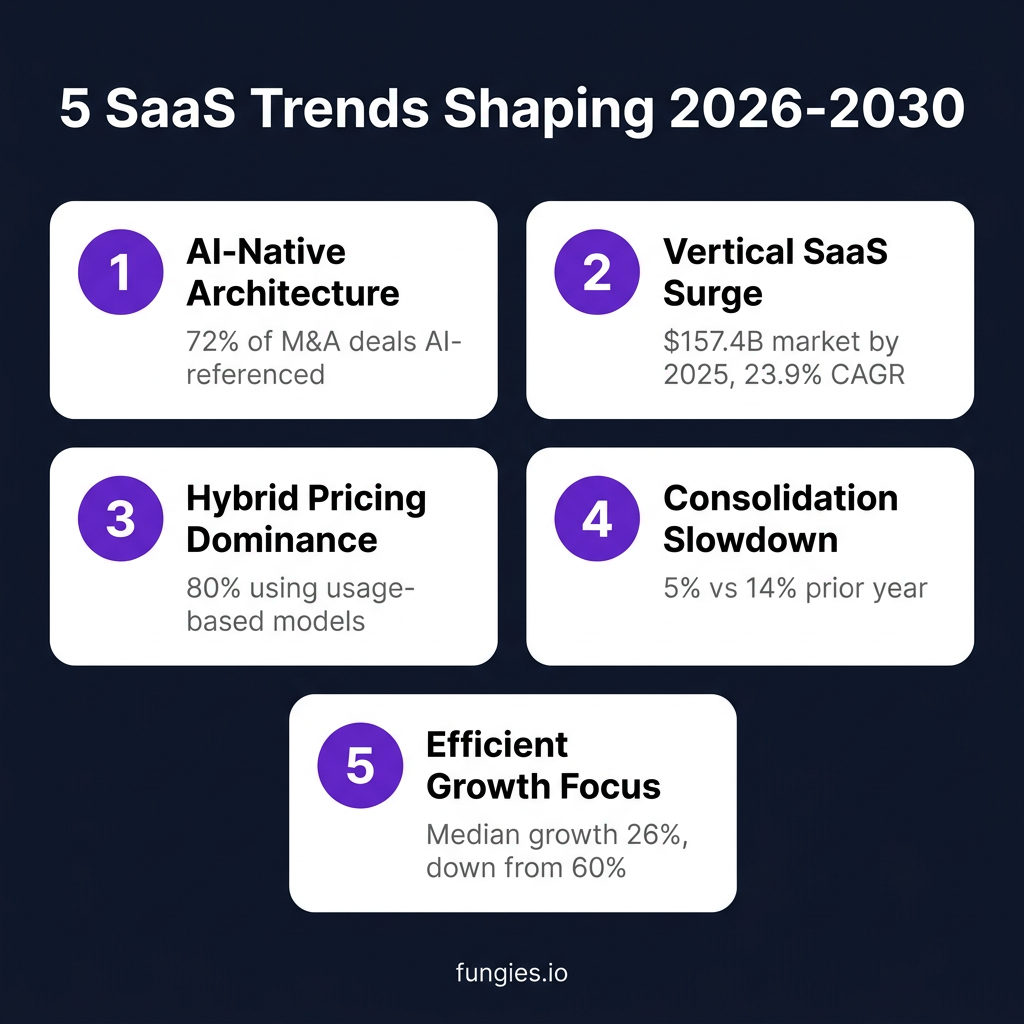
The SaaS industry is experiencing a structural transformation that will define the next five years. These five trends represent the most significant forces reshaping the market:
1. AI-Native Architecture Becomes Default
Artificial intelligence has transitioned from feature to foundation. According to Zylo’s 2025 SaaS Management Index, spending on AI-native applications increased 108% year-over-year. The State of FinOps 2025 Report found that 63% of organizations now manage AI spend, with adoption projected to reach 96% by 2026.
AI-native SaaS companies demonstrate a structural advantage—they achieve 3 to 5 times faster customer acquisition than traditional SaaS companies, according to Cloudnuro’s 2026 analysis. AI-powered features now command price premiums of 28-42% over non-AI equivalents, with generative AI capabilities creating upsell opportunities estimated at $40-80 billion in incremental annual revenue by 2027.
The M&A market reflects this shift: 72% of all SaaS M&A transactions in 2025 involved AI-referenced targets, according to Software Equity Group’s 2026 Annual SaaS Report. SaaS M&A activity reached its highest level on record in 2025, accounting for approximately 58% of total software M&A activity.
2. Vertical SaaS Surge
Horizontal, one-size-fits-all SaaS platforms are losing ground to specialized vertical solutions. Industry-specific SaaS is projected to reach $157.4 billion by 2025, growing at a 23.9% CAGR—roughly double the pace of many horizontal segments.
This trend is driven by the realization that generic workflows often fail to capture industry-specific nuances. Vertical SaaS solutions offer pre-built compliance frameworks, industry-standard integrations, and specialized analytics that horizontal platforms struggle to match. For payment infrastructure providers like Fungies.io, this creates opportunities to serve specialized verticals with tailored checkout and tax compliance solutions.
3. Hybrid Pricing Dominance
The traditional seat-based subscription model is giving way to more flexible pricing approaches. According to Maxio’s 2025 Pricing Trends Report, over 80% of companies now use some form of consumption or usage-based pricing. Companies using hybrid models (subscription + usage) report the highest median growth rate of 21%, outperforming pure subscription and pure usage-based models.
This shift reflects buyer demands for flexibility and value alignment. However, it introduces operational complexity—73% of SaaS companies with usage-based models are actively forecasting variable revenue for financial predictability. The companies mastering this complexity will capture significant competitive advantage.
4. Consolidation Slowdown
After years of rapid SaaS sprawl, organizations are taking a more measured approach to consolidation. The average number of SaaS apps per company declined to 106 in 2024 (from 112 in 2023 and 130 in 2022). However, the consolidation rate has dropped from 14% to just 5% year-over-year, according to BetterCloud’s 2026 analysis.
This suggests organizations have reached an equilibrium—they’ve eliminated redundant tools but are maintaining specialized solutions where they deliver clear value. The focus has shifted from tool reduction to cost optimization and risk management within existing portfolios.
5. Efficient Growth Imperative
The era of growth-at-all-costs has definitively ended. According to Benchmarkit’s 2025 analysis, median growth rates declined to 26% (from 35%+ in prior years), while top-quartile growth fell from 60% to 50%. Simultaneously, new CAC ratios for customer acquisition rose 14% higher in 2024.
Investors and boards now prioritize sustainable, efficient growth. This means lower burn rates, faster paths to profitability, and disciplined unit economics. The companies thriving in this environment have mastered the balance between growth and efficiency—achieving scale without sacrificing the fundamentals of sound business operations.
Adoption & Usage Statistics
Beyond market size and financial metrics, understanding how organizations actually use SaaS products provides crucial context for market dynamics.
The average organization now deploys 7.3 SaaS applications with AI functionality, representing 7% of total SaaS apps in 2025. This AI penetration is accelerating rapidly—45% of organizations now use AI in IT service management SaaS applications.
SaaS adoption varies significantly by company size. Larger enterprises tend to have more fragmented SaaS portfolios, while smaller companies often rely on integrated suites. The average number of SaaS applications by company size:
| Company Size | Average SaaS Apps | Primary Use Cases |
|---|---|---|
| 1-50 employees | 25-40 | Core operations, limited specialized tools |
| 51-200 employees | 60-80 | Department-specific solutions emerging |
| 201-1,000 employees | 90-110 | Full departmental stacks, some redundancy |
| 1,001-5,000 employees | 120-150 | Complex portfolios, governance challenges |
| 5,000+ employees | 150-250+ | Enterprise suites + numerous point solutions |
Notably, over 50% of SaaS software used in companies is not managed by the IT team—a phenomenon known as “shadow IT.” This creates both opportunities for SaaS vendors (easier adoption) and risks for organizations (security, compliance, cost management).
Methodology
This report synthesizes data from multiple authoritative sources to provide a comprehensive view of the SaaS market in 2026. Our methodology includes:
- Market sizing: Analysis of reports from Fortune Business Insights, Mordor Intelligence, Precedence Research, and Grand View Research
- Benchmark data: Aggregation of studies from Optifai (939 companies), Benchmarkit, SaaS Capital, and Zylo
- Trend analysis: Review of industry reports from BetterCloud, Software Equity Group, and Maxio
- Financial metrics: Data from public company filings and private company surveys
Where sources provide conflicting figures, we present ranges or note the variance. Market size estimates vary based on definitional boundaries—some analysts include only pure SaaS subscriptions, while others incorporate related services and infrastructure. CAGR projections reflect different forecast periods and methodological assumptions.
All monetary figures are in USD unless otherwise specified. Growth rates are compound annual growth rates (CAGR) unless noted as year-over-year (YoY). Regional breakdowns are based on company headquarters location for market share analysis.
Frequently Asked Questions
What is the size of the SaaS market in 2026?
The global SaaS market is valued at approximately $375.57 billion to $465 billion in 2026, depending on the source and methodology. Fortune Business Insights estimates $375.57 billion, while Precedence Research places the figure at $465.03 billion. The B2B SaaS segment alone is estimated at $492.34 billion.
What is the projected growth rate for the SaaS market?
Analysts project a compound annual growth rate (CAGR) of 12.85% to 18.7% through the early 2030s. Fortune Business Insights forecasts 18.7% CAGR through 2034, while Precedence Research projects 12.85% through 2035. The B2B SaaS segment is expected to grow faster at 26.24% CAGR.
What is a good churn rate for SaaS companies?
Churn benchmarks vary significantly by customer segment. Enterprise SaaS should target 1-2% annual churn, mid-market 1.5-3% monthly, and SMB 3-5% monthly. Best-in-class companies across all segments achieve less than 1% monthly churn. Net revenue retention above 110% indicates strong expansion revenue offsetting any churn.
What is the ideal LTV:CAC ratio for SaaS?
A 3:1 LTV:CAC ratio represents the minimum threshold for sustainable growth, while 4:1 or higher indicates scale-ready unit economics. The median across B2B SaaS segments is 3.2:1. Growth-stage companies between $2M and $10M ARR should target 3 to 4:1 for efficient scaling.
How many SaaS companies exist globally?
There are approximately 33,200+ SaaS companies worldwide as of 2026, representing a 32% increase from 25,000 in 2021. The United States hosts roughly 17,000 of these companies, making it the largest SaaS ecosystem globally.
Sources & Citations
This report draws on data from the following authoritative sources:
- Fortune Business Insights. “Software as a Service (SaaS) Market Size, Global Report, 2034.” https://www.fortunebusinessinsights.com/software-as-a-service-saas-market-102222
- Mordor Intelligence. “Software As A Service Market Size, Share Analysis | Industry Report 2026-2031.” https://www.mordorintelligence.com/industry-reports/software-as-a-service-market
- Mordor Intelligence. “B2B SaaS Market Size, Share Analysis, Growth Report 2026-2031.” https://www.mordorintelligence.com/industry-reports/b2b-saas-market
- Precedence Research. “Software As A Service (SaaS) Market Size, Share, and Trends 2026 to 2035.” https://www.precedenceresearch.com/software-as-a-service-market
- CompaniesHistory.com. “SaaS Industry Growth Statistics 2026.” https://www.companieshistory.com/saas-industry-growth-statistics
- Hostinger. “SaaS statistics for 2026: Growth, adoption, and market trends.” https://www.hostinger.com/tutorials/saas-statistics
- Zylo. “175+ Unmissable SaaS Statistics for 2026.” https://zylo.com/blog/saas-statistics
- BetterCloud. “147 SaaS statistics for 2026.” https://www.bettercloud.com/monitor/saas-statistics
- Tridens. “Top 6 SaaS Industry Trends for 2026.” https://tridenstechnology.com/saas-trends
- Vena Solutions. “85 SaaS Statistics, Trends and Benchmarks for 2026.” https://www.venasolutions.com/blog/saas-statistics
- Quantumrun. “SaaS Industry Growth Statistics 2026.” https://www.quantumrun.com/consulting/saas-industry-growth-statistics
- SellersCommerce. “31 Eye-Opening SaaS Statistics In 2026.” https://www.sellerscommerce.com/blog/saas-statistics
- Optifai. “B2B SaaS Churn Rate Benchmarks — 939 Companies by Segment & ACV.” https://optif.ai/learn/questions/b2b-saas-churn-rate-benchmark
- Optifai. “B2B SaaS LTV Benchmarks — 939 Companies by Segment.” https://optif.ai/learn/questions/b2b-saas-ltv-benchmark
- Genesys Growth. “B2B SaaS Churn Rates — 33 Statistics Every Marketing Leader Should Know in 2026.” https://genesysgrowth.com/blog/saas-churn-rates-stats-for-marketing-leaders
- Vena Solutions. “2025 SaaS Churn Rate: Benchmarks, Formulas and Calculator.” https://www.venasolutions.com/blog/saas-churn-rate
- Digital Applied. “Customer Acquisition Cost Benchmarks 2026: By Industry.” https://www.digitalapplied.com/blog/customer-acquisition-cost-benchmarks-2026-industry
- SaaS Hero. “Best LTV to CAC Ratio Benchmarks for B2B SaaS in 2026.” https://www.saashero.net/strategy/b2b-saas-ltv-cac-benchmarks
- Benchmarkit. “2025 SaaS Performance Metrics.” https://www.benchmarkit.ai/2025benchmarks
- Maxio. “2025 SaaS Pricing Report: Usage-Based Models and More.” https://www.maxio.com/resources/2025-saas-pricing-trends-report
- Software Equity Group. “SEG 2026 Annual SaaS Report.” https://softwareequity.com/research/annual-saas-report
- Statista. “Software as a Service – statistics & facts.” https://www.statista.com/topics/3071/cloud-software-as-a-service-saas
- Flippa. “Top SaaS Companies in the USA (2026 Guide).” https://flippa.com/blog/top-saas-companies
- Amra and Elma. “TOP 20 SAAS CUSTOMER ACQUISITION STATISTICS 2026.” https://www.amraandelma.com/saas-customer-acquisition-statistics
- Zylo. “2026’s Top SaaS Trends to Watch.” https://zylo.com/blog/saas-trends
Last updated: May 28, 2026. Data represents the most recent available statistics from cited sources. Market projections are based on analyst forecasts and should be considered directional rather than precise predictions.