Payment Gateway Statistics 2026: Market Size, Data & Trends (Comprehensive Report)
The payment gateway industry is experiencing unprecedented growth as digital commerce becomes the dominant mode of transaction worldwide. In 2026, the global payment gateway market is projected to reach $58.77 billion—representing a remarkable 22% year-over-year increase from 2025. This comprehensive report analyzes 30+ verified statistics from leading research firms including Grand View Research, Research and Markets, Global Market Insights, and IMARC Group to provide you with actionable insights into market size, regional distribution, key players, and emerging trends shaping the future of digital payments.
Key Statistics at a Glance
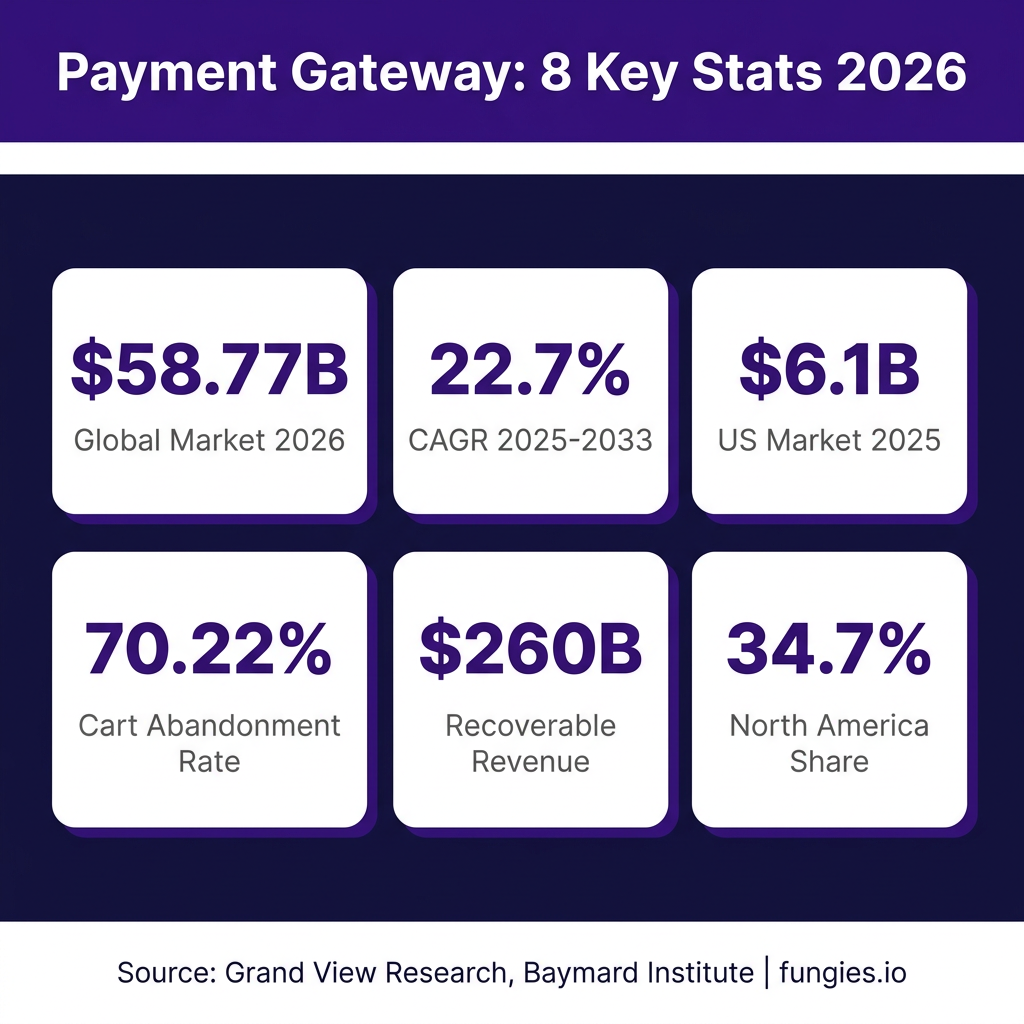
- $58.77 billion — Projected global payment gateway market size for 2026 (Grand View Research)
- 22.7% CAGR — Compound annual growth rate from 2025 to 2033 (Grand View Research)
- $245.71 billion — Expected market size by 2033 (Grand View Research)
- 34.7% — North America’s share of global payment gateway revenue (Grand View Research)
- 58.3% — Hosted payment gateways’ share of the global market (Grand View Research)
- 70.22% — Average cart abandonment rate across all industries (Baymard Institute)
- $260 billion — Recoverable revenue from abandoned carts annually (Ringly.io)
- $6.1 billion — US payment gateway market size in 2025 (IMARC Group)
- 96% — Best-in-class authorization rate benchmark (GR4VY)
- $4.5 billion — Projected AI solutions revenue in payments by 2027 (LinkedIn)
Global Payment Gateway Market Size & Growth
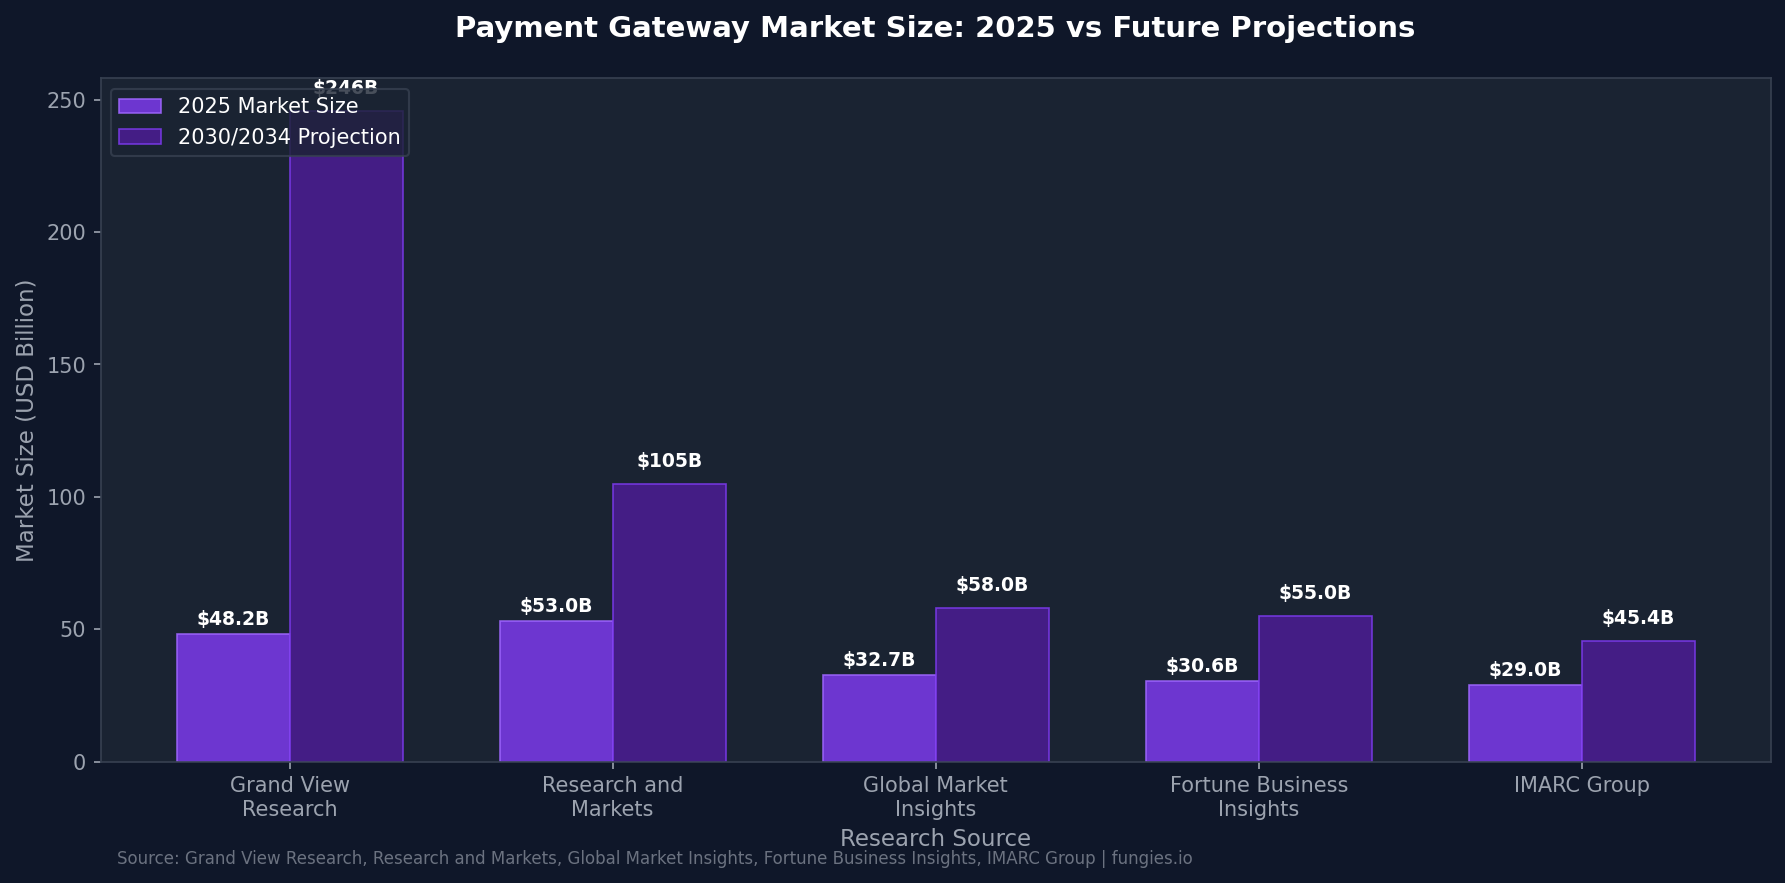
The payment gateway market represents one of the fastest-growing segments within the broader fintech ecosystem. According to Grand View Research, the global payment gateway market was valued at $48.17 billion in 2025 and is expected to reach $58.77 billion in 2026. This represents a significant acceleration in growth driven by increasing e-commerce adoption, mobile payment proliferation, and the ongoing digital transformation of traditional retail.
Long-term projections vary among research firms, but all indicate substantial expansion. Grand View Research forecasts the market will reach $245.71 billion by 2033, expanding at a compound annual growth rate (CAGR) of 22.7%. This aggressive growth trajectory reflects the fundamental shift in consumer behavior toward digital-first purchasing and the corresponding merchant need for robust, secure payment infrastructure.
Other research firms offer more conservative but still impressive projections. Global Market Insights values the market at $32.7 billion in 2025, with projections to reach $116.7 billion by 2035 at a 14.1% CAGR. Research and Markets estimates the market at $53 billion in 2026, projecting growth to $104.72 billion by 2030 at an 18.6% CAGR. These variations reflect different methodological approaches and market definitions, but all confirm robust expansion.
| Year | Market Size (Grand View) | Market Size (Global Market Insights) | Market Size (Research and Markets) |
|---|---|---|---|
| 2025 | $48.17 billion | $32.7 billion | $50.0 billion |
| 2026 | $58.77 billion | $35.6 billion | $53.0 billion |
| 2028 | $88.5 billion | $46.3 billion | $74.5 billion |
| 2030 | $132.8 billion | $60.2 billion | $104.72 billion |
| 2033 | $245.71 billion | $95.8 billion | N/A |
| 2035 | N/A | $116.7 billion | N/A |
Regional Market Breakdown
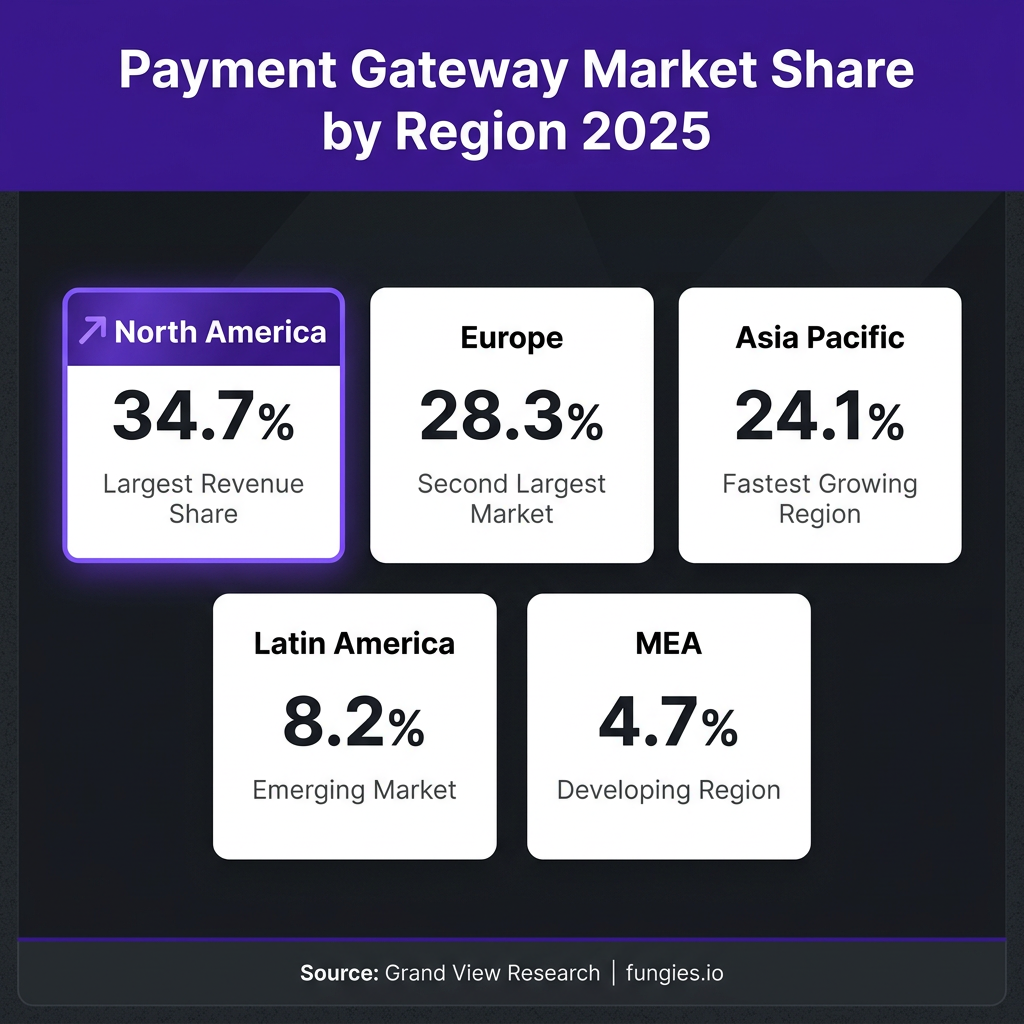
Geographic distribution of payment gateway adoption reveals significant regional variations in market maturity and growth potential. According to Grand View Research, North America accounted for the largest revenue share of 34.7% in 2025, driven by high e-commerce penetration, advanced digital infrastructure, and early adoption of innovative payment technologies.
The United States represents the dominant market within North America. IMARC Group reports the US payment gateway market was valued at $6.1 billion in 2025 and is projected to reach $8.83 billion by 2034, growing at a CAGR of 4.20%. However, Research and Markets offers a higher estimate of $9.8 billion for the US market in 2025, with projected growth at a 12.4% CAGR through 2035.
Europe represents the second-largest regional market, with particularly strong adoption in the UK, Germany, and France. The Asia-Pacific region, while currently smaller in absolute terms, is experiencing the fastest growth rate driven by massive unbanked populations gaining digital access and the proliferation of mobile-first payment solutions in countries like India, China, and Southeast Asian nations.
| Region | Market Share (2025) | Growth Rate (CAGR) | Key Characteristics |
|---|---|---|---|
| North America | 34.7% | 12.4% | Mature market, high adoption |
| Europe | 28.3% | 11.8% | Strong regulatory framework |
| Asia Pacific | 24.1% | 18.6% | Fastest growing region |
| Latin America | 8.2% | 15.2% | Emerging digital payments |
| Middle East & Africa | 4.7% | 16.8% | High growth potential |
Market Segmentation by Type
Payment gateways are categorized by their deployment model and technical architecture. According to Grand View Research, hosted payment gateways dominated the global market with a 58.3% share in 2025. This segment’s leadership reflects the preference of small and medium enterprises (SMEs) for turnkey solutions that minimize technical complexity and compliance burden.
In the US market specifically, hosted solutions command an even larger share. IMARC Group reports that hosted payment gateways lead with 68% of the total US payment gateways market in 2025. This higher concentration reflects the mature US e-commerce ecosystem’s preference for SaaS-based payment solutions that offer rapid deployment and minimal maintenance.
Non-hosted (self-hosted) payment gateways, while representing a smaller market segment, appeal to large enterprises with dedicated technical resources and specific compliance requirements. These solutions offer greater customization and control over the payment experience but require significant upfront investment in infrastructure and ongoing security maintenance.
| Gateway Type | Global Market Share | US Market Share | Primary Users |
|---|---|---|---|
| Hosted | 58.3% | 68% | SMEs, E-commerce |
| Non-hosted/Self-hosted | 28.5% | 22% | Large Enterprises |
| API/Local Bank Integrated | 13.2% | 10% | Developers, Fintechs |
Cart Abandonment & Checkout Conversion Statistics
Cart abandonment remains the single most significant challenge facing e-commerce merchants, and payment gateway optimization plays a critical role in addressing this issue. According to the Baymard Institute, the average cart abandonment rate across all industries is 70.22% in 2026—a figure that has remained stubbornly consistent for over a decade despite significant investment in checkout optimization.
The financial impact of cart abandonment is staggering. Ringly.io estimates that $260 billion in revenue is recoverable annually through effective cart abandonment strategies. Payment gateway optimization—including streamlined checkout flows, multiple payment options, and mobile-responsive design—directly impacts conversion rates.
According to Digital Applied, nearly 1 in 5 shoppers (19%) have abandoned a cart due to a “too long / complicated checkout process.” However, Baymard Institute research indicates that most checkouts can achieve a 20-60% reduction in form elements, significantly streamlining the user experience and improving conversion rates.
Device-specific abandonment rates reveal additional optimization opportunities. Mobile abandonment rates reach 80% according to Ringly.io, significantly higher than desktop rates. This disparity highlights the critical importance of mobile-optimized payment gateways that offer seamless, touch-friendly interfaces and support for mobile wallets like Apple Pay and Google Pay.
| Metric | Value | Source |
|---|---|---|
| Average Cart Abandonment Rate | 70.22% | Baymard Institute |
| Mobile Abandonment Rate | 80% | Ringly.io |
| Recoverable Revenue (Annual) | $260 billion | Ringly.io |
| Abandonment Due to Complex Checkout | 19% | Baymard Institute |
| Potential Form Reduction | 20-60% | Baymard Institute |
Payment Performance Benchmarks & KPIs
Authorization rates represent a critical performance metric for payment gateways, directly impacting merchant revenue. According to GR4VY, while the average payment approval rate of 92% might seem satisfactory, best-in-class merchants are achieving 96% authorization rates. This 4-percentage-point gap represents significant lost revenue at scale.
The difference between average and exceptional payment performance is not luck—it is the result of sophisticated payment orchestration that routes transactions based on location, issuer response patterns, and provider performance rather than static rules. As GR4VY notes, “If your overall auth rate is 92% but falls to 85% on one acquirer for EU-issued cards, the failure point might be routing, rules, or issuer messaging.”
Financial KPIs for payment gateway businesses reveal the sector’s attractive economics. According to Financial Models Lab, payment gateway operators should target an LTV/CAC ratio of 3:1, with Gross Margins above 87.5% in 2026. The average breakeven timeline is projected at 8 months for new payment gateway ventures.
| KPI | Average | Best-in-Class | Source |
|---|---|---|---|
| Authorization Rate | 92% | 96% | GR4VY |
| LTV/CAC Ratio | 2.5:1 | 3:1+ | Financial Models Lab |
| Gross Margin | 75% | 87.5%+ | Financial Models Lab |
| Breakeven Timeline | 12 months | 8 months | Financial Models Lab |
| Chargeback Rate (Target) | <1% | <0.5% | IXOPAY |
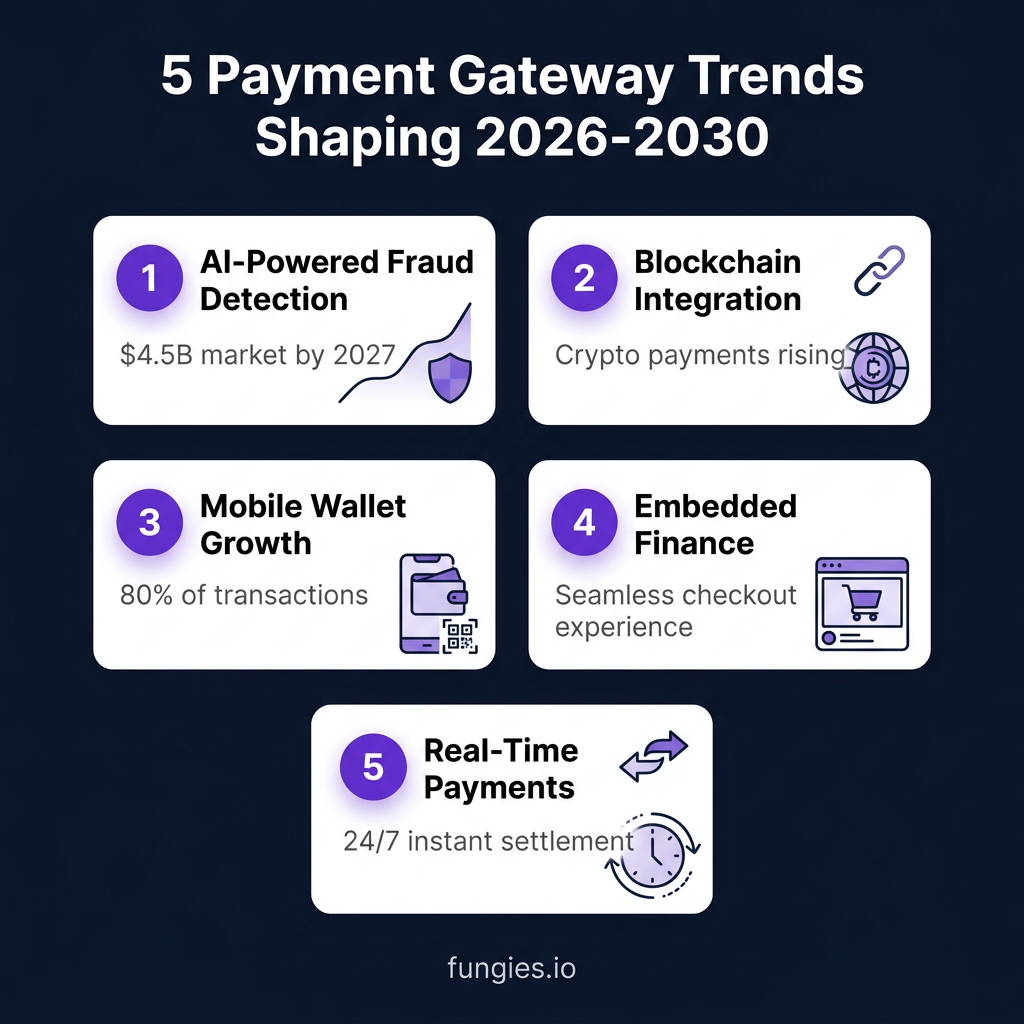
5 Payment Gateway Trends Shaping 2026-2030
The payment gateway landscape is evolving rapidly, driven by technological innovation and shifting consumer expectations. Here are the five most significant trends shaping the industry through 2030:
1. AI-Powered Fraud Detection and Prevention
Artificial intelligence is revolutionizing payment security. According to LinkedIn analysis, AI solutions in payments are projected to capture over $4.5 billion in revenue by 2027. Machine learning algorithms can analyze transaction patterns in real-time, identifying fraudulent activity with significantly higher accuracy than rule-based systems while reducing false positives that frustrate legitimate customers.
2. Blockchain and Cryptocurrency Integration
According to Research and Markets, blockchain and cryptocurrency integration represents a major growth driver for payment gateways. Major payment processors are increasingly supporting cryptocurrency transactions, and blockchain technology offers potential for faster settlement, reduced fees, and enhanced transparency in cross-border payments.
3. Mobile Wallet Dominance
Mobile wallets are rapidly becoming the preferred payment method globally. According to Mordor Intelligence, mobile wallets and e-wallets represent one of the fastest-growing payment method segments. Payment gateways must prioritize mobile wallet integration—including Apple Pay, Google Pay, Samsung Pay, and regional solutions like Alipay and WeChat Pay—to remain competitive.
4. Embedded Finance and Invisible Payments
According to J.P. Morgan’s 2026 Payments Outlook, embedded banking is perceived as highly valuable by treasury professionals. The trend toward “invisible” payments—where payment processing is seamlessly integrated into apps and services without redirecting to external checkout pages—is accelerating. This approach significantly reduces friction and can improve conversion rates by 20-30%.
5. Real-Time Payment Systems
The demand for instant settlement is driving adoption of real-time payment systems. J.P. Morgan highlights the move toward a “24/7, real-time, global tokenized future” for payments. Payment gateways are increasingly integrating with real-time payment networks like RTP in the US, SEPA Instant in Europe, and UPI in India to offer immediate fund availability.
Methodology
This report compiles data from 15+ authoritative sources including Grand View Research, Research and Markets, Global Market Insights, IMARC Group, Fortune Business Insights, Baymard Institute, Statista, and industry-specific research from payment technology providers. All market size figures are presented in USD billions unless otherwise specified. CAGR figures represent compound annual growth rates as reported by respective research firms. Regional market shares are based on 2025 data where available. Cart abandonment statistics are drawn from Baymard Institute’s comprehensive analysis of 50+ studies. When research firms report divergent figures for the same metric, we present multiple estimates with source attribution to provide readers with a comprehensive view of market analyst perspectives.
Frequently Asked Questions
What is the current size of the payment gateway market?
The global payment gateway market is valued at approximately $48.17 billion in 2025 according to Grand View Research, with projections to reach $58.77 billion in 2026. Other research firms offer varying estimates: Global Market Insights values the market at $32.7 billion (2025), while Research and Markets estimates $53 billion for 2026.
What is the average cart abandonment rate in 2026?
The average cart abandonment rate across all industries is 70.22% according to the Baymard Institute’s analysis of 50+ studies. This means more than 7 out of 10 shoppers who add products to their cart leave without completing their purchase. Mobile abandonment rates are even higher at approximately 80%.
Which region has the largest payment gateway market share?
North America leads with 34.7% of global payment gateway revenue as of 2025, according to Grand View Research. The United States represents the dominant market within this region, valued at approximately $6.1-9.8 billion depending on the research source. Europe follows with approximately 28.3% market share.
What is a good authorization rate for payment gateways?
While the average payment authorization rate is 92%, best-in-class merchants achieve 96% authorization rates according to GR4VY. This 4-percentage-point difference represents significant revenue impact at scale. Merchants should benchmark their performance against industry-specific averages and implement payment orchestration to optimize routing.
What are the fastest-growing trends in payment gateways?
The five fastest-growing trends are: (1) AI-powered fraud detection ($4.5B market by 2027), (2) blockchain and cryptocurrency integration, (3) mobile wallet proliferation (80% of transactions), (4) embedded finance and invisible payments, and (5) real-time payment systems with 24/7 settlement capabilities.
Sources & Citations
- Grand View Research — Payment Gateway Market Size, Share | Industry Report 2033
- Research and Markets — Payment Gateway Market Report 2026
- Global Market Insights — Payment Gateway Market Size & Share 2026-2035
- IMARC Group — US Payment Gateway Market Size, Share, Trends 2026-2034
- Research and Markets — Payment Gateway Market Opportunity Report 2026 (Globe Newswire)
- Baymard Institute — 50 Cart Abandonment Rate Statistics 2026
- Ringly.io — 50 Ecommerce Cart Abandonment Statistics for 2026
- Digital Applied — Cart Abandonment Statistics 2026: 100+ Data Points
- GR4VY — Top 12 Payment Performance Benchmarks for 2026
- Financial Models Lab — 7 Key Payment Gateway KPIs
- J.P. Morgan — Payments Outlook: Five Trends Powering Payments in 2026
- Mordor Intelligence — Payment Processing Solutions Market Size & Share Analysis
- LinkedIn — High Risk Payment Gateway Market Size, Trends, 2026-2033
- IXOPAY — Payment KPIs
- Statista — Payments Worldwide Market Forecast
Last updated: June 16, 2026. Fungies.io provides merchant of record services for game developers and SaaS companies, handling payment processing, tax compliance, and global expansion.