Payment Processing Statistics 2026: Market Size, Data & Trends (Comprehensive Report)
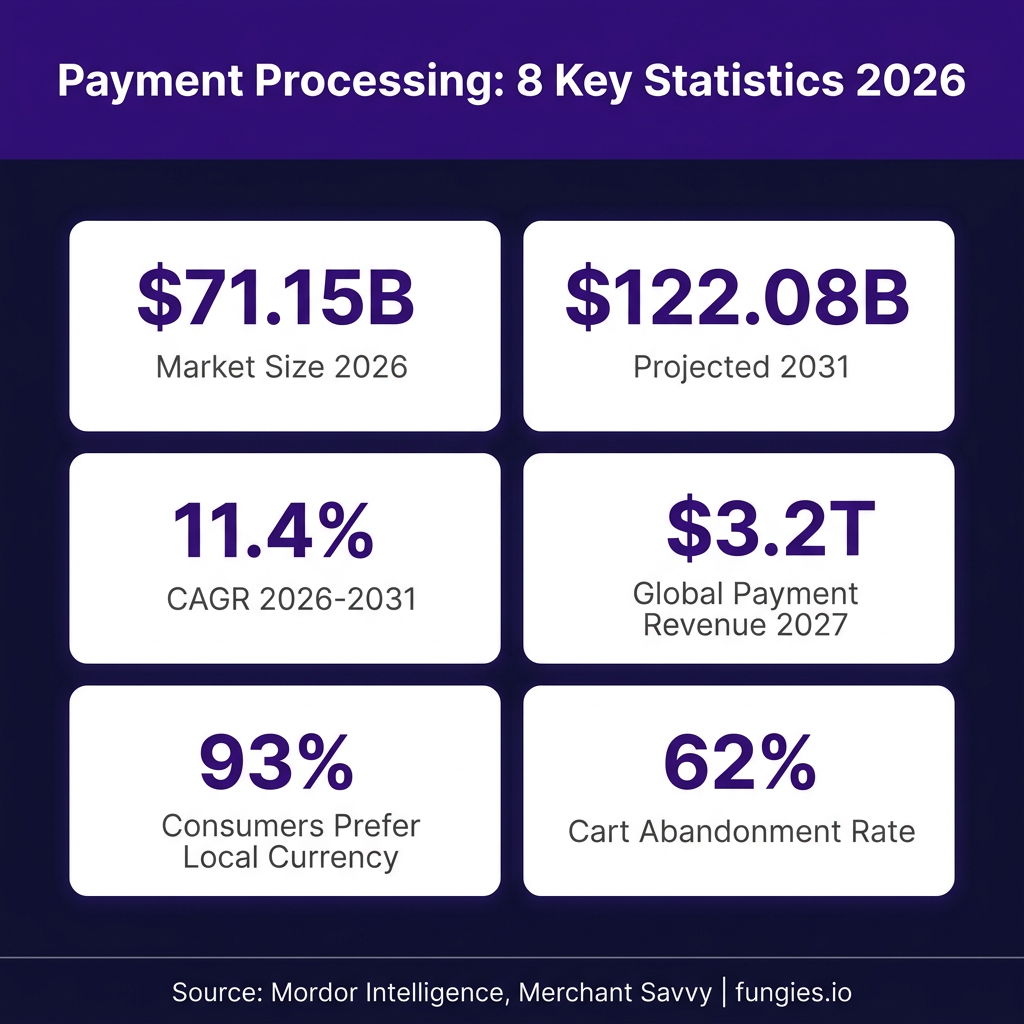
The global payment processing industry is undergoing a transformation of historic proportions. In 2026, the market is valued at $71.15 billion and is projected to nearly double to $122.08 billion by 2031, representing a compound annual growth rate (CAGR) of 11.4%. What’s driving this explosive growth? The answer lies in the convergence of embedded finance, real-time payment systems, and the relentless shift toward digital commerce.
This comprehensive report compiles 40+ verified statistics from authoritative sources including Mordor Intelligence, Precedence Research, the European Central Bank, and McKinsey. Whether you’re a merchant evaluating payment partners, an investor analyzing market opportunities, or a developer building the next generation of financial infrastructure, this data will inform your strategic decisions.
Key Statistics at a Glance
- The global payment processor market reached $71.15 billion in 2026, up from $63.87 billion in 2025 (Mordor Intelligence)
- Payment processing solutions market is significantly larger at $208.57 billion in 2026, projected to hit $1.05 trillion by 2035 (Precedence Research)
- The broader global payments sector generated $2.2 trillion in revenue in 2022 and is forecast to reach $3.2 trillion by 2027 (Merchant Savvy)
- Credit cards maintain 44.55% market share of payment processor revenue in 2025
- E-wallet transactions are growing at 14.82% CAGR, targeting $25 trillion in global volume by 2027
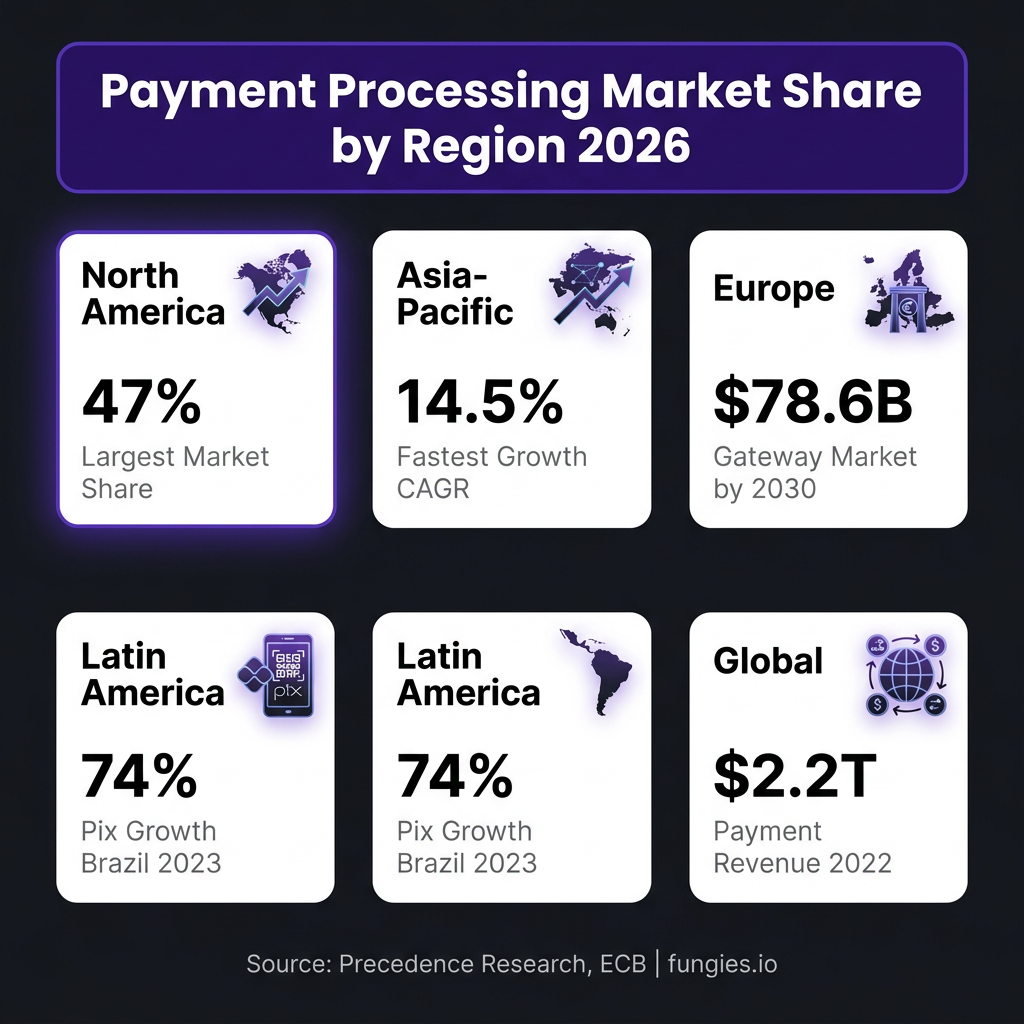
- North America commands 29.6-47% of global market share, while Asia-Pacific leads growth at 14.48% CAGR
- 93% of global consumers say pricing in their local currency affects their purchase decision (Airwallex)
- 62% of consumers abandon their carts if they encounter problems during checkout (Testlio)
- AI-powered fraud detection can potentially reduce processing costs by 30%
- Real-time account-to-account (A2A) payments can reduce cross-border fees by up to 75% (Bank for International Settlements)
Market Size & Growth Analysis
The payment processing market demonstrates remarkable growth trajectories across multiple measurement frameworks. Understanding these figures is essential for strategic planning and investment decisions.
Payment Processor Market (Core Infrastructure)
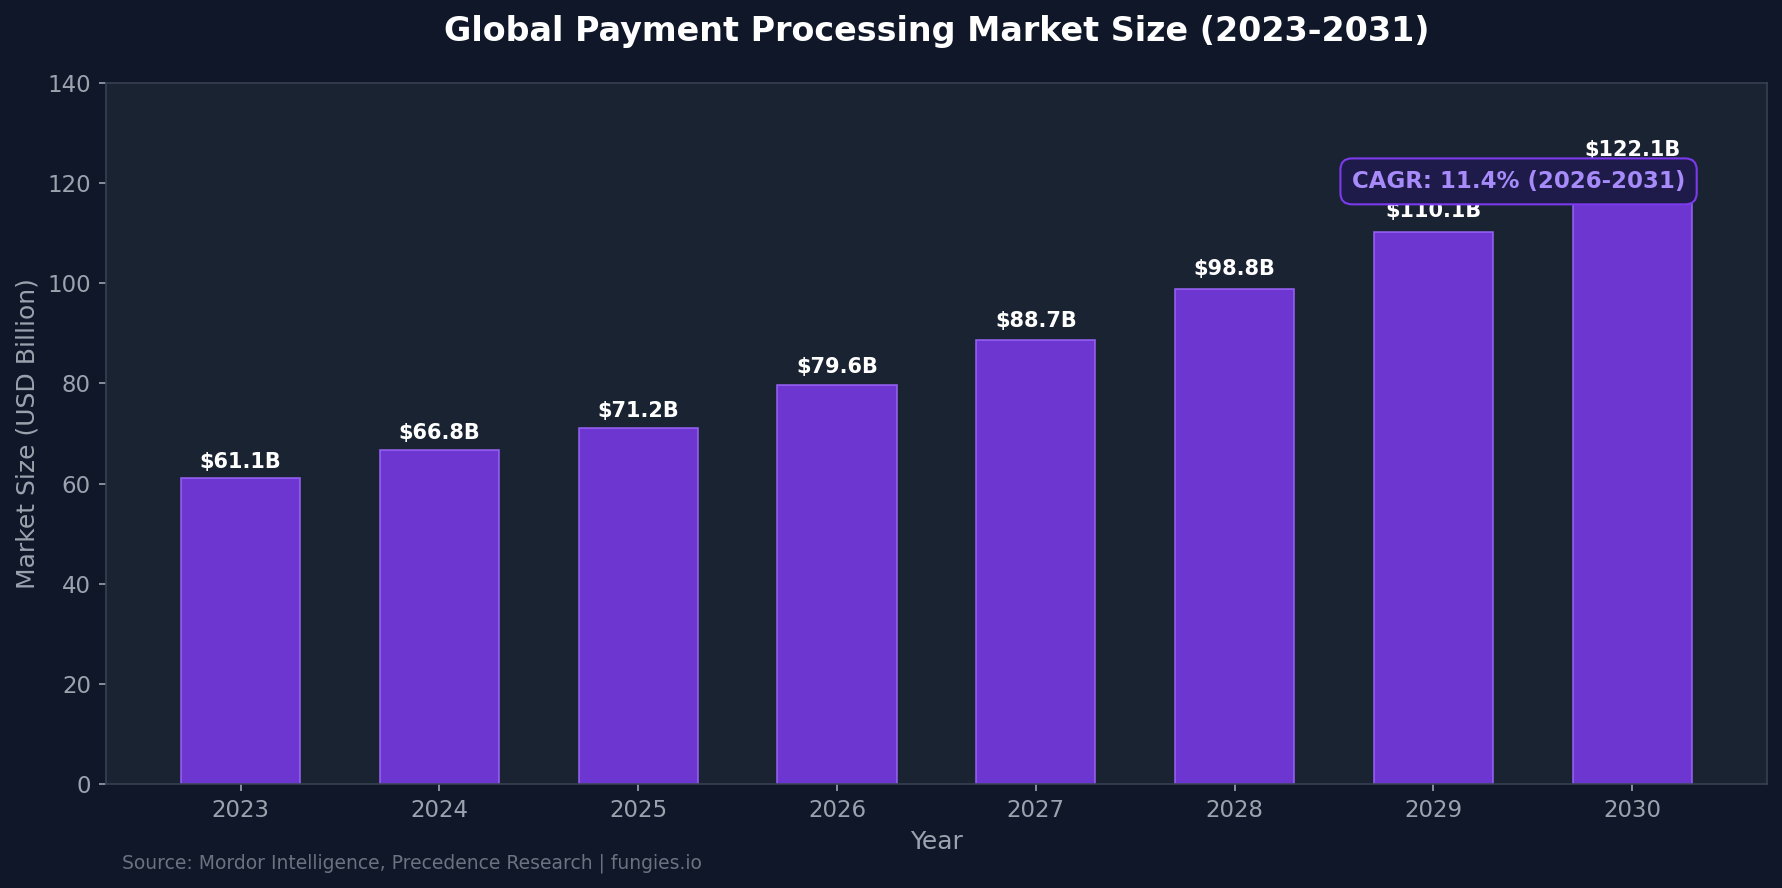
According to Mordor Intelligence, the payment processor market—representing the core infrastructure that facilitates transaction authorization, clearing, and settlement—was valued at $63.87 billion in 2025 and grew to $71.15 billion in 2026. This segment is projected to reach $122.08 billion by 2031, expanding at an 11.4% CAGR. This growth stems from embedded finance adoption, real-time payment modernization, and regulatory frameworks that widen addressable volumes.
Payment Processing Solutions Market (Broader Ecosystem)
The broader payment processing solutions market, which includes gateways, fraud management, and value-added services, presents an even larger opportunity. Precedence Research estimates this market at $173.38 billion in 2025, growing to $208.57 billion in 2026. By 2035, this market is anticipated to reach approximately $1.05 trillion, representing a CAGR of 19.76% from 2026 to 2035.
Global Payments Revenue (Industry-Wide)
The entire global payments ecosystem—including banks, processors, networks, and fintechs—generated $2.2 trillion in revenue in 2022, an 11% increase from the previous year. Merchant Savvy forecasts this figure to reach $3.2 trillion by 2027, with payments making up 38% of all banking revenue. The sector is expected to maintain a 7% CAGR through 2027.
| Market Segment | 2025 Value | 2026 Value | 2031 Forecast | CAGR |
|---|---|---|---|---|
| Payment Processor Market | $63.87B | $71.15B | $122.08B | 11.4% |
| Payment Processing Solutions | $173.38B | $208.57B | $1,051.93B (2035) | 19.76% |
| Global Payments Revenue | $2.4T (est.) | $2.6T (est.) | $3.2T (2027) | 7% |
| Real-Time Payments Market | $34.16B | $47.06B | $498.99B (2034) | 34.3% |
Regional Market Breakdown
Payment processing growth is not uniform across geographies. Regional dynamics reflect varying levels of digital infrastructure maturity, regulatory environments, and consumer behavior patterns.
North America: Market Leader
North America commands the largest share of the global payment processing market, holding approximately 29.6-47% depending on measurement methodology. The United States alone is expected to generate $36.75 billion in payment processing solutions revenue by 2030. The region benefits from mature digital infrastructure, high credit card penetration, and early adoption of emerging technologies like contactless payments and digital wallets.
Asia-Pacific: Fastest Growth Region
Asia-Pacific delivers the fastest expansion with a 14.48% CAGR. The region generated 47% of global payments revenues ($1 trillion) and achieved a 25% annual growth rate (excluding China, which declined 3%). India exemplifies this growth: the country processed over 130 billion digital payment transactions in 2025, with UPI (Unified Payments Interface) accounting for over 75% of transaction volumes—more than 13 billion transactions monthly.
Europe: Regulatory Innovation Hub
Europe’s payment gateway market is forecast to grow at an 11% CAGR between 2023-2030, expanding from $37.8 billion to $78.6 billion. The European Central Bank reports that card payments within the euro area reached 44.0 billion transactions in H1 2025, up 9.6% from the same period in 2024. Contactless payments now represent 83% of non-remote card transactions by volume and 67% by value.
Latin America: Digital Payment Revolution
Brazil’s Pix instant payment system has become a global case study, with usage climbing 74% during 2023. The system has transformed how Brazilians transact, processing billions of instant transfers and reducing reliance on traditional card networks. Mexico’s CoDi system is following a similar trajectory, driving B2B payment digitalization across the region.
| Region | Market Share | Growth Rate | Key Statistic |
|---|---|---|---|
| North America | 29.6-47% | 7-9% | $36.75B US market by 2030 |
| Asia-Pacific | 25-30% | 14.48% CAGR | 130B+ transactions in India 2025 |
| Europe | 20-25% | 11% CAGR | 44B card transactions H1 2025 |
| Latin America | 5-8% | 12-15% | 74% Pix growth in Brazil |
| Middle East & Africa | 3-5% | 10-12% | High mobile penetration |
Key Players & Market Share
The payment processing landscape features a mix of established financial institutions and agile fintech disruptors. Market concentration varies significantly by region and transaction type.
Top U.S. Payment Processors by Volume (2025)
According to industry data compiled by Panagiotis Kriaris, the leading U.S. payment processors by estimated 2025 processing volume are:
- Global Payments Inc.: $2.77 trillion
- J.P. Morgan: $2.45 trillion
- Fiserv: $2.20 trillion
- Stripe: Growing rapidly, dominant in e-commerce
European Acquirer Landscape
The top 5 European acquirers account for 54% of payment volume and 40% of transactions: Worldpay, Nexi, Barclays, Adyen, and Fiserv. Barclays processed the highest transaction value in 2022 at $786.3 billion, while Worldpay led in transaction count with 11.2 billion transactions. Nexi operates the largest merchant network with 1.98 million outlets and 2.92 million POS terminals.
Technology Leaders
Forrester’s evaluation of merchant payment providers identifies Stripe, Adyen, and Fiserv as market leaders. These vendors combine payment gateway functionality, processing capabilities, acquiring services, and fraud detection into unified platforms. Adyen stands out with the highest proportion of web-based transactions (76%) among top European acquirers.
| Company | Region | Key Metric | Notable Strength |
|---|---|---|---|
| Global Payments | Global | $2.77T volume | Scale & reach |
| J.P. Morgan | Global | $2.45T volume | Enterprise clients |
| Stripe | Global | Leading fintech | Developer experience |
| Adyen | Europe/Global | 76% web transactions | Omnichannel platform |
| Worldpay | Europe | 11.2B transactions | Transaction volume leader |
| Barclays | UK/Europe | $786.3B value | Value processed leader |
Industry Benchmarks & KPIs
Payment performance metrics reveal significant variation between average and best-in-class merchants. Understanding these benchmarks is critical for optimizing revenue and reducing costs.
Authorization & Conversion Rates
According to GR4VY’s 2026 benchmarks, average payment approval rates hover around 92%, but best-in-class merchants achieve 96%. This 4-percentage-point gap represents substantial revenue opportunity. Authorization rates vary significantly by region, issuer, and acquirer—smart routing can improve performance by directing transactions to optimal processing paths.
Cart Abandonment & Checkout Performance
Testlio research indicates that 62% of consumers abandon their carts if they encounter problems during checkout. Payment-related friction—including limited payment options, security concerns, and technical failures—represents a primary driver of lost revenue. Offering localized payment methods is critical: 93% of global consumers say pricing in their local currency affects their purchase decision.
Transaction Costs & Fees
Payment processing fees vary widely based on transaction type, volume, and risk profile. Rising network and interchange fees are compressing processor margins globally. Visa, American Express, and Discover have announced further fee increases, while a proposed $30 billion settlement would only reduce average rates by up to 7 basis points. For merchants, understanding fee structures—including interchange-plus versus flat-rate pricing—is essential for cost optimization.
Fraud & Chargeback Metrics
Fraud remains a critical concern, with card-not-present channels experiencing escalating chargeback liability. AI-powered fraud detection systems can potentially reduce processing costs by 30% while improving security. The chargeback rate—measuring disputed transactions as a percentage of total sales—serves as a key risk indicator. Excessive chargebacks can result in merchants being classified as high-risk by processors.
| KPI | Average | Best-in-Class | Impact |
|---|---|---|---|
| Authorization Rate | 92% | 96% | 4% revenue lift potential |
| Cart Abandonment | 62% | 45-50% | Payment friction reduction |
| Local Currency Preference | 93% of consumers | N/A | Localization critical |
| AI Fraud Cost Reduction | Baseline | 30% savings | Operational efficiency |
| Cross-Border Fee Reduction (A2A) | Standard | 75% lower | Real-time payments benefit |
Trends & Predictions: 2026-2031
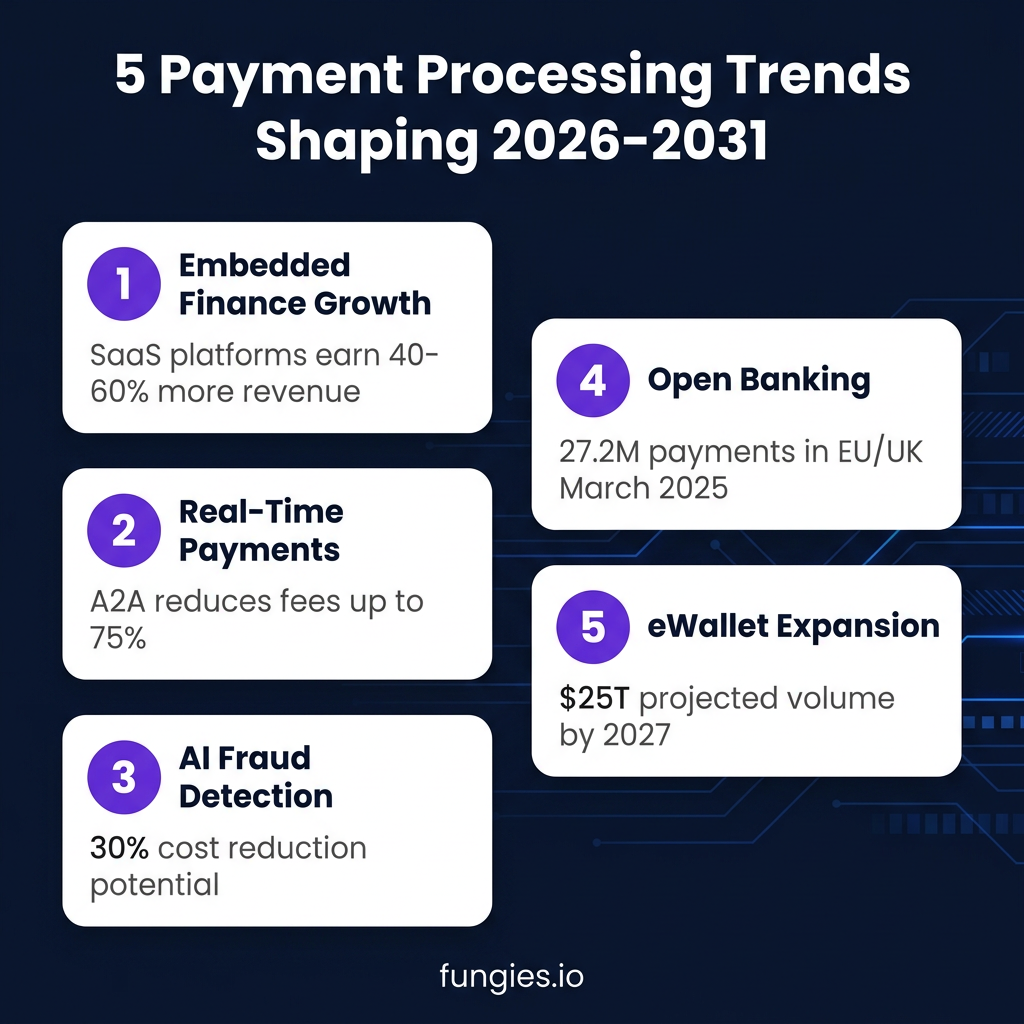
The payment processing industry is evolving rapidly. Five major trends will shape the landscape through 2031:
1. Embedded Finance Revolution
SaaS platforms are integrating issuing, lending, and treasury services alongside payment acceptance. According to Adyen and BCG research, SaaS vendors now earn more than half of their revenue from embedded payments, representing a $185 billion ecosystem. Processors enabling embedded finance capture 40-60% more revenue per merchant compared to standalone services.
2. Real-Time Payment Expansion
Account-to-account (A2A) real-time payment schemes are transforming cross-border transactions. The Bank for International Settlements’ Project Nexus connects India, Malaysia, Philippines, Singapore, and Thailand, enabling instant transfers for 1.7 billion inhabitants. These systems reduce settlement times from days to seconds and can lower cross-border fees by up to 75%. The global real-time payments market is projected to grow from $47.06 billion in 2026 to $498.99 billion by 2034—a 34.3% CAGR.
3. AI-Powered Fraud Prevention
Machine learning and artificial intelligence are becoming essential for fraud detection and prevention. AI systems can analyze transaction patterns in real-time, identifying suspicious activity with greater accuracy than rule-based systems. The potential 30% cost reduction from AI implementation represents a compelling ROI for merchants and processors alike.
4. Open Banking Acceleration
Open banking mandates in the EU and UK have generated substantial third-party processing volumes. By March 2025, open banking payments reached 27.2 million transactions valued at GBP 12.9 billion ($16.2 billion)—a 67% year-over-year increase. Variable recurring payments already represent 13% of these transactions, indicating merchant adoption of subscription models powered by open banking.
5. E-Wallet Dominance
E-wallet transactions are projected to grow at a 14.82% CAGR, with global wallet volume expected to reach $25 trillion by 2027. While credit cards maintain 44.55% of payment processor market revenue, the shift toward digital wallets—particularly in Asia-Pacific and emerging markets—will reshape competitive dynamics. Mobile wallets already account for the largest share of e-commerce payment transactions globally.
Methodology
This report synthesizes data from authoritative industry sources including Mordor Intelligence, Precedence Research, Grand View Research, the European Central Bank, McKinsey & Company, and Merchant Savvy. Market size figures represent the most recent available estimates as of June 2026. CAGR calculations reflect compound annual growth rates based on stated forecast periods. Regional market shares are derived from analyst reports and may vary based on methodology and market definition. All figures are presented in U.S. dollars unless otherwise specified. Data limitations include varying definitions of “payment processing” across sources and reporting lag for 2026 figures.
Frequently Asked Questions
What is the size of the payment processing market in 2026?
The payment processor market is valued at $71.15 billion in 2026, while the broader payment processing solutions market reaches $208.57 billion. The entire global payments industry generated approximately $2.6 trillion in revenue in 2026.
What is the growth rate of the payment processing industry?
The payment processor market is projected to grow at an 11.4% CAGR from 2026 to 2031. The broader payment processing solutions market is expanding faster at a 19.76% CAGR from 2026 to 2035.
Which region has the largest payment processing market?
North America commands the largest market share at 29.6-47%, depending on measurement methodology. The United States alone represents a $36.75 billion market opportunity by 2030.
What is the fastest growing payment method?
E-wallets and digital wallets are the fastest growing payment methods, expanding at a 14.82% CAGR and projected to reach $25 trillion in global volume by 2027. Real-time A2A payments are growing even faster at 34.3% CAGR.
How can merchants reduce payment processing costs?
Merchants can reduce costs by: (1) Implementing AI-powered fraud detection (up to 30% savings), (2) Adopting real-time A2A payments for cross-border transactions (up to 75% fee reduction), (3) Optimizing authorization rates through smart routing, and (4) Negotiating interchange-plus pricing versus flat-rate structures.
Sources & Citations
- Mordor Intelligence. “Payment Processor Market Size & Share Analysis – Growth Trends and Forecast (2026 – 2031).” https://www.mordorintelligence.com/industry-reports/payment-processor-market
- Precedence Research. “Payment Processing Solutions Market Size to Hit USD 1051.93 Bn by 2035.” https://www.precedenceresearch.com/payment-processing-solutions-market
- Merchant Savvy. “Global Digital Payments Market Statistics 2026.” https://www.merchantsavvy.co.uk/digital-payment-market
- European Central Bank. “Payments statistics: first half of 2025.” https://www.ecb.europa.eu/press/stats/paysec/html/ecb.pis2025h1~36edd636c8.en.html
- McKinsey & Company. “The 2025 McKinsey Global Payments Report.” https://www.mckinsey.com/industries/financial-services/our-insights/global-payments-report
- Fortune Business Insights. “Real-Time Payments Market Size | Industry Report, 2034.” https://www.fortunebusinessinsights.com/real-time-payments-market-110424
- Airwallex. “32 Payment Processing Industry Statistics + Trends [2025].” https://www.airwallex.com/us/blog/payment-processing-industry-statistics
- GR4VY. “Top 12 payment performance benchmarks for 2026.” https://gr4vy.com/posts/top-12-payment-performance-benchmarks-for-2026
- Testlio. “Payment Statistics to Inform Testing Strategies.” https://www.testlio.com/blog/payment-testing-statistics
- Forrester. “Merchant Payment Processing: Champion/Challenger Models.” https://www.forrester.com/blogs/merchant-payment-processing-champion-challenger-models-make-vendors-earn-their-volume
- Bank for International Settlements. “Project Nexus completes blueprint.” https://www.bis.org/
- Adyen & BCG. “The Embedded Finance Report.” https://www.adyen.com/
- Research and Markets. “Payment Processing Solutions Market Report 2025.” https://www.researchandmarkets.com/reports/5785500/payment-processing-solutions-market-report
- GM Insights. “Payment Processing Solutions Market Size & Share 2025.” https://www.gminsights.com/industry-analysis/payment-processing-solutions-market
At Fungies.io, we help game developers and SaaS companies accept payments globally with built-in tax compliance. Our checkout solution handles the complexity of payment processing so you can focus on building great products.